
eCommerce
Footwear Brand Financial Benchmarks 2026
Footwear gross margins run 42-58% across the five largest public US comps, but operating margins collapse to a 3-23% spread. The metrics that decide profitability are return rate (25-31% of shoe orders), inventory turns (4-5x), and CAC against a target LTV:CAC of at least 3:1.
Key Takeaways
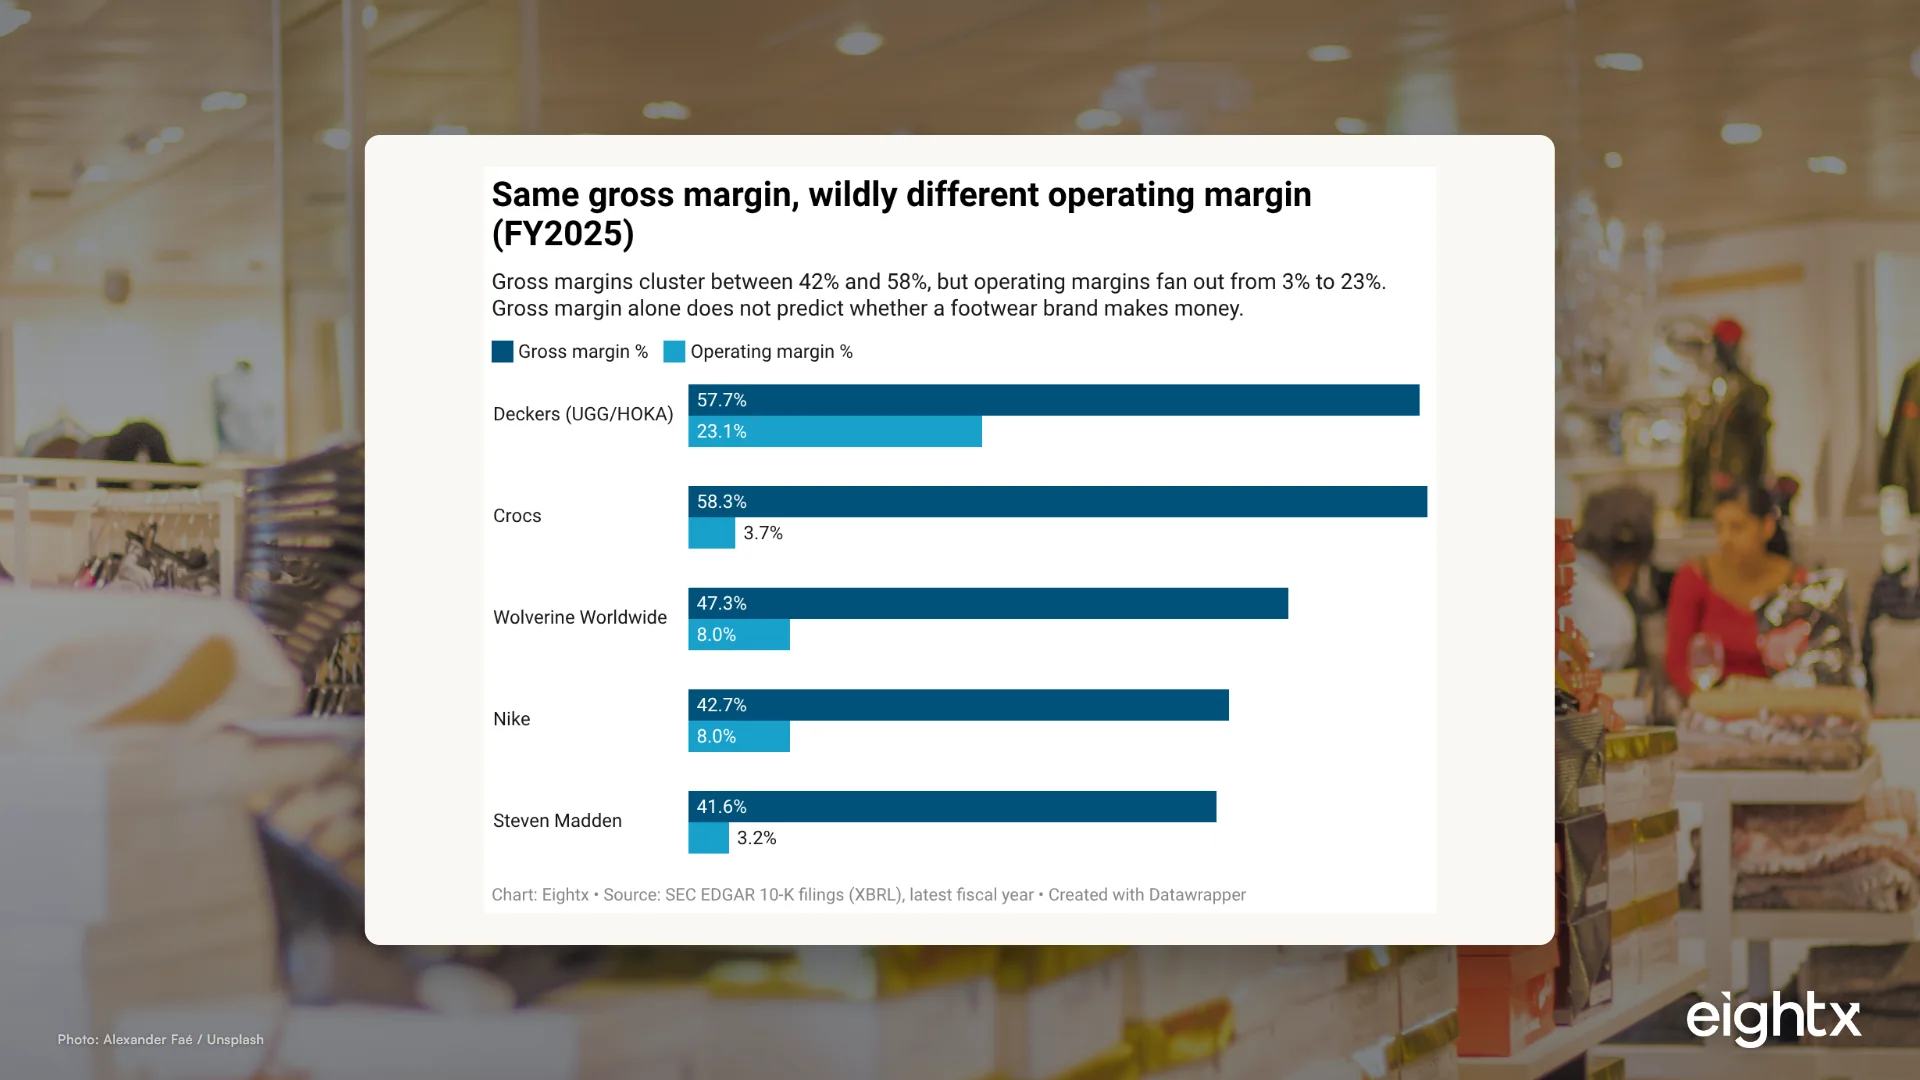
- Footwear gross margins span 41.6% to 58.3% across the five largest public US comps (FY2025), median 47.3%. But gross margin is the metric that lies. Deckers and Crocs both run ~58% gross margin and post operating margins 6x apart.
- Operating margin is where shoe brands live or die: a 3.2% to 23.1% spread, median 8.0%. Deckers posts 23.1%; Crocs fell to 3.7% and Steven Madden to 3.2% in FY2025 on one-time items. Defend operating margin, not the headline gross number.
- Inventory turns are footwear's most consistent benchmark: 4.0x to 5.8x, median ~4.7x. Below 3x and you have a size-curve or dead-stock problem trapping cash in half-sizes nobody is buying.
- Footwear is the single highest-return category in ecommerce: roughly 25-31% of shoe orders come back. Refunds (cash out the door) run ~18.5% of footwear orders, higher than apparel, because shoe returns are about fit, not style.
- Aim for LTV:CAC of at least 3:1. At ~$110 AOV and ~55% gross margin, that usually forces blended CAC below $60-70 unless your repeat rate is exceptional. Footwear CAC drifts to the high end ($60-90+) as sneaker-segment paid traffic inflates.
Footwear looks like a simple business and runs like a brutal one. Pull the latest 10-Ks for the five biggest US-GAAP footwear filers and you find gross margins between 42% and 58%, which looks healthy across the board. Then you load in marketing, returns processing, and the cost of carrying every half-size in every width, and operating margins collapse to a 3% to 23% spread. This is the flagship benchmark the footwear money page and every footwear guide on this site uplinks to, built on real public-company filings (SEC EDGAR), DTC category data, and the patterns we see sitting across the table from shoe-brand founders. The read for a private operator: stop optimizing the metric that looks healthy and start defending the three line items that actually decide footwear profitability.
Gross margin is the metric that lies to footwear founders
Here is the paradox that should reset how you read your own P&L. Deckers (the UGG and HOKA parent) and Crocs both posted gross margins right around 58% in their latest fiscal year. On gross margin alone they look like the same business. They are not. Deckers turned that into a 23.1% operating margin. Crocs turned it into 3.7%. Same gross margin, operating margins 6x apart.
The reason is that gross margin only subtracts the cost of the shoe itself. Everything that actually breaks footwear brands lives below that line: paid acquisition against a category where customers comparison-shop on price, returns processing on a quarter of your orders, and the working capital sunk into a size-and-width matrix. Two brands can buy and sell shoes at identical landed cost and one prints money while the other barely breaks even, entirely on how they manage the stuff gross margin ignores.
When I talk to founders running a brand this size, the number they lead with is almost always gross margin, because it is the one that looks good in the deck. They will tell me they are at 62% and feel safe. Then we walk down the P&L and find returns eating 9 points of contribution, paid acquisition eating another 18, and a freight-and-3PL line they had mentally rounded to zero. The brand quoting 62% gross margin was running single-digit operating margin and did not know it. Gross margin is where the conversation starts. It is never where it should end.
What the public footwear comps actually earn
Here is the full benchmark set: the five largest public footwear filers, latest reported fiscal year, straight from their SEC 10-K filings. Use it as the wall to measure your own numbers against. Note the gross-margin spread is wide (the brand-equity premium between Steven Madden at 41.6% and Crocs at 58.3% is worth ~16 margin points), but the operating-margin spread is where the real story sits.
| Brand | Ticker | Fiscal year end | Revenue ($M) | Gross margin | Operating margin | Inventory turns |
|---|---|---|---|---|---|---|
| Nike | NKE | May 2025 | 46,309 | 42.7% | 8.0%* | n/a* |
| Deckers | DECK | Mar 2026 | 5,472 | 57.7% | 23.1% | 4.8x |
| Crocs | CROX | Dec 2025 | 4,041 | 58.3% | 3.7% | 4.7x |
| Steven Madden | SHOO | Dec 2025 | 2,522 | 41.6% | 3.2% | 5.8x |
| Wolverine Worldwide | WWW | Jan 2026 | 1,874 | 47.3% | 8.0% | 4.0x |
Two FY2025 numbers need a flag, because the volatility is the lesson. Crocs did not become a bad business overnight: its operating margin fell from ~25% in FY2024 to 3.7% on a HeyDude-related impairment. Steven Madden's drop to 3.2% came from acquisition and integration costs. Both are reported GAAP figures, one-time items included. We show them as reported on purpose, because the thing a private operator should take away is not "Crocs is unprofitable." It is that footwear operating margin is fragile enough that a single bad acquisition or a stale inventory write-down can wipe out most of a year's profit. The pattern we see again and again is brands that nail the product and the margin and then lose a year to one avoidable inventory or M&A decision.
Inventory turns: the one number footwear gets graded on
If gross margin is the metric that lies, inventory turnover is the one that tells the truth quietly. It is the tightest benchmark in the whole set. Computed as COGS over ending inventory, the public comps land between 4.0x (Wolverine) and 5.8x (Steven Madden), clustering near a median of ~4.7x. A healthy shoe brand turns its inventory roughly four to five times a year. That is the band.
Why does footwear get graded so hard on turns? Because a shoe is not one SKU, it is a matrix. Every style ships in a curve of sizes, sometimes in multiple widths, sometimes in multiple colorways. When you buy that curve wrong, the middle of the size run sells through and the tails (the very small and very large sizes) sit. Those orphaned sizes are dead stock, and dead stock is cash you cannot spend on the next drop. Turns below 3x almost always mean a size-curve problem, not a demand problem. The shoes sold; you just bought the wrong distribution of them.
When we have struggled to fix a slow-turning footwear brand, the lever was rarely "sell harder." It was buying a tighter curve, going deeper on the four or five core sizes that actually move and shallower on the tails, and clearing the orphaned stock fast rather than discounting the whole line. One brand we saw was sitting near 2.5x turns with a warehouse full of size 5 and size 12; the fix was a leaner buy and a hard markdown on the tails, and turns moved back toward 4x within two seasons. The cash that freed up funded the next launch without a line of credit.
The return-rate tax nobody prices in
Footwear is the single highest-return category in all of ecommerce. Across the frames we triangulated, shoes come back at roughly 25-31% of orders, against ~20% for ecommerce overall and ~14% for DTC across all verticals. Our own fashion data puts shoes at the top of the subcategory list at 31.4%. The reason is mechanical: shoe returns are about fit, not taste. Customers order two sizes to find one that fits, and ship the other back. They are not rejecting the product, they are completing a sizing experiment at your expense.
This is where the return-versus-refund distinction matters to your bank account. Return rate counts every order that comes back, including exchanges. Refund rate counts the share where cash actually leaves your account. Footwear refunds run ~18.5% of orders, higher than apparel's ~17.5%, precisely because shoe returns convert to refunds more often than to exchanges. The customer wanted a 9, not a different shoe, and if you are out of 9s the order refunds. Every refunded order carries the original CAC, the outbound shipping, the inbound shipping, and the labor to inspect and restock (or write off) the pair. Price that fully and a 28% return rate can quietly erase the contribution margin your gross-margin line promised.
| Metric | Good | Typical | Warning |
|---|---|---|---|
| Gross margin | 60%+ | 50-60% | <45% |
| Return rate (orders) | 15-25% | 25-30% | >30-35% |
| Inventory turns | 5x+ | 4-5x | <3x |
| AOV (mid-market) | $120-150 | $90-120 | <$80 |
| CAC (blended) | <$45 | $45-70 | >$70 |
| LTV:CAC | 4:1+ | 3:1 | <3:1 |
| 2nd-order repeat rate | 40%+ | 28-35% | <25% |
One methodology note so you do not get whiplash comparing sources. Single-merchant Shopify-tagged footwear returns are often reported near 9%, far below the 25-31% category figure. They measure different things: the 9% is tagged returns at one merchant's checkout, while the category number is survey-based across the whole footwear market including bracketing behavior. We lead with the 25-31% category frame here because it is the honest planning number for a DTC shoe brand. If your reported number looks like 9%, check whether your returns are actually being tagged.
CAC, AOV and the LTV math for a private shoe brand
Now translate the public-comp economics down to a $5-50M DTC shoe brand. Average order value for mid-market footwear runs $90-150, higher than basic apparel because a shoe is a single high-ticket item per order. Value footwear sits at $70-100, premium and direct-first sneaker brands at $150-220+. On acquisition, blended CAC for DTC fashion and footwear runs roughly $37-70, with footwear drifting to the high end ($60-90+) in competitive sneaker segments where paid traffic is expensive.
The constraint that ties it together is LTV:CAC of at least 3:1. At an AOV around $110 and a gross margin around 55%, your first-order gross profit is roughly $60 before the return tax comes out. If your CAC is also $60, your first order barely washes its face (and the return tax pushes it underwater), so the entire business case rests on the second purchase. That is the problem, because the average DTC brand only retains about 28% of customers to a second order. Footwear runs slightly better than average when fit and quality are good, but you cannot assume it.
When I talk to founders running a shoe brand this size, the LTV:CAC number they quote is almost always on a time horizon they cannot name. A 12-month LTV against a 3:1 standard that quietly assumes a 24-month window will tell you that you are healthy when you are bleeding. The operators who get this right can say in one breath which horizon their ratio is on, what their actual second-order repeat rate is, and what a refunded order really costs them once shipping both ways and restocking labor are loaded in. If you cannot answer those three, the ratio is decoration.
How to benchmark your own footwear P&L this quarter
Five numbers, and where to find your own version of each.
Pull your fully loaded gross margin, not the sticker version. Start from net revenue, subtract landed product cost, inbound freight, and duties. If your real number is 8-15 points below the figure you quote in meetings, you found your first leak. This is the number to defend, but only after you have made it honest.
Compute your inventory turns the simple way: trailing COGS over current inventory. If you are under 3x, run a size-curve analysis before you place the next buy. Find the sizes that are sitting and stop buying them deep.
Separate your return rate from your refund rate. Most footwear brands track returns and never isolate the cash-out refund line. Get the refund percentage and multiply it by your fully loaded reverse-logistics cost per pair. That product is your return tax, and it usually surprises people.
Put your blended CAC next to your first-order gross profit, then name your LTV horizon out loud. If first-order profit does not cover CAC, write down exactly what second-order behavior the model is assuming, then check it against your actual repeat rate.
Compare yourself to the table, not to your gut. This benchmark exists so you can stop guessing whether 28% returns or 4x turns is normal for footwear. It is. The question is whether your specific numbers clear the band, and which one is dragging.
This population is large and mid-market heavy: Storeleads counts 44,575 active Shopify footwear stores (72,565 across all platforms), and only 4.6% are on Shopify Plus. Most footwear brands are doing this math on a spreadsheet with no finance hire. If you want a second set of eyes on which line item is quietly costing you the most, that is exactly the work a fractional CFO does. You can also compare across categories with our apparel financial benchmark.
Gross margin is the number footwear founders lead with and the one that tells them the least. Two public brands at identical ~58% gross margin posted operating margins 6x apart, entirely on returns, acquisition cost, and inventory discipline. Defend the three line items gross margin ignores, and the rest of the P&L follows.
Sources and methodology
SEC EDGAR (primary). Financial statements were pulled via the sec-edgar tool using the XBRL as filed, latest annual (10-K) period per company. Deckers Outdoor (CIK 910521, FY ending March 2026): revenue $5,472.3M, gross profit $3,157.7M, operating income $1,262.9M, ending inventory $487.0M, COGS $2,314.6M. Crocs (CIK 1334036, FY ending December 2025): revenue $4,040.6M, gross profit $2,357.1M, operating income $149.5M (down from $1,021.9M in FY2024 on a HeyDude-related impairment), ending inventory $356.3M, COGS $1,683.6M. Steven Madden (CIK 913241, FY ending December 2025): revenue $2,521.5M, gross profit $1,049.5M, operating income $80.8M (down from $224.9M in FY2024 on acquisition and integration costs), ending inventory $257.6M, COGS $1,484.6M. Wolverine Worldwide (CIK 110471, 53-week FY ending January 2026): revenue $1,874.3M, gross profit $886.7M, operating income $150.2M, ending inventory $247.8M, COGS $987.6M. (The XBRL period tag reads "FY2024" but this is the fiscal year reported February 2026; we label it FY2025/Jan 2026 in the table to match the period it covers.) Nike (CIK 320187, FY ending May 2025): revenue $46,309M, gross profit $19,790M, SG&A $16,088M.
Metric definitions. Gross margin is gross profit over revenue. Operating margin is operating income over revenue. Inventory turns are COGS over ending inventory, a single-point simplification rather than an average-inventory calculation. Nike's operating margin is shown as a (gross profit minus SG&A) / revenue proxy because operating income was not cleanly tagged in the latest XBRL pull, and Nike inventory turns are marked n/a for the same reason. All figures are company-reported GAAP, not adjusted or non-GAAP.
Excluded comps. On Holding (ONON) and Birkenstock (BIRK) are foreign private issuers that file 20-F in IFRS, so the us-gaap XBRL pull returned empty arrays for them. Skechers (SKX) was taken private in 2025 and is no longer a current SEC filer. Their absence skews this set toward legacy and value brands; a private operator benchmarking a premium-growth sneaker brand should treat the gross-margin ceiling here as conservative.
Storeleads (category aggregates). Store counts come from a Storeleads query on the Shopify Apparel/Footwear category, accessed 2026-06-11: 44,575 active Shopify footwear stores, 2,071 on Shopify Plus (4.6%), 12,680 US-based (28.4%), and 72,565 footwear stores across all platforms. Revenue-band segmentation was not reliably available from the API for this pull and is out of scope for this version.
Triangulation layer. Return-rate, refund-rate, AOV, repeat-rate and CAC benchmarks were triangulated through Perplexity and Parallel.ai deep research against vendor and primary sources including Eightx return and refund data, MHI, Photta, Branvas, Fittingbox, Yotpo and Swell, plus Crocs' FY2025 investor-relations release and Macrotrends/Finbox ratio histories for the public comps. Where category survey figures and single-merchant tagged figures disagreed (notably footwear returns at 25-31% survey-based versus ~9% Shopify-merchant-tagged), we lead with the category frame and footnote the contrast, because they measure different populations.
Limitations. Public-company comps carry wholesale and retail mix that a pure DTC brand does not, so the private benchmark ranges in the second table are set deliberately higher on gross margin than the comps. The DTC ranges are synthesis estimates from cross-vertical benchmark sources, not a single audited dataset, and should be treated as planning bands rather than precise targets.
Frequently asked questions
what is a good gross margin for a footwear brand?
For a DTC shoe brand, 60%+ gross margin is strong, 50-60% is typical, and below 45% is a warning sign. The public comps run 42-58%, but those carry wholesale mix. A direct-first brand should sit higher. Just remember gross margin alone does not tell you if you are profitable.
why is my shoe brand's operating margin so much lower than my gross margin?
Because footwear loads enormous cost between gross profit and operating profit: paid acquisition, returns processing and reverse logistics, and the cost of carrying every half-size in every width. The public comps show two brands with identical ~58% gross margin landing 6x apart on operating margin. The gap is all in those line items.
what is a healthy inventory turnover rate for a footwear brand?
Roughly 4-5x a year is the healthy band, and it is the most consistent benchmark in footwear. The public comps cluster at 4.0x to 5.8x. Below 3x usually means a size-curve problem: you bought a curve the market did not want and the odd sizes are sitting as dead stock.
what return rate should a footwear dtc brand expect?
Plan for 25-30% of orders to come back, with anything under 20% excellent and above 35% a red flag. Shoes are the highest-return category in ecommerce because the buying decision is about fit, and customers order two sizes to find one that works.
what's the difference between a footwear return rate and a refund rate?
Return rate is the share of orders that come back for any reason, including exchanges. Refund rate is the share where cash actually leaves your account. Footwear refunds run ~18.5% of orders, higher than apparel, because shoe returns convert to refunds rather than exchanges more often. The customer wanted a different size, not a different product.
what is a good ltv to cac ratio for a footwear brand?
Target at least 3:1, with 4:1+ being strong. At ~$110 AOV and ~55% gross margin, hitting 3:1 usually means keeping blended CAC under $60-70 unless your repeat rate is well above the ~28% DTC average to a second order.
how much does it cost to acquire a customer for a dtc shoe brand?
Blended CAC for DTC fashion and footwear runs roughly $37-$70 per new customer, but footwear drifts to the high end ($60-90+) in competitive sneaker segments where paid traffic is expensive. Reference points: fashion averages ~$37 CAC; all-ecommerce runs $68-84.
how many inventory turns means i have a dead-stock problem?
Below 3x is the warning line. If healthy footwear brands turn 4-5x and you are under 3x, cash is trapped in sizes and styles that are not selling. The usual culprit is buying a size curve that does not match demand, so the tails (very small and very large sizes) pile up while the middle sells through.
Related Eightx benchmarks: Crocs Hits 26% Operating Margin and Footwear Import and Tariff Tracker 2026.