
Supply Chain
Furniture and Home Goods Import Cost Tracker 2026
US furniture and home goods imports (HS 94) hit $61.1B in 2025, down 8.9% from 2024. Vietnam passed China for the top spot at 22.5%, China 20.6%, Mexico 20.0%, so the big three split 63% of the market. With deep-sea freight near 430 in early 2026, origin mix plus tariffs plus freight set your landed cost.
Key Takeaways
- US furniture and home goods imports (HS 94) totaled $61.1B in 2025, down 8.9% from $67.0B in 2024 per US Census data.
- Vietnam is now the top origin at 22.5%, China 20.6%, Mexico 20.0%: the top three split 63% of the market.
- Chinese furniture imports collapsed 32% in one year, from $18.6B to $12.6B, which is why Vietnam took the lead.
- The deep-sea freight index sat near 430 in April 2026, roughly 47% above its 2020 floor of 292.
- Mexico sits inside USMCA and largely sidesteps the China tariff stack, which is why home-goods assembly keeps shifting there.
Ask a furniture founder what a container of sofas costs and most will quote you the factory price. That is the wrong number. The number that decides whether your next purchase order makes money is the landed cost: factory price plus the tariff on your country of origin plus ocean freight to get it here. In 2026, all three of those move, and they move in different directions depending on where you source.
So we built the tracker. We pulled full-year 2025 US Census import data for furniture and home goods (HS chapter 94) to see where the category is actually made, layered on the 2026 tariff stack, then added the deep-sea freight index to frame what it costs to move it. Origin mix, tariffs and ocean freight together set the landed-cost squeeze for every home-goods brand right now, and not one of those three is where it was in 2020.
The furniture import market shrank, and the leader changed
US importers brought in $61.1 billion of furniture and home goods in 2025, down 8.9% from $67.0 billion in 2024, per US Census trade data. The category got smaller in dollar terms even as it reshuffled underneath. The headline most founders carry around, that it all comes from China, is now wrong. Vietnam leads.
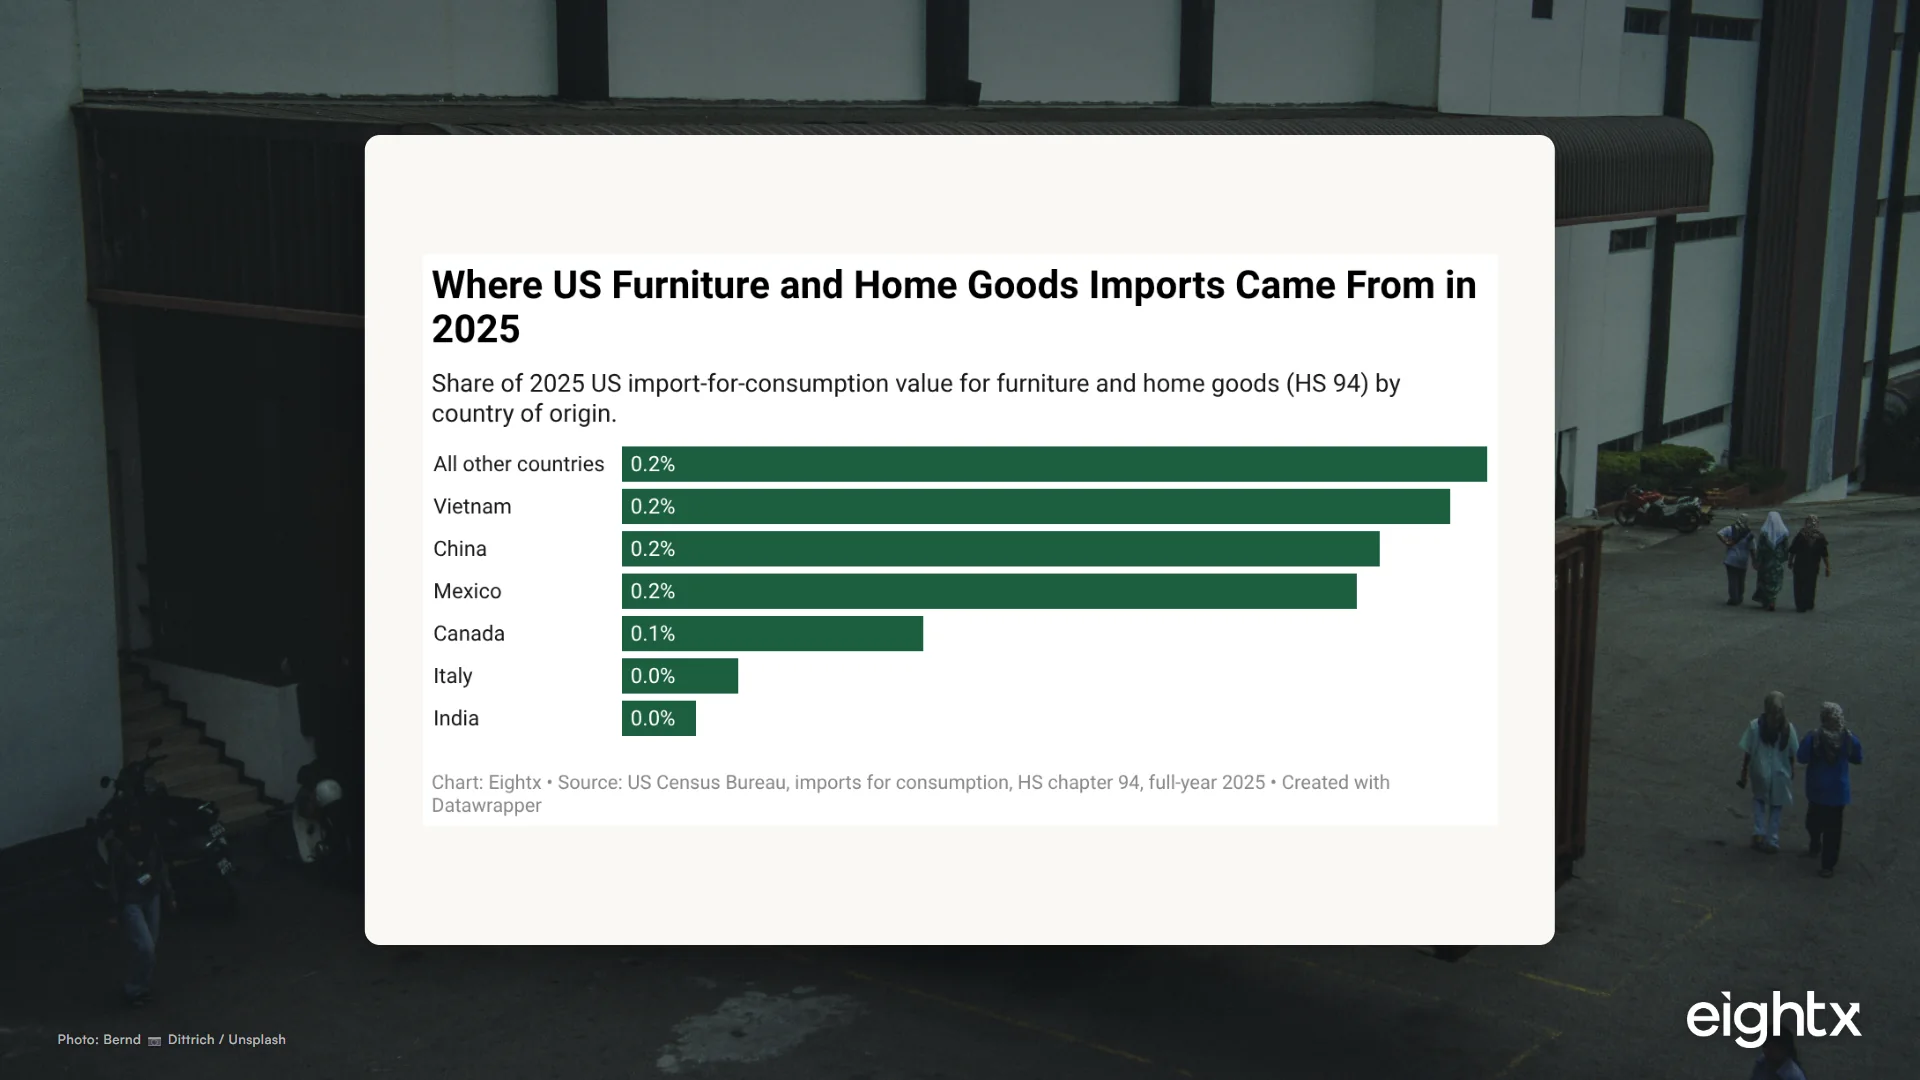
Vietnam took 22.5% of the market ($13.77B), China 20.6% ($12.58B) and Mexico 20.0% ($12.20B). Those three origins split 63% of all US furniture imports. Everyone else, including Canada at 8.2%, Italy at 3.2% and India at 2.0%, fights over the remaining third. For most brands, the real sourcing question is not "Asia or not." It is "Vietnam, China or Mexico," and that choice is now a tariff question as much as a price question.
| Origin | 2025 imports (USD B) | Share |
|---|---|---|
| Vietnam | 13.77 | 22.5% |
| China | 12.58 | 20.6% |
| Mexico | 12.20 | 20.0% |
| Canada | 5.01 | 8.2% |
| Italy | 1.93 | 3.2% |
| India | 1.22 | 2.0% |
| All other countries | 14.39 | 23.5% |
| Total HS 94 | 61.10 | 100% |
Source: US Census Bureau, imports for consumption, HS chapter 94, full-year 2025.
It also helps to know what HS 94 actually contains, because "furniture" is broader than a sofa. Two subheadings carry most of the value: seats and "other furniture" (which includes cabinets and vanities) are together 77% of the chapter, with mattresses and lighting making up most of the rest. Where your SKUs sit in this mix matters, because the furniture-specific tariffs later in this post land on some of these lines and not others.
| HS subheading | Category | 2025 imports (USD B) | Share of HS 94 |
|---|---|---|---|
| 9403 | Other furniture (incl. cabinets/vanities) | 23.97 | 39.2% |
| 9401 | Seats | 23.26 | 38.1% |
| 9405 | Lighting and illuminated signs | 8.45 | 13.8% |
| 9404 | Mattresses and bedding | 3.42 | 5.6% |
| 9406 + other | Prefab buildings and remainder | ~1.99 | ~3.3% |
Source: US Census Bureau, imports for consumption, HS 94 subheadings, full-year 2025.
The China collapse: a 32% one-year drop
The re-rank was not gradual. Chinese furniture imports fell 32.3% in a single year, from $18.57 billion in 2024 to $12.58 billion in 2025, while Vietnam rose 3.9% and Mexico slipped only 3.9%. China did not lose the top spot because Vietnam surged. It lost it because China's own volume cratered.
This is the "China minus" shift showing up in customs data, not a forecast or a survey. A third of China's furniture volume to the US disappeared in twelve months, and it did not all relocate cleanly: the total category shrank, so some of it was demand that simply did not get placed. When I talk to founders running a brand this size, the thing they keep saying is that the hardest part is not the tariff level, it is the volatility. One operator put it plainly: the worst part of the last two years was not knowing what the number would be next quarter, which makes it almost impossible to commit to a six-month production run. A 32% swing in a year is exactly that volatility, priced in.
For a sourcing decision, the read is simple. If your catalog is still heavily China-weighted, you are now sourcing from the one big origin that is actively shrinking under tariff pressure, and you are carrying its policy risk on your whole cost base. The market voted with its purchase orders, and it voted away from a single-country bet.
Why origin is a tariff decision, not just a price decision
The factory quote is the start of the conversation. The tariff is what actually separates these three origins in 2026, and the spread is large.
Chinese furniture carries the full country stack: the base most-favored-nation duty, plus Section 301, plus the IEEPA and reciprocal layers that apply to all Chinese goods. Vietnam carries its own reciprocal layer on top of the base duty. Mexico, when goods qualify under USMCA rules of origin, generally faces the base duty plus the 10% Section 122 global layer and sidesteps the China stack entirely. That is the structural reason Mexico already holds 20% of the market and keeps gaining: it is the lowest-tariff origin of the big three for qualifying goods.
On top of all of that, furniture has its own product-specific tariffs that most general tariff trackers miss. There is a 25% tariff on upholstered wooden furniture and on kitchen cabinets and bathroom vanities. Scheduled increases (upholstered to 30%, cabinets to 50%) were delayed to January 1, 2027, so both sit at 25% through 2026. That surcharge lands on top of whatever country stack already applies, which is why two identical-looking sofas can land 25 or more points apart in duty depending only on where final assembly happened and what the piece is made of.
| Cost layer | What sets it in 2026 | Why it matters for furniture |
|---|---|---|
| Factory price | Origin labor and materials | The only number most founders track |
| Country tariff | China stack vs Vietnam reciprocal vs Mexico USMCA | 20+ point spread across the big three origins |
| Product tariff | 25% on upholstered wooden furniture, cabinets, vanities | Stacks on top of the country tariff for specific HS lines |
| Ocean freight | Deep-sea freight index near 430 vs 292 in 2020 | High because furniture is bulky and fills containers |
| Landed cost | The sum of all of the above, per SKU per origin | The number your margin actually depends on |
The reason this matters past the spreadsheet is behavioral. When we talk to founders who source heavily from Asia, the question is never just "what does the tariff cost me." It is "what happens to demand when I pass it through." One operator framed it as trying to get ahead of it: whether they absorb the duty or raise prices, they expect an impact on consumer behavior, so the tariff decision is really a demand decision wearing a cost-accounting costume. That is why the landed-cost number has to flow all the way to contribution margin, the margin after cost of goods, shipping and ads, before you judge whether a sourcing move actually works.
Ocean freight is the second variable, and it is not back to 2020
Tariffs are the obvious add-on. Freight is the one brands forget, because they anchor to the cheap shipping of 2019 and 2020. That floor is gone.
The deep-sea freight producer price index ran near 430 in April 2026, against a 2020 annual average of roughly 292, per BLS data on FRED. That is about 47% above the 2020 floor. The honest framing is not "freight is spiking" but "freight is structurally elevated and volatile": it touched 445 in January 2026 and dipped toward 390 in the second half of 2025, range-bound well above the old normal rather than climbing in a clean line. A separate dollar series tells the same story. Drewry's World Container Index was $3,433 per forty-foot container on June 4, 2026, roughly 140% above its 2019 average of about $1,420.
For furniture, a low-value-to-volume category that fills containers fast, ocean freight is a bigger share of landed cost than it is for almost any other consumer good. A freight swing of 10% on a sea-shipped sofa can move landed cost more than a point of tariff. And freight moves fast: we worked with a brand that saw its container rate roughly halve between two purchase orders, which flipped the landed-cost math on a reorder it had already priced. That is why freight belongs in your model as a live variable you re-check, not a constant you set once a year. When a reorder is time-sensitive, the same volatility forces the air versus sea freight decision, where the cash and margin tradeoff rarely points the same way twice.
The factory price is not the cost. Landed cost equals factory price plus the tariff on your origin plus freight, and in 2026 all three move by country and by quarter. A home-goods brand that prices off the factory quote is setting retail against a number that no longer exists by the time the container lands.
The legal wildcard: the SCOTUS IEEPA ruling
One more thing keeps this a tracker and not a one-time number. On February 20, 2026, the Supreme Court ruled that the President's use of IEEPA to impose the reciprocal tariffs exceeded executive authority. That means the IEEPA and reciprocal layers of the 2026 stack are legally contested as of mid-2026.
Practically, this does two things. First, it means any single "this is the China rate" figure you see should be read as as-applied and subject to ongoing legal change, not settled law. Second, it does not wipe the slate clean: Section 301 on China and the furniture-specific product tariffs (the 25% on upholstered goods and cabinets) sit on separate legal footing and are not affected by the IEEPA ruling. So the stack gets thinner in the contested layers but does not disappear. The takeaway for sourcing is to model a range, not a point, and to re-check it, because the number genuinely is a moving target this year.
What to actually do about it
- Rebuild your landed-cost model per SKU, per origin. One blended landed-cost number across your catalog hides the products you are losing money on. Operators who do this well build a landed-cost allocation rate that spreads freight, customs and handling across a container by carton count, then attach it to each SKU. Break it out by product and by country so you can see which items only work from Mexico and which still pencil from Vietnam.
- Price off landed cost, not factory cost. If you set retail off the factory quote and bolt margin on top, the tariff and freight quietly eat your contribution. Anchor your markup to the all-in landed number, then push it through to contribution margin (after COGS, shipping and ads), because that is the line a tariff actually hits.
- Treat Mexico as a tariff hedge, not just a logistics one. At 20% of the market and inside USMCA, Mexico is the lowest-duty big origin for qualifying goods, with shorter transit that trims freight exposure. Model what shifting your highest-tariff SKUs there does to blended margin. Our DTC import origins by category 2026 breakdown walks the origin and tariff math across categories.
- Stress-test freight at three levels. Run your landed cost at a low (390), base (430) and high (445) freight index so a single bad ocean quarter does not surprise your cash flow. The index has touched all three inside 18 months.
- Decide whether to pass the tariff through, and model the elasticity first. The brands that get ahead of it run the scenarios before the cost lands: customer absorbs it, you split it, you absorb it. Whether you raise prices or eat the duty, you will see an impact on demand, so model it rather than discovering it.
- Watch concentration risk and your cash conversion cycle. If 80% of your COGS comes from one country, you carry that country's full tariff and policy risk, and the China collapse shows how fast that bites. Bulky, slow-moving furniture also ties up working capital for a long time, so high import costs and long lead times compound into a cash problem, not just a margin one. Compare your exposure against the rest of the field in our DTC import origins by category 2026 breakdown.
Sources and methodology
Origin shares come from US Census Bureau imports for consumption (CON_VAL_YR) for HS chapter 94, full-year 2024 and 2025, queried by partner country against the all-countries totals of $61,098,588,689 (2025) and $67,043,032,958 (2024). Vietnam, China and Mexico shares are each country's value divided by the 2025 total. "All other countries" is the 2025 total minus the six named origins. Figures are import value (customs value), not units, and the December cumulative reading is treated as the full-year total.
The China collapse figures compare each origin's 2024 and 2025 CON_VAL_YR values: China $18.57B to $12.58B (down 32.3%), Vietnam $13.26B to $13.77B (up 3.9%), Mexico $12.70B to $12.20B (down 3.9%). The HS 94 subheading mix uses the all-countries 2025 values for seats (9401), other furniture (9403), mattresses and bedding (9404) and lighting (9405).
The freight figures use the Producer Price Index for Deep Sea Freight Transportation (series PCU483111483111) from the US Bureau of Labor Statistics via FRED: the 2020 annual average of about 292, annual averages from 2019 to 2025, and the April 2026 monthly reading of about 430. This is a carrier-side price index (Index Jun 1988=100), not a per-container dollar rate. The Drewry World Container Index ($1,420 in 2019 to $3,433 on June 4, 2026, roughly 140% higher) is the separate dollar series and is cited as such, never mixed onto the index axis.
Tariff details combine the country stack (Section 301, IEEPA, Section 122 and reciprocal layers) with furniture-specific product tariffs (25% on upholstered wooden furniture, cabinets and vanities, with increases delayed to January 1, 2027), drawn from USTR presidential tariff actions and our DTC import origins by category 2026 analysis. Exact percentages are HS-line-specific and time-variable, and the February 20, 2026 Supreme Court ruling against IEEPA reciprocal tariffs makes the IEEPA and reciprocal layers legally contested. Treat every tariff figure as an estimate to confirm by your own HTS line, not a fixed rate.
Figures describe the category, not a single client. This is the kind of landed-cost modeling we build with brands as their fractional CFO.
Frequently Asked Questions
where do us furniture imports come from in 2026?
By 2025 import value, Vietnam leads US furniture and home goods imports at 22.5%, followed by China at 20.6% and Mexico at 20.0%. Those three origins split about 63% of the $61.1 billion market, so for most home-goods brands the sourcing decision is effectively a three-way choice between Vietnam, China and Mexico.
how big is the us furniture import market?
US imports for consumption of furniture and home goods (HS chapter 94) totaled $61.1 billion in full-year 2025 per US Census data, down 8.9% from $67.0 billion in 2024. That covers seating, mattresses, lighting and most home furnishings, the categories that make up the bulk of a typical home-goods brand's purchase orders.
did china furniture imports drop in 2025?
Sharply. Chinese furniture imports fell 32.3% in a single year, from $18.57 billion in 2024 to $12.58 billion in 2025, dropping China's share from about 27.7% to 20.6%. Vietnam held roughly flat and passed China for the top spot. That is the tariff-driven shift showing up in hard customs data, not a forecast.
what is landed cost for furniture and how do i calculate it?
Landed cost is product cost plus freight plus duty plus insurance and handling, the all-in cost to get a unit into your warehouse. For furniture in 2026 the two moving parts are the tariff on your country of origin and ocean freight. Calculate it per SKU per origin, because the same sofa lands at very different costs from China versus Mexico.
is there a special tariff on upholstered furniture or cabinets in 2026?
Yes. On top of the country stack, there are furniture-specific product tariffs: 25% on upholstered wooden furniture and on kitchen cabinets and bathroom vanities. Scheduled increases (upholstered to 30%, cabinets to 50%) were delayed to January 1, 2027, so both are held at 25% through 2026. Confirm by your exact HTS line, because the surcharge depends on product type.
why are home goods brands moving sourcing to mexico?
Mexico already makes 20% of US furniture imports and sits inside USMCA, so qualifying goods generally face the base duty plus the 10% Section 122 global layer rather than the full China tariff stack. Add shorter transit times that cut ocean freight exposure, and Mexico becomes the obvious nearshore hedge for home-goods assembly.
how much have ocean freight costs risen for importers?
The deep-sea freight producer price index sat near 430 in April 2026 versus a 2020 annual average of about 292, roughly 47% higher. Freight is volatile month to month, but the structural floor is well above pre-2021 levels, which is why ocean freight now materially moves furniture landed cost.
did the supreme court strike down the tariffs in 2026?
Partly. On February 20, 2026 the Supreme Court ruled that using IEEPA to impose the reciprocal tariffs exceeded the President's authority. That makes the IEEPA and reciprocal layers of the stack legally contested as of mid-2026, so treat any single tariff number as as-applied and subject to ongoing legal change, not settled. The Section 301 and furniture-specific product tariffs sit on separate legal footing.