
Supply Chain
Nearshoring Tracker: Mexico's Rise 2026
Nearshoring is real, but uneven. In full-year 2025 US Census data, Mexico was the number one source of US electronics imports at 18.3 percent and a close number three in furniture at 20.0 percent, yet held under 4 percent of apparel and 9 percent of toys. Where USMCA and assembly economics line up, the shift is genuine; elsewhere it is mostly hype.
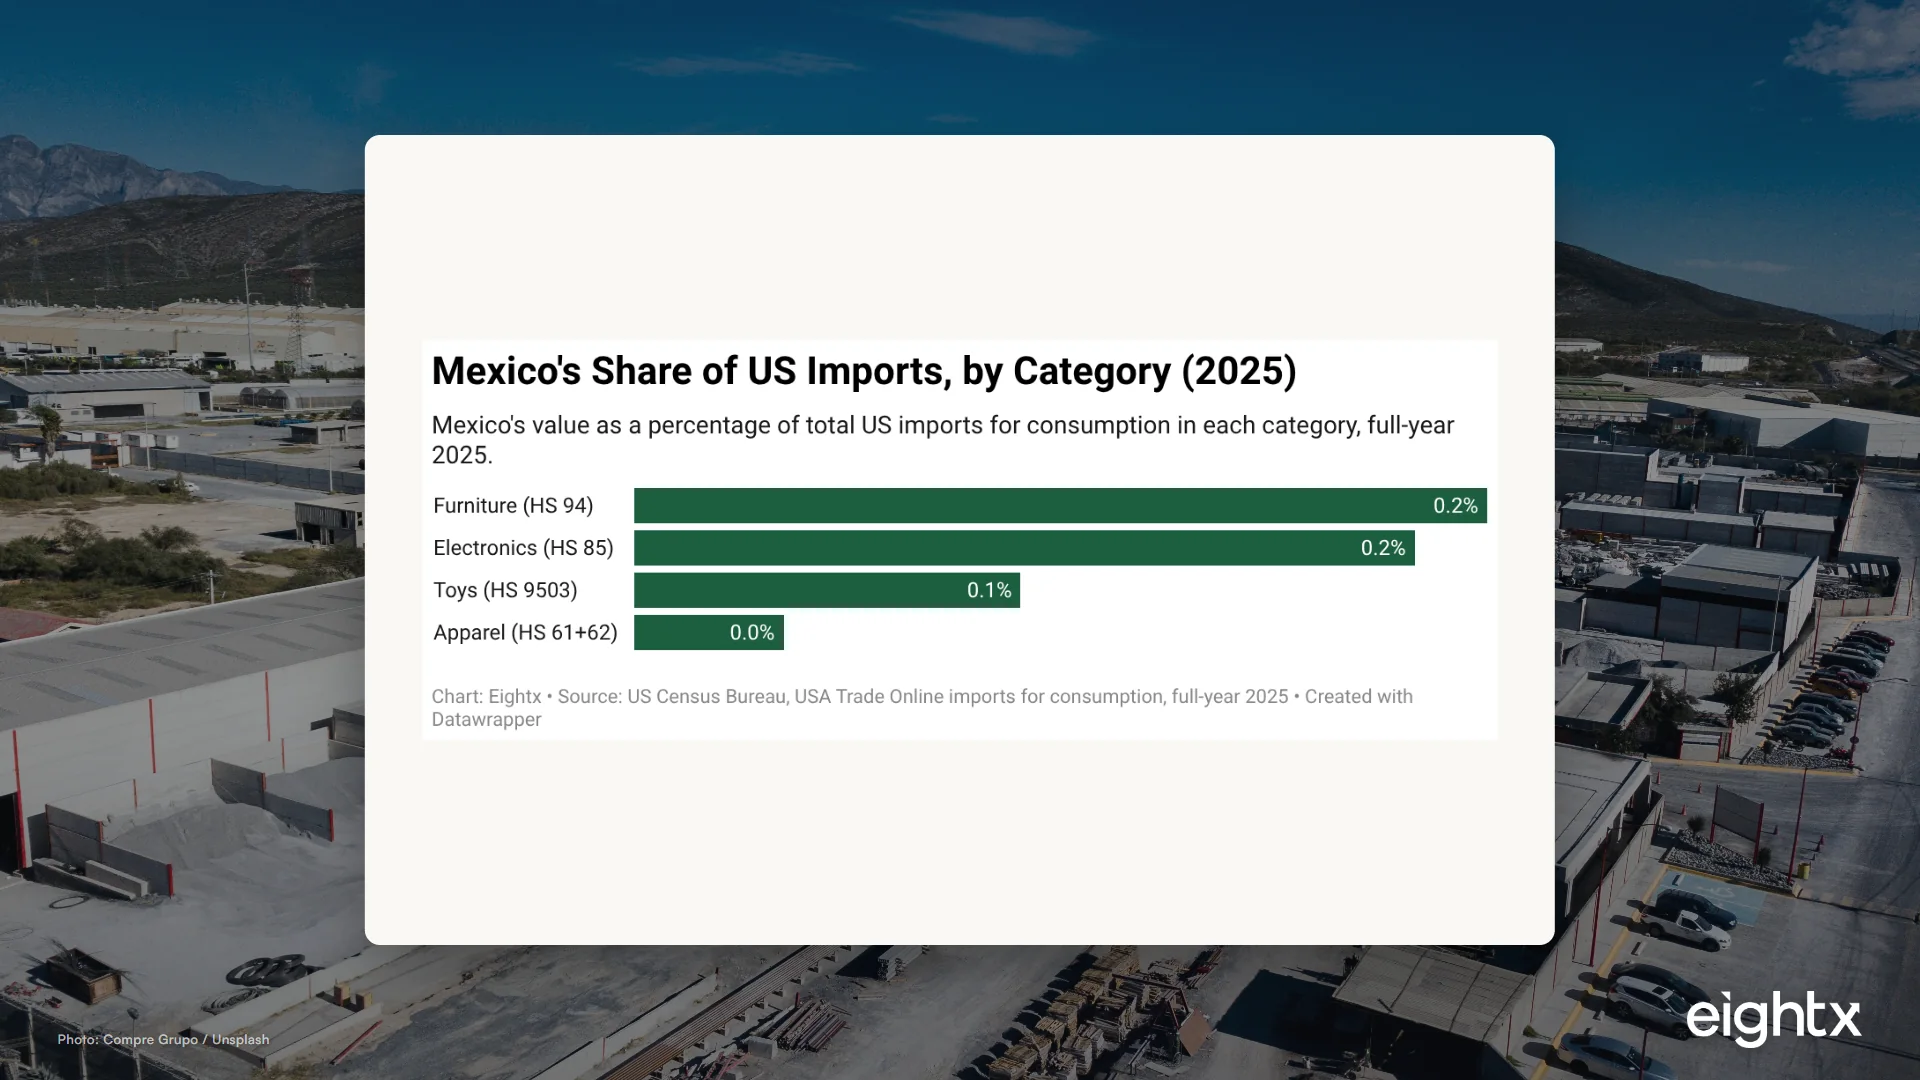
Key Takeaways
- Mexico was the single largest source of US electronics imports (HS 85) in 2025 at 18.3 percent of the total, edging out China and Vietnam.
- Mexico was a close number three in US furniture imports (HS 94) at 20.0 percent, just behind Vietnam (22.5 percent) and China (20.6 percent), still real evidence of nearshoring in a heavy, USMCA-friendly category.
- Apparel barely moved: Mexico held just 3.5 percent of combined knit plus woven apparel imports (HS 61 and 62), so the nearshoring story does not apply to most fashion DTC.
- Toys sit in the middle at 9.0 percent, with Mexico a distant number three behind China and Vietnam.
- Nearshoring is a category-by-category question, not a blanket trend. Run the numbers for your own HS codes before you re-plan your supply chain.
Nearshoring has been the most over-used word in supply chain for three years. Every consultant deck promises a great migration of production from Asia to Mexico. So we did what we always do: we went to the data and checked.
The answer is more interesting than the headline. Nearshoring is real, but it is real in specific categories and barely visible in others. If you run a DTC (direct-to-consumer) or CPG (consumer packaged goods) brand, the question is not "is nearshoring happening." It is "is it happening in my category, and does the math work for me." Here is the map.
Modeling a nearshoring move against landed cost is the job of a fractional CFO for ecommerce.
What the 2025 import data actually shows
We pulled full-year 2025 US imports for consumption from the US Census Bureau for four categories that matter to consumer brands, then divided Mexico's value by the all-country total to get Mexico's share. It is the same Census source behind our broader import origins by category tracker. The spread is wide.
Two categories tell a genuine nearshoring story. In furniture (HS 94), Mexico supplied 20.0 percent of all US imports, US$12.2 billion of a US$61.1 billion total, the number three country source and within a hair of Vietnam (22.5 percent) and China (20.6 percent). In electronics (HS 85), Mexico took 18.3 percent, US$90.7 billion of US$496.8 billion, and was the number one country, ahead of China at US$77.7 billion and Vietnam at US$65.8 billion. When a category that used to be a China-and-Asia story now has Mexico level with the leaders or on top, that is not hype. That is structural.
The other two categories say the opposite. Toys (HS 9503) sat at 9.0 percent, with Mexico a distant third behind China (US$9.2 billion) and Vietnam. And apparel, combining knit (HS 61) and woven (HS 62), came in at just 3.5 percent. Vietnam, China and Bangladesh still run that table. If you sell clothing, the nearshoring narrative is, for now, marketing.
When I talk to founders running a brand this size, the thing they keep saying is that the word "nearshoring" arrived in their inbox before any number did. A sourcing agent or a 3PL pitched the move, the deck had a Mexico flag on it, and nobody had pulled the import share for their own HS code. That is the gap this tracker is meant to close.
Get the numbers behind the headline.
The Margin breaks down one real DTC/CPG finance decision a week. Free.
Check your inbox. We'll send The Margin shortly.
Where nearshoring is real: furniture and electronics
The pattern is not random. Furniture and electronics share two features that make Mexico genuinely competitive.
First, they are either bulky or assembly-intensive, so proximity is worth money. A sofa or a flat-panel TV is expensive to ship from Asia and cheap to truck from Monterrey. Shorter lead times also free up working capital, which matters more the heavier your unit is, a dynamic we break down in our furniture import cost tracker.
Second, they fit USMCA (the US-Mexico-Canada Agreement). Goods made in Mexico that meet the rules of origin enter the US with preferential tariff treatment. Brookings found Mexico's US import share and USMCA compliance both rose in 2025, consistent with production moving south rather than fully returning to the US. Electronics assembly hubs in northern Mexican states like Baja California and Jalisco fit the pattern, where final assembly happens in Mexico even when components still come from Asia. That is a qualitative read of how the category works, not something the Census share data alone proves.
| Top US electronics suppliers (HS 85), 2025 | Import value | Share of total |
|---|---|---|
| Mexico | US$90.7B | 18.3% |
| China | US$77.7B | 15.6% |
| Vietnam | US$65.8B | 13.3% |
The honest caveat: Brookings also notes that hard evidence of brand-new nearshoring investment is still thin and partly anecdotal. A lot of the share gain is existing firms expanding plants they already had, not a wave of greenfield factories. The shift is real; the pace is slower than the slide decks claim. The pattern we see again and again is that the founders who move first in furniture and electronics are not chasing the trend. They already had a freight or a cash-cycle problem that proximity happened to fix.
Where it is mostly hype: apparel and toys
Apparel is light and labor-driven. The cost of a T-shirt is dominated by sewing labor, not freight, so the wage gap between Mexico and Vietnam or Bangladesh still outweighs the savings from a shorter trip. At 3.5 percent of US apparel imports, Mexico is a rounding error next to Asia. If you run a fashion brand and a vendor pitches you a "nearshoring" program, ask them for the landed-cost comparison before you believe it. We dug into this in our apparel import shift analysis.
Toys are in between. At 9.0 percent and a number-three rank, Mexico is on the board but nowhere near displacing China, which still ships more than seven times as much in dollar terms. Toys are light, seasonal and tooling-heavy, so the China supply base is sticky.
| Category (HS code) | Mexico share, 2025 | Mexico rank | Nearshoring verdict |
|---|---|---|---|
| Furniture (94) | 20.0% | Number 3 | Real |
| Electronics (85) | 18.3% | Number 1 | Real |
| Toys (9503) | 9.0% | Number 3 | Partial |
| Apparel (61+62) | 3.5% | Outside top 5 | Hype, for now |
When we have struggled to talk a founder out of a Mexico move that did not pencil, it was almost always an apparel brand looking at the headline tariff number and ignoring the labor line. The duty saving was real, on the order of a dozen points, but the cut-and-sew line came in roughly 25 percent higher than the Asian quote. The unit cost went up by more than the duty came down, and the all-in number was worse.
The tariff backdrop nobody can ignore
None of this happens in a vacuum. By widely reported estimates, the effective US tariff rate has climbed to its highest level since the early 1940s. That is the force pushing brands to even look at Mexico. But a higher tariff on Chinese goods does not automatically make a Mexico move profitable, because the duty saving only lands if your product clears USMCA rules of origin.
This is where founders get burned. They see "move to Mexico, skip the tariff" in a headline and re-plan a supply chain around a saving they never qualify for. The duty advantage depends on how much of the product's value is genuinely North American. A Mexican plant snapping together imported parts may not meet the threshold. The container-rate and front-loading chaos rippling through ocean freight only makes guessing more expensive.
What to do about it
Here is how I would approach this as your fractional CFO, in order.
- Pull your own HS codes. Category averages are a starting point, not your answer. Your specific product may behave very differently from the two-digit headline. The Census import data is free and granular.
- Build a real landed-cost model. Compare your current source against Mexico on four lines: unit cost, duty, freight and working capital tied up in lead time. Heavy or bulky products win on freight; labor-heavy products usually do not.
- Check rules of origin before you assume the tariff saving. Get a customs broker or trade lawyer to confirm your product would qualify under USMCA. Do this before signing anything, not after.
- Stress-test lead times and quality, not just price. A shorter, more reliable lead time out of Mexico can be worth more than a slightly lower unit cost from Asia, because it shrinks your cash conversion cycle.
- Pilot, do not pivot. Move one SKU or one component before you rebuild the whole chain. Measure the actual all-in cost over two or three POs, then decide.
Nearshoring is not a trend you join. It is a calculation you run, category by category and HS code by HS code. In furniture and electronics the math already favors Mexico for many brands. In apparel and toys it does not yet. The only number that matters is your own landed cost, and the only way to know it is to model it before you move.
Sources and methodology
Figures are from the US Census Bureau's international trade program, imports for consumption (CON_VAL_YR), full-year 2025, by HS commodity code and partner country.
We pulled one category per query: HS 94 for furniture, HS 85 for electronics, HS 61 and HS 62 for apparel, and HS 9503 for toys. For each, we requested all partner countries plus the all-country total.
Mexico's share is Mexico's import value divided by the all-country total for that category. Apparel combines HS 61 (knit) and HS 62 (woven) into a single denominator and numerator.
Country rankings (Mexico number one in electronics, number three in furniture) come from sorting the same partner-country pulls by import value. The electronics comparison table reports the top three suppliers by value.
Qualitative USMCA and nearshoring context draws on Brookings analysis and primary trade reporting, used to interpret the share figures rather than to generate them. No numbers in this post come from secondary estimates.
One caveat on the underlying numbers: imports for consumption are reported at customs value, which excludes freight and insurance. That understates the true delivered cost of heavy goods shipped from Asia, so if anything it makes the freight case for nearshoring look conservative rather than overstated.
Shares are point-in-time and will shift as the Census Bureau revises monthly data. We will refresh this tracker as full-year figures settle.
Frequently Asked Questions
is nearshoring to mexico actually happening in 2026?
Yes, but unevenly. In full-year 2025 US Census data Mexico was the number one source of US electronics imports and a close number three in furniture, real evidence of nearshoring. In apparel and toys, Asia still dominates, so the trend is category specific rather than universal.
what is mexico's share of us imports by category?
Using 2025 US Census imports for consumption, Mexico held 18.3 percent of electronics (HS 85), 20.0 percent of furniture (HS 94), 9.0 percent of toys (HS 9503) and just 3.5 percent of combined apparel (HS 61 and 62).
why is nearshoring stronger in furniture and electronics than apparel?
Furniture and electronics are heavy or assembly-intensive, so proximity and USMCA rules of origin pay off in freight and duty. Apparel is light and labor-driven, so Asian wage advantages still beat the savings from shipping shorter distances.
does moving to mexico automatically avoid us tariffs?
No. Duty-free treatment under USMCA depends on meeting rules of origin, which dictate how much of the product's value must come from North America. A factory in Mexico that uses mostly imported components may not qualify, so verify origin before you assume savings.
should my dtc brand move sourcing to mexico?
Only if the landed-cost math works for your category. Model duty, freight, lead time and working capital against your current source. For furniture and electronics the case is often strong; for apparel and toys it usually is not yet. Run your own HS codes first.
how long does it take to move production to mexico?
As a rough rule of thumb, plan on six to twelve months for a real category, longer if tooling has to move. The brands that get burned treat it like flipping a switch. The ones that win pilot one SKU, validate landed cost over two or three POs, then scale.
where does the nearshoring data come from?
From the US Census Bureau's international trade program, which publishes US imports by HS commodity code and partner country every month. We pulled full-year 2025 imports for consumption and divided Mexico's value by the all-country total for each category.