
Insights
1stDibs Financial Analysis: A 73% Margin That Loses Money
1stDibs (NASDAQ: DIBS) posted FY2025 revenue of $89.6M at a 73.0% gross margin, yet still booked a $19.0M operating loss, its fifth straight. The gap is marketing: sales and marketing ran 43 to 46% of revenue for years before management cut it to 34.7% in 2025, which drove most of the loss improvement.
Key Takeaways
- FY2025 revenue was $89.6M, up just 1.5% year over year, still below the 2021 peak of $102.7M. Four years on, the top line has gone backwards.
- Gross margin is software-like at 73.0%, up from 71.9% in 2024. This is a marketplace take-rate model, not an inventory-holding retailer.
- The operating loss narrowed to $19.0M in 2025, the fifth straight year of losses but the smallest since 2021. Adjusted EBITDA loss shrank from $8.0M to $2.4M.
- Marketing is the whole story. Sales and marketing fell from $38.1M (2024) to $31.1M (2025), a $7.0M cut that drove most of the operating-loss improvement.
- Active buyers are shrinking, not growing: roughly 61,000 exiting Q4 2025, down about 5% year over year. Revenue is flat despite fewer buyers, so the model leans on take rate, not buyer growth.
If you have ever stared at a P&L where the gross margin looks incredible and the bottom line is still red, 1stDibs is the public-company version of that exact feeling. 1stdibs.com, Inc. (NASDAQ: DIBS) is the online marketplace for high-end furniture, art, jewelry and antiques. On the gross line it reads like a software company. On the operating line it reads like a DTC brand that spent too much to acquire customers. FY2025 revenue was $89.6M at a 73.0% gross margin, and the company still lost $19.0M at the operating line, its fifth straight year of losses.
This is a fractional-CFO read of what the 10-K actually says, the way I would diligence it if a founder asked me whether the business underneath was healthy. The whole teardown comes down to one question: where do 73 points of gross margin go, and why is none of it left by the time you reach the bottom of the income statement?
The two numbers that don't agree
Start with the gap that defines the company. A 73.0% gross margin ($65.4M of gross profit on $89.6M of revenue) is the kind of number you see in SaaS, not in anything that touches physical goods. 1stDibs never holds the inventory. It runs a take-rate marketplace, so its cost of revenue is mostly payment processing and platform cost, and almost everything a seller charges flows through as gross profit.
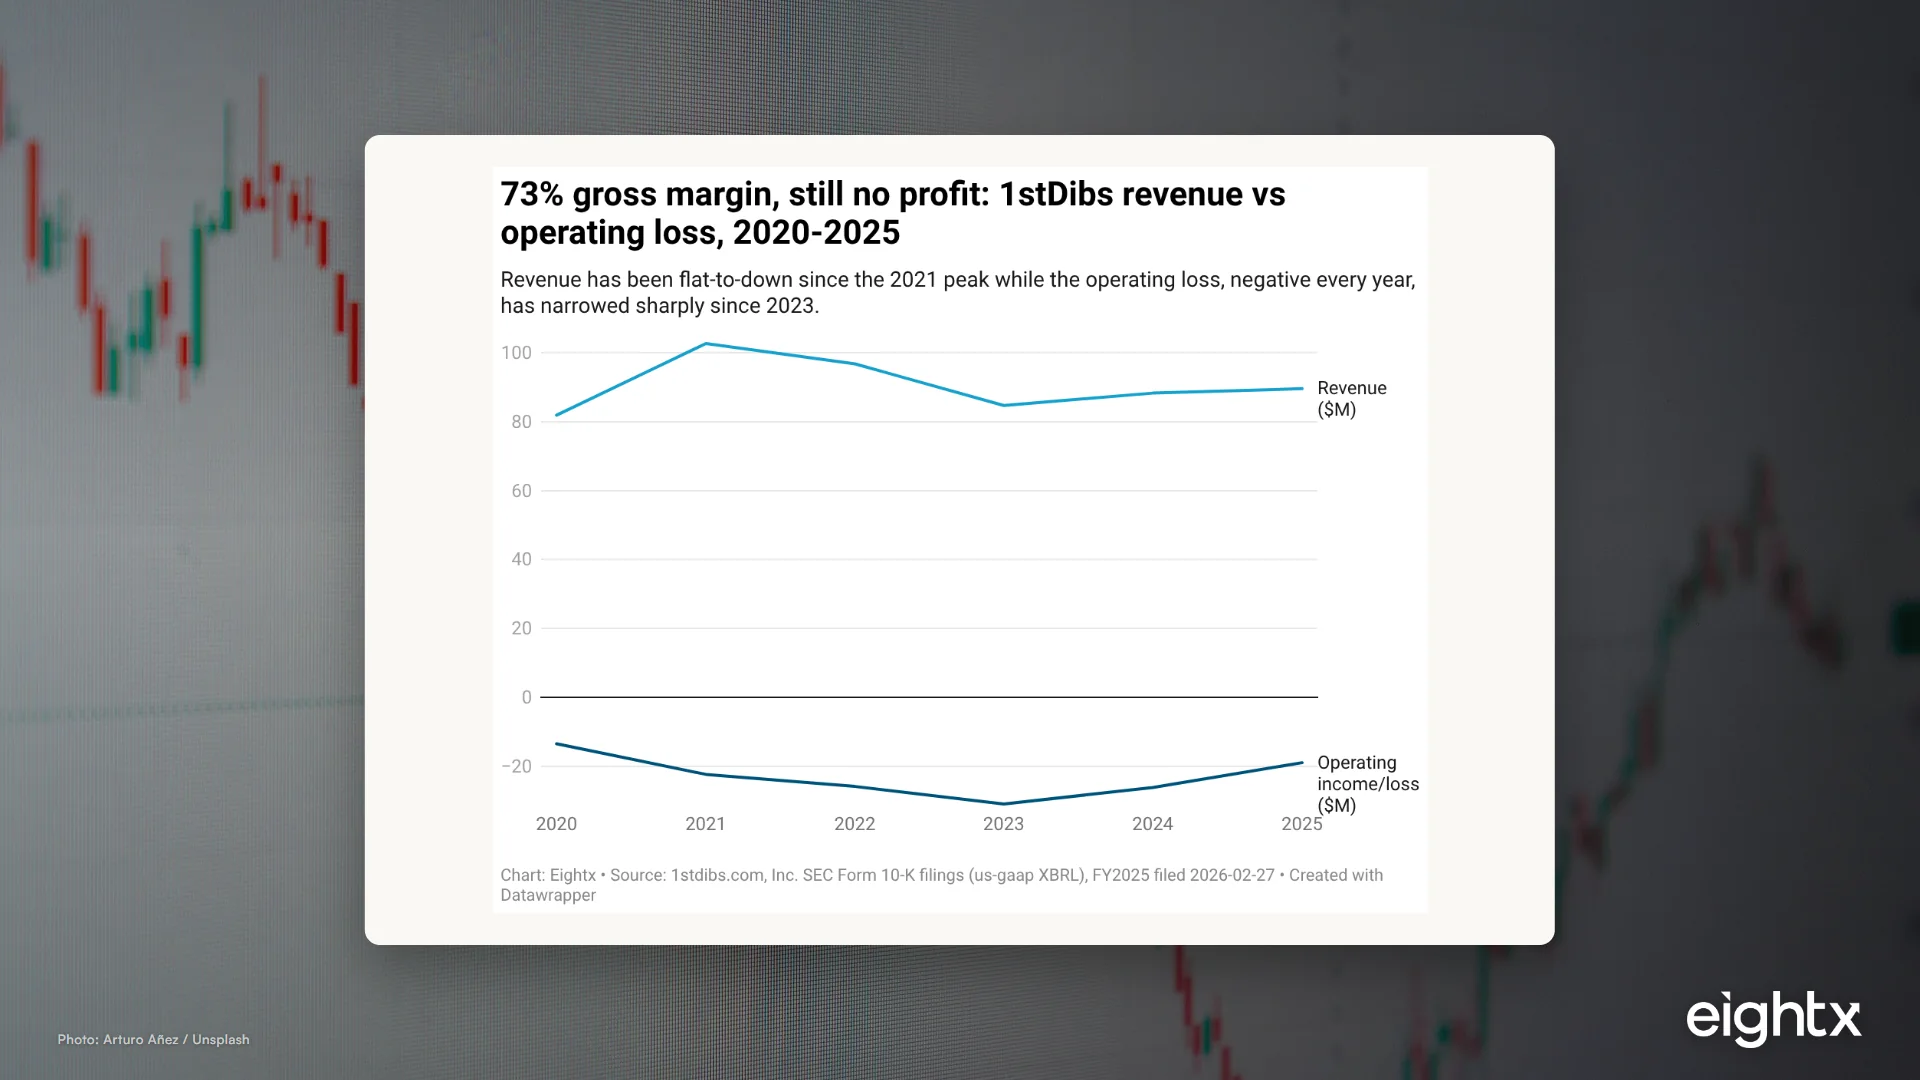
Then look at the operating line: losses of -$13.5M (2020), -$22.4M (2021), -$25.9M (2022), -$31.0M (2023), -$26.2M (2024) and -$19.0M (2025). Six years, six losses. The one piece of good news is that the loss is finally narrowing. It has shrunk by roughly 40% since the 2023 trough.
When I talk to founders running a brand at this revenue level, the thing they keep getting wrong is treating a high gross margin as proof the business works. It is not. Gross margin tells you the unit is healthy. It tells you nothing about whether you can acquire the customer for less than the margin they generate. 1stDibs is the clean public example: a near-perfect gross margin sitting on top of an operating model that has never paid for itself.
The other half of the picture is the top line. Revenue peaked at $102.7M in 2021, fell to $84.7M by 2023, and has clawed back to only $89.6M in 2025. Four years after the peak, revenue is still down. So the profitability story cannot be a growth story. Whatever fixes the loss has to come from the cost side.
Follow the money: where 73 points of gross margin disappear
Here is the part that matters for any operator. In a marketplace, your "COGS" is tiny. Your real cost of goods sold is customer acquisition, and it lives below the gross-profit line in the operating expense stack. For 1stDibs in FY2025 that stack is three big buckets, all expressed as a share of revenue.
Sales and marketing alone is 34.7% of revenue. General and administrative is 30.0%. Technology development (the R&D line, which is really product and engineering) is 26.1%. Add those three and you are at roughly 91 points of revenue spent on operating costs, against 73 points of gross profit. That is the entire reason a 73% gross margin produces a 21% operating loss margin. The opex base is bigger than the gross profit it has to fit inside.
| Metric | 2020 | 2021 | 2022 | 2023 | 2024 | 2025 |
|---|---|---|---|---|---|---|
| Revenue | 81.9 | 102.7 | 96.8 | 84.7 | 88.3 | 89.6 |
| Gross profit | 55.9 | 70.6 | 67.2 | 59.6 | 63.4 | 65.4 |
| Gross margin (%) | 68.3 | 68.7 | 69.4 | 70.3 | 71.9 | 73.0 |
| Sales & marketing | – | 47.4 | 44.8 | 36.6 | 38.1 | 31.1 |
| Technology development (R&D) | 16.5 | 19.1 | 24.4 | 21.6 | 21.2 | 23.4 |
| General & administrative | – | 21.3 | 27.6 | 28.6 | 27.4 | 26.9 |
| Operating income/loss | -13.5 | -22.4 | -25.9 | -31.0 | -26.2 | -19.0 |
| Net income/loss | -12.5 | -21.0 | -22.5 | -22.7 | -18.6 | -13.7 |
Notice that gross margin has actually improved every single year, from 68.3% in 2020 to 73.0% in 2025. The unit got better the whole time. The business still lost money the whole time. That is the trap a strong gross margin sets: it tells you to keep spending, because each customer looks profitable, right up until the acquisition bill arrives.
See your real margin on every order.
Get our Contribution Margin calculator: COGS, shipping, fees, ads, what's left.
Check your inbox. We'll send the Contribution Margin calculator shortly.
The marketing line is the whole story
If you only track one number in this teardown, track marketing intensity. For years 1stDibs spent 43 to 46% of revenue on sales and marketing: $47.4M in 2021, $44.8M in 2022. Then management took the knife to it. By FY2025 sales and marketing was $31.1M, or 34.7% of revenue, the first time it has been below 35%. That single $7.0M year-over-year cut from 2024 drove most of the operating-loss improvement.
This is the move I see again and again with operators who hit a wall on growth. When the top line stops responding to ad spend, the highest-return decision is almost always to cut the spend, not to push harder. The pattern is brutal but consistent: a brand pushing 45% of revenue into acquisition pulls it back toward 30 to 35%, watches revenue barely move, and discovers most of that spend was buying customers it would have gotten anyway or customers who never paid back. 1stDibs cut a third of its absolute marketing budget since 2021 and revenue is essentially flat. That tells you those marketing dollars were not generating much incremental revenue at the margin.
The honest CFO question is whether 34.7% is the floor or just this year's number. Management calls the 2025 cost base "structurally leaner." A buyer would want to see whether 2026 marketing holds near 35% or creeps back toward 40% the moment they chase buyer growth again. Marketing intensity is the single line where this company's path to profitability is won or lost.
Buyers are shrinking, so where's the growth coming from?
Here is the uncomfortable part. Revenue is flat-to-up, but the customer base is shrinking. Active buyers were roughly 61,000 exiting Q4 2025, down about 5% year over year. Q4 GMV (the total value of goods sold through the platform) was $90.2M, also down about 5%. So fewer buyers, less merchandise value, and yet revenue still edged up 1.5%.
The math only works one way: 1stDibs is earning more per transaction. Take rate (the share of GMV the company keeps as revenue) ran 24 to 25% in 2025 and is guided to 25 to 26% for 2026. So the revenue line is being held up by a rising take rate against a declining base, not by attracting new buyers. When I look at a flat-top-line business with declining buyers, that is the flag I care about most, because take-rate increases have a ceiling. Push the rate too far and sellers leave, which shrinks selection, which shrinks buyers further. You can lean on take rate for a while. You cannot lean on it forever.
For an operator, the lesson translates directly. If your revenue is holding while your customer count falls, you are not stable, you are coasting on price or order value. That can look fine for several quarters and then unwind quickly. The durable version of this business reaccelerates buyers. The fragile version keeps squeezing the buyers it has left.
The cash and capital story: burn solved, buybacks started
The good news in the 10-K is that the cash emergency is over. Operating cash flow was -$2.4M in FY2025 against -$27.9M back in 2022. Capex is tiny at $0.8M, so free cash flow was about -$3.2M, basically breakeven. The company is no longer setting money on fire.
| Metric | 2021 | 2022 | 2023 | 2024 | 2025 |
|---|---|---|---|---|---|
| Cash & equivalents | 168.2 | 153.2 | 37.4 | 26.0 | 22.9 |
| Operating cash flow | -4.4 | -27.9 | -13.6 | -2.9 | -2.4 |
| Capex | 0.1 | 0.1 | 1.8 | 1.9 | 0.8 |
| Share repurchases | 0.0 | 0.0 | 3.4 | 27.7 | 3.4 |
| Shares outstanding (M) | 38.0 | 39.3 | 39.9 | – | 35.8 |
The headline cash balance of $22.9M looks thin, but it is misleading. The 2023 "drop" from $153M to $37M was largely a reclassification into short-term investments, not money spent. Counting those, total liquidity was about $95M at year-end 2025. This is not a company about to run out of runway.
What it is doing with that cash is interesting. 1stDibs repurchased $27.7M of stock in 2024 and another $3.4M in 2025, roughly $31M across two years, cutting shares outstanding from about 39.9M to 35.8M. A board buying back its own stock while still posting losses is sending a specific signal: it thinks the stock is cheaper than the growth options it could otherwise fund. That is a defensible call when your own marketing spend has stopped generating incremental revenue. It is also, read less charitably, an admission that the company has run short of high-return places to put a dollar.
What a buyer would diligence next
If I were diligencing this for an acquirer or a board, four open questions decide the verdict. First, is the leaner 2025 cost base structural or cyclical? Management says structural. The proof is whether 2026 marketing stays near 35% rather than drifting back up. Second, can take-rate increases (24 to 25% rising to a guided 25 to 26%) offset the buyer decline without driving sellers off the platform? Third, what does the real runway math look like, given near-breakeven free cash flow and about $95M of total liquidity? The cash problem is genuinely solved; the growth problem is not. Fourth, is there any credible plan to reaccelerate active buyers, or is the entire model now a slow harvest of a shrinking, high-value base?
The teardown verdict is clean. The cash burn is fixed, the unit economics are excellent, and the cost discipline is real. What is missing is a top line that grows. A 73% gross margin business that cannot grow revenue is not a broken business. It is a business whose profitability has to come from the cost base and the take rate, exactly the levers 1stDibs has already pulled. If those levers have more room, it gets to breakeven. If they are tapped out, it stays a very efficient company that quietly shrinks.
The whole 1stDibs teardown fits in one sentence: a 73% gross margin cannot save you if your real cost of goods is customer acquisition and you cannot grow buyers. The company fixed the cash burn by cutting a third of its marketing budget, and revenue barely moved, which tells you most of that spend was never paying back. The path forward is cost discipline and take rate, not scale.
For more public-company teardowns in the same vein, see our Etsy marketplace teardown and our Allbirds DTC teardown. If you want this read run on your own numbers, here is how our fractional CFO services work.
Sources and methodology
The primary source for this teardown is SEC EDGAR, 1stdibs.com, Inc., CIK 0001600641 (ticker DIBS, Nasdaq), pulled via the sec-edgar tooling. Annual financial statements across six periods supplied revenue, gross profit, operating income, net income, operating expenses, R&D, balance sheet and cash flow line items, and shares outstanding. The FY2025 10-K was filed 2026-02-27 under accession 0001600641-26-000007.
Individual line items were confirmed against dedicated us-gaap XBRL series rather than the consolidated extract, because a few balance-sheet rows carried filing-year alignment quirks. Sales and marketing expense was $47.4M (2021), $44.8M (2022), $36.6M (2023), $38.1M (2024) and $31.1M (2025). General and administrative expense ran $21.3M to $28.6M across the period and was $26.9M in 2025. Cash and equivalents closed FY2025 at $22.9M. Marketing and G&A percentages of revenue are computed (line item divided by revenue). Gross margin of 73.0% was computed as gross profit divided by revenue and cross-checks to the valuation-metric figure of 73.02%.
Operating metrics that are not GAAP line items (GMV, active buyers, take rate, adjusted EBITDA) come from the FY2025 results press release and the Q4 2025 earnings call, and use the company's own definitions. Q4 2025 GMV was $90.2M, active buyers were roughly 61,000 (down about 5% year over year), take rate was 24 to 25% (guided 25 to 26% for 2026), and adjusted EBITDA was -$2.4M, or a -2.7% margin. Full-year GMV is not disclosed in the press release; only the Q4 figure is published.
One discrepancy is worth flagging. The press release frames FY2025 sales and marketing as about $36.5M, or 41% of revenue, which is larger than the audited 10-K us-gaap line of $31.1M (34.7%). We lead with the audited 10-K XBRL figure as the primary number throughout, and treat the press-release framing as a secondary, broader definition that likely bundles additional acquisition-related cost.
Two intended sources were not usable this run. Storeleads channel and tech-stack context is unavailable because 1stDibs runs a custom platform that is paywalled in the tool, and the name lookup returns an unrelated copycat store rather than the real marketplace, so no Storeleads data is cited here. The operator-voice corpus was rate-limited during research, so the operator observations in this piece are written from our own pattern experience with marketplace and DTC operators at this revenue scale rather than lifted from specific call transcripts. All dollar figures remain sourced to the audited 10-K and the company's FY2025 disclosures.
Frequently asked questions
is 1stdibs a profitable company?
No. 1stDibs has posted an operating loss every year for at least the last six, including a $19.0M loss in FY2025. The losses are narrowing fast, and adjusted EBITDA is close to breakeven at -$2.4M, but on a GAAP basis the company still loses money.
what was 1stdibs revenue in 2025?
FY2025 revenue was $89.6M, up about 1.5% year over year. That is still below the 2021 peak of $102.7M, so the top line has effectively gone sideways-to-down for four years.
why does 1stdibs lose money if its gross margin is 73%?
Because in a marketplace your real cost of goods is customer acquisition, not product. Marketing ran 43 to 46% of revenue for years, and even after cuts it is 34.7%. Add G&A and product engineering and the operating expense base is larger than the 73 points of gross profit.
how much does 1stdibs spend on marketing as a percentage of revenue?
In FY2025, sales and marketing was $31.1M, or 34.7% of revenue, down from 43 to 46% in prior years. The press release frames it higher (around $36.5M, 41%); we use the audited 10-K XBRL figure as the primary number.
is 1stdibs growing or shrinking?
Revenue is roughly flat (+1.5%) but active buyers are shrinking, down about 5% to roughly 61,000 exiting Q4 2025. The company is holding revenue with a rising take rate and order value, not with buyer growth.
does 1stdibs have a path to profitability?
Through cost cuts, mostly. Free cash flow is near breakeven (-$3.2M in FY2025) and the operating loss has nearly halved since 2023. But with a flat top line, the remaining gap has to close by holding the leaner cost base and lifting take rate, not by scaling revenue.
why is 1stdibs buying back stock if it is losing money?
1stDibs repurchased $27.7M of stock in 2024 and $3.4M in 2025, cutting shares outstanding from about 39.9M to 35.8M. With roughly $95M of total liquidity and few high-return growth options, the board is effectively returning capital instead of spending it on acquisition it no longer trusts to pay back.