
Insights
Beyond (Overstock) financials: a DTC teardown
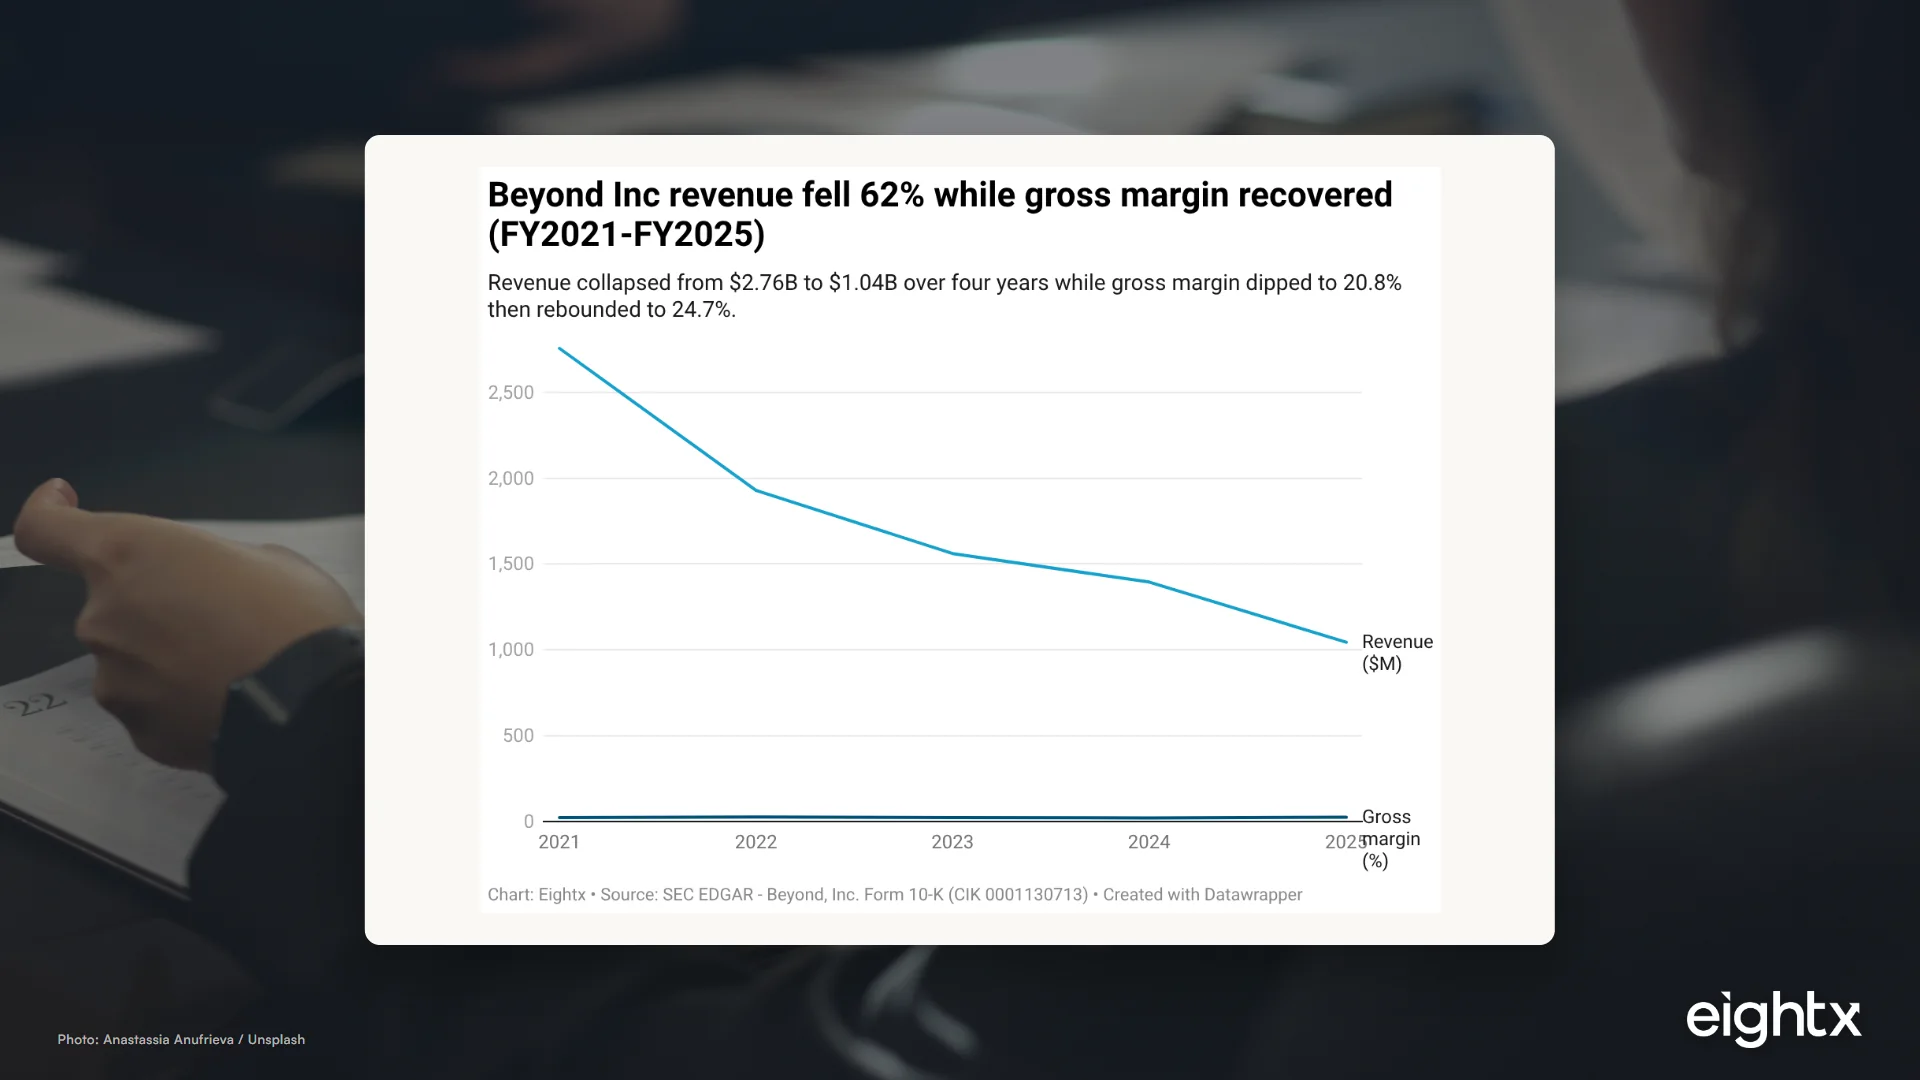
Beyond Inc (BYON), the former Overstock, cut revenue 62% from $2.76B to $1.04B over four years while pulling gross margin back to 24.7% by slashing marketing spend 40%. The margin recovery is real, but the company still burns operating cash and funded the gap by diluting shareholders about 50%.
Key Takeaways
- Beyond's revenue fell 62% in four years, from $2.76B (FY2021) to $1.04B (FY2025), including a 25% drop in FY2025 alone. The shrink is the whole story. Every margin gain sits on top of a contracting top line.
- Gross margin bottomed at 20.8% (FY2024) and rebounded to 24.7% (FY2025), a 385 basis point swing driven by less discounting and SKU pruning, not by more volume.
- Sales and marketing spend was cut 40% year-over-year, from $238.6M (17.1% of revenue) to $143.4M (13.7%). That single lever flipped the model from buying unprofitable traffic to defending margin.
- The company still burns cash. Operating cash flow was -$56.7M in FY2025 and the operating loss was -$61.2M. Beyond ended FY2025 with $175.3M of cash and equivalents, but plugged the operating gap by issuing equity, diluting share count from about 45M to 69M.
- The model is now asset-light: just $11.5M of inventory against $402M total assets, a licensed Bed Bath & Beyond name, and a dropship and marketplace book. Almost no inventory risk, but no profit cushion yet either.
Beyond, Inc. (NYSE: BYON) is the company that used to be Overstock.com and now sells under the Bed Bath & Beyond name it bought out of bankruptcy. Read its filings the way a CFO would diligence an acquisition target, and they tell one of the cleanest operator stories in public retail: revenue collapsed from $2.76 billion in FY2021 to $1.04 billion in FY2025, a 62% peak-to-trough fall, and yet over that same stretch the business deliberately stopped chasing unprofitable volume and pulled its gross margin back up. This is a teardown of what the 10-K and 10-Q actually reveal, and what a private DTC (direct-to-consumer) brand should copy and what it should not.
The shrink is the story: $2.76B to $1.04B in four years
Before you admire a single margin point, sit with the top line. Beyond's revenue did not soften. It fell off a cliff. $2,756M in FY2021, $1,929M in FY2022, $1,561M in FY2023, $1,395M in FY2024, and $1,045M in FY2025. That last year alone was a 25% decline. Over four years the company shed nearly two-thirds of its revenue.
Most of that was a choice, not just a market. After the pandemic-era surge in home goods unwound, management stopped spending to defend a top line that was not paying its way. The interesting part of the teardown is what happened to margin while revenue was halving and halving again: gross margin dipped to a low of 20.8% in FY2024, then snapped back to 24.7% in FY2025. That recovery is real, though it is worth noting 24.7% is still shy of the 26.3% the company posted in FY2022, so this is a rebound off the trough, not a new high.
When I talk to founders running a brand this size, the instinct is almost always the opposite of what Beyond did. Revenue dips, and the reflex is to spend harder to "buy back" the line. The pattern we see again and again is a brand that protects a vanity revenue number at the cost of its margin, then wonders why the cash keeps draining. Beyond did the unglamorous thing: it let the top line fall to a profitable core. The lesson for an operator is not "shrink your business." It is that a smaller, profitable revenue base beats a larger, loss-making one, and the filings prove the trade is survivable.
How the margin came back: cutting marketing, not adding volume
The single clearest lever in these filings is sales and marketing spend. In FY2024, Beyond spent $238.6M on sales and marketing, which was 17.1% of revenue. In FY2025 it spent $143.4M, or 13.7% of revenue. That is a 40% dollar cut year-over-year, and it is the move that flipped the model.
That cut is why the operating loss narrowed sharply, from -$184.1M in FY2024 to -$61.2M in FY2025, a $123M improvement at the operating line. The company did not engineer a margin recovery by getting better at fulfillment or negotiating cheaper goods. It got there by no longer paying to acquire orders that lost money.
| Fiscal year | Revenue ($M) | Gross profit ($M) | Gross margin | Operating income ($M) |
|---|---|---|---|---|
| 2021 | 2,756.4 | 623.9 | 22.6% | 111.1 |
| 2022 | 1,929.3 | 507.6 | 26.3% | 27.0 |
| 2023 | 1,561.1 | 366.0 | 23.4% | -144.0 |
| 2024 | 1,395.0 | 290.2 | 20.8% | -184.1 |
| 2025 | 1,044.6 | 257.5 | 24.7% | -61.2 |
For an operator, the takeaway is a benchmark you can use this week. If your blended sales and marketing spend is sitting north of 17% of revenue and you are not profitable, you are in the zone Beyond was in before its reset. The fix is rarely a clever new channel. It is cutting the spend that does not return contribution margin and being willing to let the top line shrink while you do it. For where a 24.7% gross margin sits against the rest of the category, our home goods financial benchmark lays out the public-company ranges.
How much more can you spend on ads and stay profitable?
Get our Ad Spend Scaler: a new ROAS target plus an email for your agency.
Check your inbox. We'll send the Ad Spend Scaler shortly.
Reading the cash flow like a CFO
Margin recovery is the good news. The cash flow statement is where the diligence gets honest, and it is the part a founder reading only the press release would miss.
Beyond burned $56.7M of operating cash in FY2025. That was an improvement on the brutal -$174.3M of FY2024, but it is still cash going out the door, not coming in. Free cash flow was -$64.1M. The company ended FY2025 with $175.3M of cash and equivalents, which sounds comfortable until you ask how it got there.
It got there by issuing stock. Financing cash flow was a positive $122.1M in FY2025, almost entirely equity. Diluted share count rose from roughly 45M in FY2023 to about 69M by Q1 FY2026, adding more than 20 million shares in two years. So the cash cushion on the balance sheet is real, but existing shareholders paid for it by owning a smaller slice of the company.
This is the diligence red flag, and it is the thing we push hardest on when we sit with founders looking at their own numbers. When we have struggled with this on the operator side, the trap is reading a healthy cash balance as a healthy business. They are not the same. A brand can show $175M in the bank and still be losing money on operations and funding the gap with dilutive raises. The question that matters is not "how much cash do you have," it is "is the business generating it or buying it." Beyond is still buying it.
The asset-light pivot: a licensed name and almost no inventory
Here is the structural change that makes the rest possible. Beyond is now an asset-light, inventory-light business. At FY2025 it carried just $11.5M of inventory and $6.2M of goodwill against $402M of total assets. For a company that does over $1B in revenue, holding $11.5M of inventory is almost nothing.
That is by design. The legacy Overstock model was a marketplace and dropship book, where the supplier holds the stock and Beyond takes a cut on the sale. Layered on top is the Bed Bath & Beyond brand, which Beyond bought out of bankruptcy and now licenses as a consumer-facing name, plus partner investments like Kirkland's. The company carries the brand and the demand engine, not the warehouse.
The balance sheet reflects it: a current ratio of 1.01, debt-to-equity of 0.23, total debt of $15.5M, and stockholders' equity of $162.7M. This is a thin balance sheet, but it is not a levered one. The watch item is liquidity, not solvency. There is no debt wall to refinance, only an operating loss to close before the cash runs low.
When I talk to founders this size, the asset-light envy is strong. Almost everyone wants the version of their business with no inventory risk. What the Beyond teardown shows is the catch: going asset-light removes the markdown and obsolescence drag, but it does nothing on its own to make you profitable. You still have to earn a margin on every order. Beyond removed the inventory risk and is still losing money at the operating line. Asset-light is a risk choice, not a profit cure.
Is the Q1 2026 inflection real?
In Q1 FY2026 (the quarter ended March 2026), Beyond reported revenue of $247.8M and what management called its "first significant revenue growth in 19 quarters." Net loss narrowed to -$16.4M, a roughly $24M year-over-year improvement, and adjusted EBITDA loss came in around $8M. Average order value was $205 and the company delivered about 1.2 million orders.
| Metric | Q1 FY2026 |
|---|---|
| Net revenue | $247.8M |
| Gross profit | $59.2M |
| Gross margin | 23.9% |
| Net loss | -$16.4M |
| Adjusted EBITDA | -$8M |
| Average order value | $205 |
| Orders delivered | 1.2M |
| LTM net revenue per active customer | $268 |
So is it real? The honest answer is that it is a genuine inflection on a small base, and one quarter does not make a trend. Growing again at all matters, because it suggests the company found a floor and the new cost structure can support growth rather than just defend margin. But the revenue base it is growing from is a fraction of what it was, the business still loses money, and adjusted EBITDA conveniently strips out real costs.
The durability test is specific and you can watch it yourself in the next two filings: does revenue keep growing while sales and marketing stays near 13-14% of revenue, and does the operating loss keep closing? If growth only resumes because spend creeps back up, the inflection was bought, not earned.
What a $30M ecom brand should take from this teardown
You are not running a $1B public marketplace, but the financial lessons transfer almost directly to a $30M DTC brand.
First, profitable shrink beats unprofitable growth. Beyond cut its way to a 385 basis point margin recovery in a single year. If your contribution margin is bleeding, cutting the worst-performing revenue is not failure, it is repair. The top line is allowed to go down.
Second, benchmark your own marketing efficiency against 13-14% of revenue. That is roughly where Beyond landed when it got serious. If you are spending 20% or more of revenue to acquire orders and you are not profitable, that is the first number to attack, before any new channel.
Third, never read your cash balance as your scoreboard. The Beyond filings are a clean reminder that a company can hold $175M and still be funding itself with dilution. For a private brand the equivalent is raising or drawing on a line to cover an operating gap and calling it growth capital. The question is always whether the business generates cash or buys it.
Beyond's teardown is the single most important DTC lesson written in public filings: shrinking to a profitable core beats growing into a loss. The company cut revenue 62%, cut marketing 40%, and bought its gross margin back 385 basis points. It is still not profitable, and it funded the gap by diluting shareholders 50%. Margin recovery is real. The cash story is not finished. Both are true at once, and an operator has to hold both.
Sources and methodology
The primary source for this teardown is SEC EDGAR, Beyond, Inc., CIK 0001130713. The filing entity is still listed as "Bed Bath & Beyond, Inc." under ticker BYON, SIC 5961 (Retail-Catalog and Mail-Order). Figures were taken from the as-filed consolidated statements of operations, balance sheets, and cash-flow statements in the company's annual and quarterly reports, with selling-and-marketing and general-and-administrative expense read from the reported expense lines.
Key accession numbers: the FY2025 10-K is 0001130713-26-000018 (filed 2026-02-24); the FY2024 10-K is 0001130713-25-000024 (filed 2025-02-25); the FY2023 10-K is 0001130713-24-000013 (filed 2024-02-23); and the Q1 FY2026 10-Q is 0001130713-26-000038 (filed 2026-04-27). The annual revenue series in millions is FY2021 2,756.4, FY2022 1,929.3, FY2023 1,561.1, FY2024 1,395.0, FY2025 1,044.6, with FY2025 growth of -25.1% per the valuation metrics.
Gross margin was computed as gross profit divided by revenue from as-filed line items, because cost of revenue is reported separately. The FY2025 figure is 24.65%. The operating-expense split shown in the chart uses the reported sales and marketing and general and administrative lines, with "technology" derived as total operating expenses minus those two lines divided by revenue, because Beyond reports a custom technology line rather than a standard XBRL tag. For FY2025, total opex of $318.7M minus S&M of $143.4M minus G&A of $53.6M leaves roughly $121.8M of technology, about 11.7% of revenue. Operators reconciling exact figures should treat the technology line as a residual.
Cash-flow figures (operating cash flow, capex, financing cash flow) and share counts were taken from the 10-K cash-flow statement and cover page. Free cash flow is operating cash flow minus capex. Year-end cash is reported here as cash and equivalents of $175.3M at December 31, 2025 ($202.2M including restricted cash); the $159.2M figure that appears in summary pulls is the FY2024 year-end balance, which is also FY2025's opening cash, and the FY2025 net change reconciles it: $159.2M opening plus operating -$56.7M, investing -$49.2M, and financing +$122.1M lands at the $175.3M close. Income-statement and cash-flow items labeled FY2025 are for the period ending December 31, 2025; the balance-sheet snapshot figures (inventory, goodwill, total assets, equity) are the most recent as-filed year-end values and are labeled to the same fiscal year for consistency. The income-statement table omits per-year net loss and EPS because the FY2024 and FY2025 net-loss values returned an identical figure in the structured pull, which looks like a fiscal-year label collision in the data tags. Rather than publish a number we could not cleanly reconcile across both as-filed statements, we show revenue, gross profit, gross margin, and operating income, which are unambiguous in the filings.
A triangulation layer confirmed the strategic context. Public reporting verified the Bed Bath & Beyond brand relaunch and the corporate rename from Overstock, the Kirkland's investment and IP acquisition, the store-conversion plan, and the asset-light positioning. Operating metrics for Q1 FY2026, including the "first significant revenue growth in 19 quarters," the $205 average order value, the roughly 1.2 million orders, and the LTM net revenue per active customer of $268, were drawn from Beyond's Q1 2026 investor press release and reconciled against the 10-Q. Adjusted EBITDA is a non-GAAP measure Beyond reports in its releases, not an XBRL line, and is presented here as the company reports it. Store-level traffic and technology proxies were not available because Beyond runs a custom, non-Shopify stack that channel-intelligence tools could not resolve, so all channel context here comes from the filings and public coverage rather than a store crawl.
Frequently asked questions
is beyond inc's q1 2026 revenue growth durable or just a one-quarter bounce?
It is one quarter of growth off a much lower base, and management itself called it the first significant revenue growth in 19 quarters. That is a real inflection, but one print does not make a trend. Watch whether Q2 and Q3 hold growth without re-inflating marketing spend.
how much of beyond's gross margin improvement came from pruning skus vs real unit economics?
Most of it came from pruning and from cutting promotional discounting, not from a structural unit-cost win. Gross margin moved from 20.8% to 24.7% in the same year revenue fell 25%, so the company recovered margin by selling less of the worst stuff, not by getting cheaper to operate per order.
is beyond's sales and marketing spend at 13-14% of revenue efficient enough to grow?
13.7% of revenue is a defensible number for a retailer, and it is far healthier than the 17.1% it hit in FY2024. The open question is whether 13-14% can also fund growth. Holding margin while shrinking is easy. Holding it while growing is the test.
can beyond scale revenue without re-inflating its technology and g&a cost base?
That is the whole bet. Technology ran around 11.7% of revenue and G&A around 5.1% in FY2025. If revenue grows and those lines stay flat in dollars, operating profit improves fast. If they scale with revenue, the path to profit stretches back out.
what does beyond's adjusted ebitda trajectory tell operators about its path to profitability?
Adjusted EBITDA loss narrowed to about $8M in Q1 FY2026 from deeper losses a year earlier, so the trend is the right direction. But adjusted EBITDA strips out real costs like stock-based comp, and the company is still burning operating cash. Treat it as a progress signal, not a profit claim.
why did overstock change its name to bed bath & beyond?
Overstock bought the Bed Bath & Beyond brand and intellectual property out of bankruptcy, decided the legacy name carried more consumer recognition than Overstock did, and rebranded the corporate parent to Beyond, Inc. with Bed Bath & Beyond as the consumer-facing banner. It is a licensed-brand play layered on top of the original marketplace.
how much did beyond dilute shareholders to fund its losses?
A lot. Diluted share count rose from roughly 45M to about 69M between FY2023 and Q1 FY2026, roughly a 50% increase. Financing cash flow was a positive $122.1M in FY2025, almost entirely from issuing equity to cover the operating-cash burn.
is beyond inc's asset-light model actually working?
On the balance sheet, yes. Carrying just $11.5M of inventory against $402M of total assets means almost no markdown or obsolescence risk. On the income statement, not yet. Asset-light removed the inventory drag but the company is still losing money at the operating line.
For more public-company teardowns in this format, see our Allbirds financial teardown, and if you want a CFO to run this same diligence on your own numbers, start with our interim CFO services.