
Financial Strategy
FIGS (FIGS) Teardown: Scrubs, Margins, Bear Case
FIGS (NYSE: FIGS) is the dominant DTC medical scrubs brand with $631M in FY2025 revenue, a 66.5% gross margin - still roughly 10 points above DTC apparel peers - and 2.92M active customers. The one story the revenue growth obscures: that gross margin has fallen every single year since the 2021 IPO, Adjusted EBITDA margin has been roughly halved, and nearly all production sits in Vietnam and Jordan - both inside the April 2025 US tariff regime.
Key Takeaways
- Gross margin has declined every year since the IPO: From 72.3% in FY2020 to 66.5% in FY2025, a 580bps compression on revenue that grew 2.4x. FIGS has never posted a year-over-year gross margin improvement since going public. Source: FIGS 10-K FY2025, EDGAR CIK 0001846576.
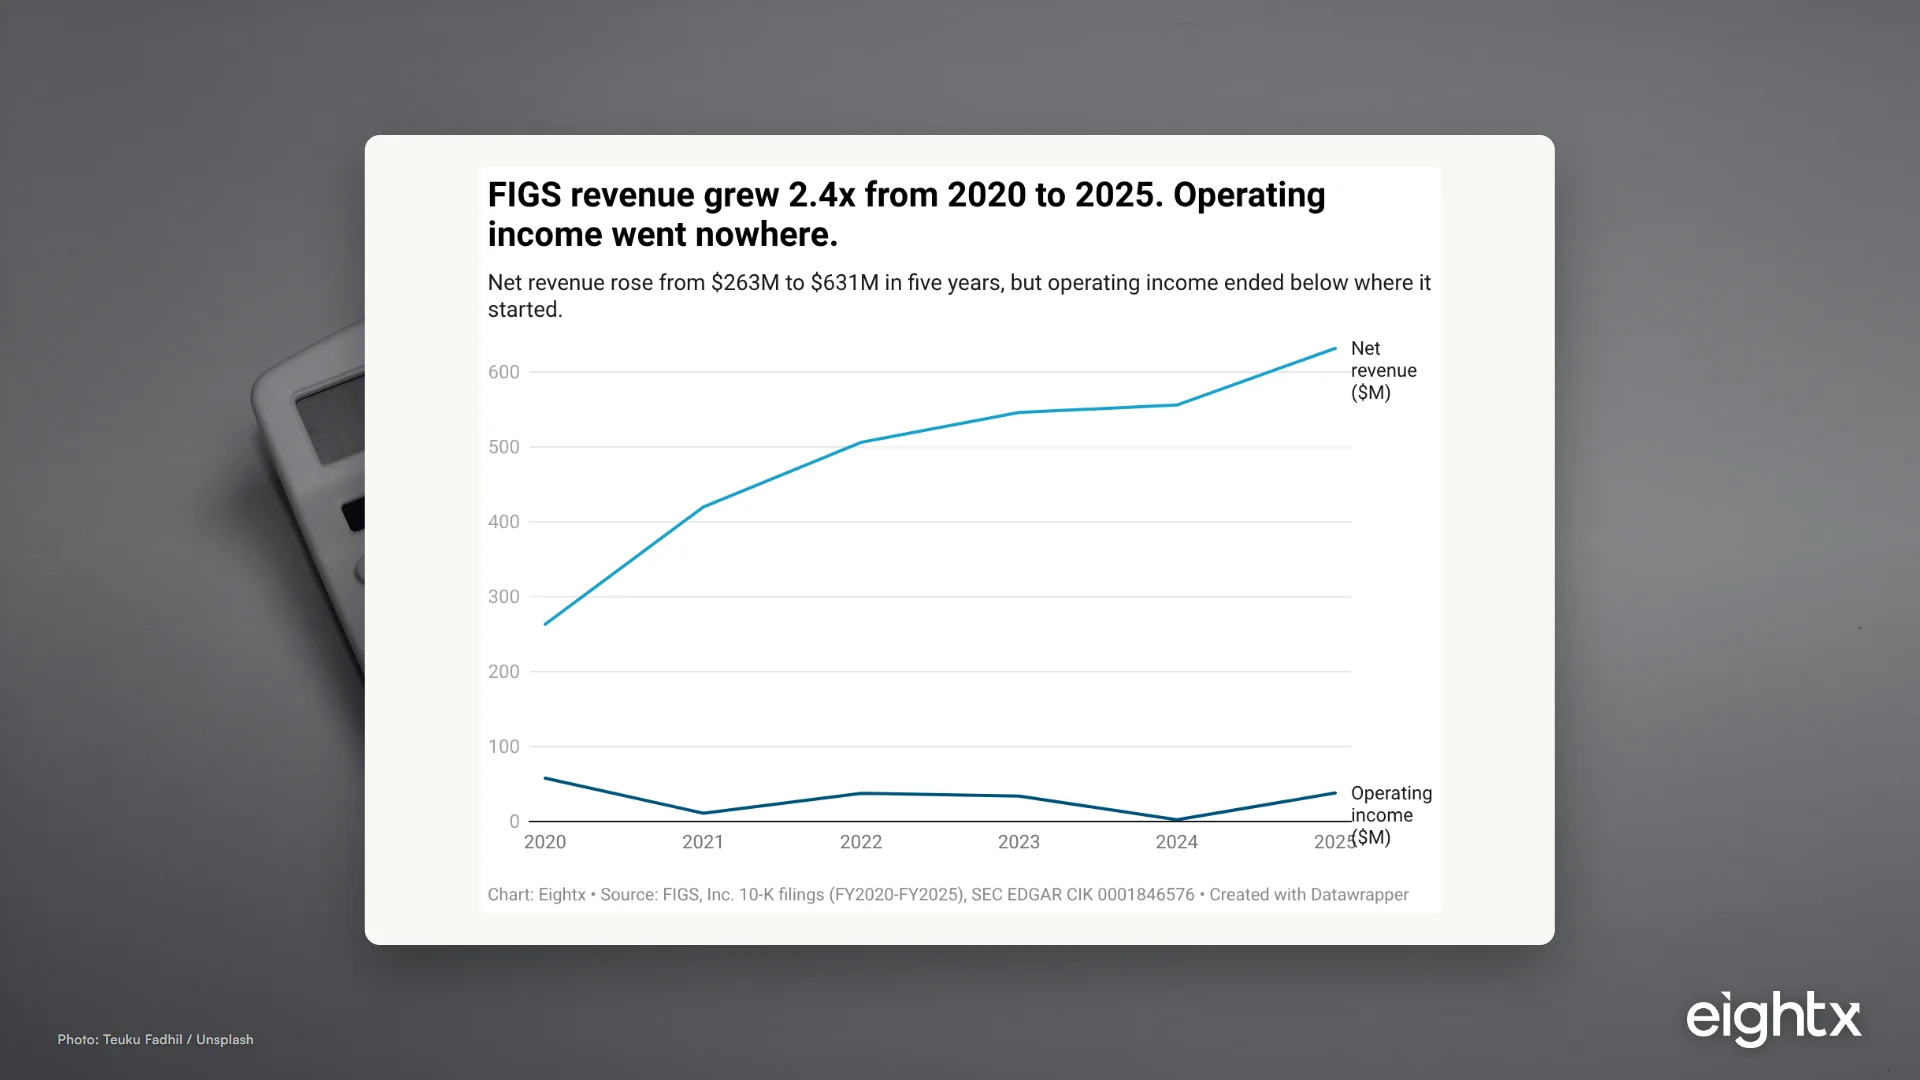
- Adjusted EBITDA margin has been roughly halved since FY2021: From 25.1% ($105.2M) in FY2021 to 11.8% ($74.5M) in FY2025 on 50% more revenue. Operating income in FY2025 ($38.1M) is lower than FY2020 ($57.9M) even as revenue 2.4x'd. Source: FIGS 10-K FY2025.
- The tariff risk is the sharpest new structural threat: Vietnam and Jordan account for 'nearly all of our production of finished goods' per the FY2025 10-K. The April 2025 US tariff regime hit both countries directly; a February 2026 Supreme Court IEEPA ruling provided partial relief but trade policy remains fluid. Source: FIGS 10-K FY2025, MD&A / Recent Developments.
- FY2025 was a recovery year - but with a catch: Revenue rebounded to $631.1M (+13.6%), active customers hit 2.92M (+9.4%), and AOV rose to $120. The catch: gross margin still fell another 110bps, OCF declined despite better EBITDA, and the Jordan supplier transition is ongoing. Source: FIGS 10-K FY2025.
- The balance sheet is the one unambiguously clean line: No funded debt, approximately $82M cash at FY2025 year-end, and $53M free cash flow. FIGS also maintains an undrawn $100M revolving credit facility (Bank of America, 2021 Facility, maturing September 2026) with zero outstanding borrowings as of FY2024 year-end. Source: FIGS 10-K FY2024 and FY2025 balance sheet; EDGAR XBRL.
$631 million of revenue in FY2025. A 66.5% gross margin in a category where most DTC apparel peers run in the high-50s. A brand so woven into healthcare-professional identity that nurse TikTok is essentially FIGS content half the time. Then you look at the five-year trend: gross margin has fallen every single year since the 2021 IPO, Adjusted EBITDA margin has been halved, and the factories making nearly every pair of scrubs sit in Vietnam and Jordan - both inside the April 2025 US tariff regime.
This is the teardown of that gap: the brand story is real; the margin trajectory is the question.
Section 1 - The snapshot
| Metric | FY2025 | Q1 FY2026 | Q1 FY2025 (prior year) |
|---|---|---|---|
| Revenue | $631.1M | $159.9M | $124.9M |
| Revenue YoY | +13.6% | +28.0% | n/a |
| Gross margin | 66.5% | 67.7% | 67.6% |
| Operating income (loss) | $38.1M (6.0%) | $4.5M (2.8%) | -$0.2M (-0.2%) |
| Net income (loss) | $34.3M | $6.3M | -$0.1M |
| Diluted EPS | $0.19 | $0.03 | $0.00 |
| Adjusted EBITDA | $74.5M (11.8%) | n/a | n/a |
| Operating cash flow | $61.2M | n/a | n/a |
| Inventory | $128.0M | $139.4M | n/a |
| Cash | $82.0M | n/a | n/a |
| Long-term debt | $0 | $0 | n/a |
The five-year arc:
| Fiscal year | Revenue | YoY growth | Gross margin | Adj EBITDA margin |
|---|---|---|---|---|
| FY2021 | $419.6M | +59.5% | 71.8% | 25.1% |
| FY2022 | $505.8M | +20.6% | 70.1% | 17.2% |
| FY2023 | $545.6M | +7.9% | 69.1% | 15.8% |
| FY2024 | $555.6M | +1.8% | 67.6% | 9.3% |
| FY2025 | $631.1M | +13.6% | 66.5% | 11.8% |
Section 2 - The business model: how they actually make money
FIGS describes itself as the first digitally native brand built specifically for healthcare professionals - and that is mostly accurate in structure. Revenue comes overwhelmingly through the direct-to-consumer website and mobile app, with three supplements: TEAMS (B2B institutional group orders), Community Hub physical retail stores (multiple US locations as of FY2025), and a more recently added Amazon channel for broader market access. There is essentially no traditional wholesale.
The core product is scrubwear. In Q1 FY2026, scrubwear generated $126.6M (79% of revenue), and non-scrubwear (outerwear, underscrubs, footwear, compression socks, lab coats, loungewear, accessories) generated $33.3M (21%). Non-scrubwear is growing faster (+31.3% in Q1 FY2026) but at a small absolute base. The FY2025 active customer base reached 2.921M, up 9.4% from 2.670M. Average order value was $120 in FY2025. Net revenue per active customer rose to $216 from $208 in FY2024 - the first per-customer increase in several years, signaling real but modest engagement recovery.
Where does the margin come from? FIGS prices premium scrubs in the $30-60 per piece range, positioning against legacy hospital supply-chain players (Cherokee, Barco, Careismatic) that sell at lower price points through institutional wholesale channels. The DTC structure removes the wholesale margin layer. The FIONx fabric technology (4-way stretch, anti-odor, moisture-wicking) provides product differentiation that supports the price premium. The brand positioning - scrubs as identity, not uniform - creates the repeat-purchase psychology that runs roughly 70%+ of revenue from returning customers per management commentary, though the exact percentage is not separately disclosed in filings.
Where the margin is going: sourcing costs. Finished goods are manufactured almost entirely in Vietnam and Jordan - efficient geography chosen for labor cost and, in Jordan's case, favorable US trade terms prior to 2025. Fabrics are sourced predominantly from China suppliers. Air freight costs compressed gross margin in FY2021-2022 during COVID supply chain disruptions. The FY2024 Red Sea crisis forced premium air routing for Jordan-sourced goods. The April 2025 US tariff regime then targeted both production countries simultaneously.
These videos are category and sentiment signals, not load-bearing financial facts.
@hailee_shelley @wearfigs I'm obsessed 👏🏼 #scrubs #figs #nurse #nursehai
♬ original sound - Hailee Rn
@hailee_shelley (Hailee Rn), 641K plays, 22K likes. The demand signal: organic nurse-community content tagging FIGS directly. Social signal only.
@gabby_rod09 @wearfigs keeps raising the bar with every color drop 🔥 #ootd #figsscrubs #doctor #figs #residency
♬ original sound - playgrndseries
@gabby_rod09 (ED by Dr. G), 149.9K plays, 16.8K likes. Resident physicians framing FIGS color drops as "raising the bar" - the brand identity mechanism, not just a product. Social signal only.
@pattygaffxoxo I am someone who is always willing to spend money if it's worth it. Inconsistent sizing is something that makes me lose trust in a brand so quick. I did keep the Rafaela top and wide leg pants but everything else got returned 😀 #figsscrubs #figs #sonography #pattygaffxoxo
♬ original sound - pattygaffxoxo
@pattygaffxoxo, 142.5K plays, 15.1K likes. The risk signal: a self-described price-tolerant buyer calling out sizing inconsistency as the trust-breaking variable. Social signal only.
Returns are quietly eating your margin. See by how much.
Get our Real Cost of Returns calculator: plug in your numbers, see the true hit per return.
Check your inbox. We'll send the Real Cost of Returns calculator shortly.
Section 3 - Strengths: the moat that is real
1. A gross margin still roughly 10 points above DTC apparel peers - earned, not accidental. 66.5% gross margin in FY2025 is structurally high for any apparel company, DTC or otherwise. The FY2021 10-K stated that FIGS removed the wholesale markup layer entirely: all revenue is transacted directly. The premium scrubwear price point ($30-60 per piece), the FIONx fabric differentiation, and the community-identity positioning together underwrite a margin profile that commodity competitors in the hospital supply chain cannot easily match. Even at the lower end of FIGS' five-year range, the absolute gross margin level is the strongest line in the model. Source: FIGS 10-K FY2021-FY2025.
2. A repeat-customer base with improving NRPAC and AOV - both recovering in FY2025. Net revenue per active customer rose to $216 in FY2025 (from $208 in FY2024), and AOV rose to $120 (from $113 in FY2024). These are the first per-customer improvements in several years. The FY2021 10-K described the model as "highly efficient due to the non-discretionary, replenishment nature of healthcare apparel" - that replenishment flywheel is the reason the majority of revenue comes from returning customers, even as new customer addition has slowed. With 2.921M active customers as of FY2025 year-end and a TAM estimated at ~20 million US healthcare workers (implied by the FY2021 10-K's 3.5% market share estimate), customer penetration still has room to grow. Source: FIGS 10-K FY2025 and FY2021.
3. No funded debt, $82M cash, $53M free cash flow, and an undrawn $100M revolver. No outstanding bank debt or bond obligations - EDGAR XBRL LongTermDebt returns null through FY2025. FIGS also maintains an undrawn $100M revolving credit facility (Bank of America, 2021 Facility, maturing September 2026) with $95.1M available as of FY2024 year-end, providing liquidity headroom without carrying funded debt. Cash declined from $195M (FY2021 year-end) to $82M (FY2025 year-end) driven by inventory builds, fulfillment capex, and $45.5M in FY2024 share repurchases, but free cash flow was $53.0M in FY2025. For a brand navigating a tariff-driven cost-structure shift, the absence of funded debt means management can absorb a year of margin pressure without covenant risk or forced refinancing. Source: FIGS 10-K FY2024 and FY2025 balance sheet; EDGAR CIK 0001846576.
4. Q4 FY2025 was the company's first $200M quarter ($201.9M, +33% YoY) and Q1 FY2026 grew 28.0% - the fastest growth since FY2021. This is the bull case's strongest data point: after a near-stall in FY2024 (+1.8%), two consecutive high-growth quarters suggest the brand re-inflected rather than stalled permanently. FY2026 guidance of 14-16% net revenue growth with EBITDA margin expanding to 13.0-13.2% would be a structural improvement from FY2025's 11.8%. Source: FIGS Q1 2026 press release (ir.wearfigs.com, May 7, 2026); Seeking Alpha (Feb 27, 2026).
Section 4 - Weaknesses: the cracks in the 10-Q
1. Gross margin has declined every year since the IPO - not once recovered. This is the central fact the FIGS story cannot paper over. FY2020 gross margin (pre-IPO peak): 72.3%. Then five consecutive public-company years of decline - FY2021: 71.8%, FY2022: 70.1%, FY2023: 69.1%, FY2024: 67.6%, FY2025: 66.5% - totaling 580bps of compression from that FY2020 peak. The 10-K FY2025 states verbatim: "Gross margin decreased 1.1 percentage points from 67.6% to 66.5% in the year ended December 31, 2025." Five years of consecutive public-company decline across supply chain disruptions, normalized freight environments, revenue growth, and revenue near-stall. The structural read from the 10-K arc: it is not one cause but a compounding of air freight, promotional markdowns, product mix shift to lower-margin non-scrubwear, and now tariff exposure. On $631M of revenue, the 580bps of compression from FY2020 to FY2025 represents approximately $37M of "missing" annual gross profit versus the original model. Source: FIGS 10-K FY2021-FY2025.
2. Adjusted EBITDA margin has been roughly halved from the IPO-era promise. FY2021 Adj EBITDA: $105.2M (25.1% margin). FY2025 Adj EBITDA: $74.5M (11.8% margin). The FY2025 absolute dollar figure is still 30% below FY2022's $87.3M - on 25% more revenue. FY2024 was the trough: $51.8M, 9.3% margin. The FY2025 recovery is real but incomplete. The IPO-era narrative was "high-margin DTC compounder"; the current reality is "low-double-digit EBITDA apparel brand with tariff risk." And as the Eightx June 2026 analysis flagged: FY2025 operating income ($38.1M) is actually lower than FY2020 ($57.9M) despite revenue 2.4x'ing - every dollar of gross profit being generated is being partially consumed by operating expense growth. Source: FIGS 10-K FY2021, FY2025; EDGAR CIK 0001846576.
3. Vietnam and Jordan concentration is now a direct tariff target. The FY2025 10-K MD&A (Recent Developments / Global Trade Policy) states verbatim: "In April 2025, the United States announced a baseline tariff of 10% on all imports, in addition to country-specific tariffs applicable to certain trading partners, including Vietnam and Jordan, which together account for nearly all of our production of finished goods." FIGS built its supply chain in those two countries for cost efficiency - Vietnam for scale and Jordan for favorable pre-2025 trade terms. The April 2025 tariff regime eliminated both advantages simultaneously. A February 2026 Supreme Court ruling partially invalidated IEEPA-based tariffs, but management explicitly states "we cannot predict additional near-term changes in global trade policy." A second tariff cycle - or reversal of the IEEPA ruling - would hit FIGS harder than most DTC apparel brands because the production concentration is near-total. Source: FIGS 10-K FY2025, MD&A / Recent Developments; Item 1A for broader tariff risk discussion.
4. Customer growth decelerated sharply from IPO-era rates - and the FY2024 trough was the weakest add rate in company history. Active customer growth: +46% (FY2021), +22% (FY2022), +13% (FY2023), +3% (FY2024), +9% (FY2025 partial recovery). The FY2024 10-K is direct: "In the quarter ended December 31, 2023, we did not add new customers at the same accelerated rates as we have in the past and have seen the frequency of repeat purchases decline." At 2.921M active customers against a ~20M US healthcare worker TAM (per FY2021 10-K), penetration is roughly 14-15% - there is mathematical room to grow, but the pace of adds and NRPAC trajectory through FY2024 suggest the first-mover flywheel has normalized. FY2025 recovery to +9.4% is encouraging; whether it holds is the operational question. Source: FIGS 10-K FY2024, FY2025.
Section 5 - Opportunities and threats
The opportunity side is more varied than the product category suggests.
International is the most concrete near-term growth lever. Q1 FY2026 international revenue grew approximately 50% YoY to $28.3M - the fastest-growing segment. The Goldman Sachs Conference transcript (Sep 3, 2025) showed management announcing flagship expansions in Mexico, Europe, the Middle East, Australia, and Canada. International is now roughly 18% of total revenue based on Q1 FY2026 disclosures. The global medical clothing market was estimated at $121.5B in 2025 per Fortune Business Insights, growing to an estimated $216.8B by 2034, and FIGS is undersized in nearly every non-US market.
TEAMS (B2B institutional) is the channel with the highest structural margin profile if scaled correctly. Institutions purchasing bulk scrubs for employees operate on multi-year contracts and high repeat volumes - the economics resemble subscription more than transactional DTC. FIGS management highlighted TEAMS at the GS Conference as a "growth vector" but has never quantified it. The Community Hub retail stores serve as activation points for institutional buyers. If TEAMS scales, it adds revenue that converts at higher margins with lower CAC per unit than pure consumer DTC.
Non-scrubwear grew +31.3% in Q1 FY2026 (faster than scrubwear's 27.2%) but represents only 21% of revenue. Footwear, compression socks, and lifestyle categories are the product-line diversification opportunity - and the margin risk. Non-scrubwear typically carries lower gross margins than core scrubs, which is one driver of the multi-year compression. Scaling it too fast before achieving cost efficiency in those categories would accelerate the very trend the company is trying to reverse.
The threats are sharpest around three vectors.
Tariff risk is no longer hypothetical. It materialized in April 2025 and received partial IEEPA relief in February 2026. The policy environment is fluid. FIGS has essentially no operational hedge against a return to the full April 2025 tariff structure - diversifying manufacturing geography requires 18-36 months of lead time under normal supply chain transition timelines.
Competition from established apparel brands is the medium-term threat the 10-K calls out as "copycat" entrants. Cherokee, Barco, Careismatic, Jaanuu, Maevn, and others are established players who recognize the premium positioning FIGS created. Fabletics Scrubs enters the category with a subscription-model price advantage. Each competitor's entry narrows the price gap that FIGS's brand commands.
The governance structure - co-founders Heather Hasson and Trina Spear hold Class B shares with 10:1 voting - means no external shareholder can compel strategic change even if the operational performance continues to disappoint. The January 2025 rejection of Story3 Capital's $6/share take-private bid (described in Reuters, Jan 16, 2025) illustrates the point: the board rejected PE interest citing "confidence in the standalone plan" in a year when operating income was $2.3M on $555M of revenue.
Section 6 - The macro environment
FIGS is flying through three macro forces at once, and they point in different directions.
The healthcare employment tailwind is the structural demand case. Healthcare is the fastest-growing major employment sector in the US economy - management has cited this consistently, and the data supports it. BLS data shows healthcare and social assistance employment growing faster than total private employment through 2025. More healthcare workers means more potential FIGS customers, and the replenishment nature of scrubwear means an expanding workforce creates structural baseline demand. This tailwind is not FIGS-specific, but FIGS is disproportionately positioned to capture it because its brand is nearly synonymous with premium scrubs in the healthcare-professional community.
The April 2025 apparel tariff regime is the sharpest brand-specific macro risk. As documented in the FY2025 10-K, Vietnam and Jordan received country-specific tariff treatment above the 10% baseline. For a brand with near-total production concentration in those two countries, this translates directly into cost-of-goods pressure. The February 2026 IEEPA Supreme Court ruling provided partial relief, but the broader 10% universal baseline remains and trade policy is explicitly flagged by management as unpredictable. Unlike a brand with diversified manufacturing across 10+ countries, FIGS cannot shift production quickly if the tariff regime re-escalates.
Freight costs remain an active variable. The Red Sea crisis forced premium air freight on Jordan-sourced goods throughout FY2024 - estimated by the FY2024 10-K as a material contributor to the 150bps gross margin decline that year. Management cited freight normalization as a partial tailwind in FY2025, but the $61.2M OCF in FY2025 was lower than FY2024's $81.2M despite better EBITDA, partly due to tariff-driven inventory pre-builds. The inventory balance rose to $128M at FY2025 year-end (from $116M) and $139.4M at Q1 FY2026 - management commentary suggested this included some tariff-related front-loading.
Healthcare professionals as a consumer cohort sit in an interesting spot macroeconomically: employed, often union-contract-protected or salary-linked, and spending on scrubs as a professional rather than purely discretionary category. FIGS benefits from this relative defensibility compared to a lifestyle brand serving the general consumer. But premium pricing ($30-60 per scrub piece versus $15-25 for commodity alternatives) means FIGS is not immune to a healthcare-worker who decides to downgrade to a hospital-provided scrub or a legacy brand in a tight personal budget year.
Section 7 - The CFO verdict and the operator bridge
Here is the CFO-level read on FIGS, with full engagement of what the Street's bull and bear cases actually argue.
The bulls (BTIG, KeyBanc, Oppenheimer at $19-22 price targets) read Q4 FY2025 (+33% YoY, first $200M quarter) and Q1 FY2026 (+28% YoY) as confirmation that demand inflected, the 14-16% FY2026 full-year guide is management sandbagging, and the path to $875M revenue / $75M earnings by 2029 is intact. The bears (Goldman Sachs' Brooke Roach set a $7.50 target before upgrading to Hold in February 2026; Eightx's June 2026 analysis) point to the structural lever that is broken: FY2025 operating income of $38.1M is lower than FY2020's $57.9M even though revenue 2.4x'd. Every dollar of gross margin is being consumed by operating expense growth below the gross profit line.
Our read: we agree with the bulls on the brand - it is real, the community positioning is durable, and the healthcare employment tailwind is structural. We agree with the bears on the P&L trajectory: a gross margin declining for five consecutive years is not "freight and timing," it is a structural model shift.
The realism check matters here. Do not tell FIGS to "raise gross margin" - the existing 66.5% is already roughly 10 points above DTC apparel peers and is pinned by fabric mix, duty drawback mechanics, and the tariff structure. There is no obvious cost-of-goods pathway to 70%+. The lever that is actually open is marketing ROI - and this is the only prescription the research confirms both sides agree has management traction. Marketing fell from 15.9% of revenue in FY2024 to 14.8% in FY2025. The Q1 FY2026 call showed active customers crossing 3.0M for the first time. If the "full-funnel" CAC reduction strategy management has been presenting since the Goldman Sachs Conference (Sep 3, 2025) actually lands +10-12% customer growth for two or three more quarters, the operating math changes: more customers at $216 NRPAC with stable marketing expense means EBITDA dollars compound faster. That is the thesis the Street's bulls are underwriting.
The differentiating Eightx thesis the sell-side largely misses: the brand equity is structural, but the operating income line is being managed more tightly than it looks. G&A at 22.6% of FY2025 revenue is enormous for a company this size - and a substantial portion is stock-based compensation, public-company costs, and transition costs that could compress over time. The one-time Jordan supplier transition costs and FY2024 fulfillment-center capex ($14.1M) have now rolled through the P&L. FY2026 has a cleaner base to build from. The question is whether the tariff regime re-escalates before that operating scale efficiency actually shows.
The operator bridge. Your $5-80M DTC brand has a FIGS-shaped pattern in miniature if your gross margin is high, your customer-add rate is slowing, and your operating expense ratio has not moved in proportion to revenue growth. The tell is this: FIGS grew revenue 2.4x from FY2020 to FY2025, but operating income declined from $57.9M to $38.1M in the same period. The math says gross margin compression at the top is being amplified by operating expense expansion below - and the two effects are self-reinforcing. When marketing has to grow to sustain customer adds, and customer adds are generating lower NRPAC than the original cohort, the unit economics of the whole model shift.
I have seen this in client work: a brand with a genuine 60%+ gross margin and NPS of 70+ that could not convert any of that brand strength into operating income growth because the customer acquisition cost kept rising to reach the next ring of the addressable market. The warning was visible eighteen months early in the NRPAC trend - the revenue per active customer was drifting down, not up, even as top-line growth looked healthy.
Early-warning scorecard - five lines that catch this FIGS pattern before it lands in your P&L:
- Gross margin direction, quarter-over-quarter: if gross margin declines in two or more consecutive years without a single recovery quarter, it is structural - not freight. The FIGS five-year consecutive decline is the signal that was available at FY2022 but not acted on as a structural conclusion until FY2023-2024.
- NRPAC (net revenue per active customer) trend: when NRPAC is declining while total revenue grows, AOV is masking customer-quality degradation. FIGS' NRPAC fell from an implied $221 (FY2021) to $208 (FY2024) before recovering to $216. The gap between new-cohort and mature-cohort NRPAC is the operational signal.
- Active customer growth rate vs marketing spend %: if customer growth is decelerating while marketing as a percentage of revenue is flat or falling, the model is borrowing against brand equity rather than reinvesting in acquisition. FIGS cut marketing from 15.9% to 14.8% in FY2025; bears argue this is "quietly starving the funnel."
- Operating cash flow vs EBITDA gap: when OCF falls materially below EBITDA (FIGS: $74.5M Adj EBITDA, $61.2M OCF in FY2025), working capital is absorbing the difference. For FIGS, this was inventory pre-builds related to tariff uncertainty. Understand what is getting longer - inventory or receivables.
- Geographic sourcing concentration vs trade policy calendar: if two countries account for "nearly all" of your finished-goods production, map the next tariff cycle before it arrives. FIGS was hit by the April 2025 tariffs because Jordan's trade advantages and Vietnam's cost efficiency made concentration rational under the prior regime. That rationality changes in months; supply chain diversification takes years.
If you want to run this scorecard against your own P&L before the gross margin trend becomes the headline, that is a fractional CFO conversation.
Sources and methodology
SEC EDGAR is the primary source for every financial figure in this post. FIGS, Inc. (CIK 0001846576) files on SEC EDGAR under 10-K and 10-Q form types. Specific filings used: 10-K FY2025 (filed 2026-02-26, accession 0001628280-26-012333); 10-K FY2024 (filed 2025-02-27, accession 0001628280-25-008688); 10-K FY2023 (filed 2024-02-28, accession 0001628280-24-007659); 10-K FY2022 (filed 2023-02-28, accession 0001628280-23-005575); 10-K FY2021 (filed 2022-03-10, accession 0000950170-22-003380). Revenue, gross margin, operating income, net income, OCF, inventory, cash, and all balance sheet figures are taken directly from XBRL financial statements and MD&A in these filings.
FIGS EDGAR XBRL note on LongTermDebt: XBRL tags for LongTermDebt and TotalDebt returned null across all fiscal years through FY2025, consistent with zero funded debt post-IPO. Note that FIGS maintains an undrawn $100M revolving credit facility (Bank of America, 2021 Facility, maturing September 2026) confirmed in the FY2024 10-K footnotes, with $4.9M in outstanding letters of credit and $95.1M available as of December 31, 2024. The revolver is a contingent facility, not funded debt.
FY2020 gross margin of 72.3% is sourced to the edgar.json research bundle (EDGAR MCP pull, 2026-06-23) and is consistent with the FY2021 10-K comparative period disclosures. The edgar.json notes FY2020 gross margin at 72.3% as the all-time peak; FY2021 was 71.8% (the first public company year). The 580bps compression cited throughout this post runs FY2020-FY2025.
Adj EBITDA figures are non-GAAP measures as reported by FIGS management in each fiscal year's press release and 10-K. FY2021: $105.2M; FY2022: $87.3M; FY2023: $86.0M; FY2024: $51.8M; FY2025: $74.5M. These are sourced from the edgar.json research bundle and 10-K filing MD&A sections.
Q1 FY2026 figures (revenue $159.9M, gross margin 67.7%, operating income $4.5M, active customers 3.0M+) are from the FIGS Q1 2026 earnings press release (ir.wearfigs.com, May 7, 2026) and the Motley Fool Q1 2026 earnings call transcript (May 8, 2026). Inventory of $139.4M and AOV of $124 in Q1 FY2026 are from the same call transcript.
Analyst consensus and thesis layer (bull case, bear case, sell-side ratings, realism check) is from the Parallel.ai ultra deep research synthesis in the research bundle, corroborated by dated press citations: Goldman Sachs Brooke Roach Strong Sell/$7.50 (Jan 30, 2026, per WallStreetZen); Goldman upgrade to Hold (Feb 27, 2026); Story3 Capital $6/share bid and FIGS rejection (Reuters, Jan 16, 2025); Seeking Alpha Sanket Karve Hold piece ($16.97 price, Mar 6, 2026); Trefis bear-case drawdown analysis (May 9, 2026); Yahoo Finance bull-case ($875M / $75M earnings 2029, Jun 10, 2026). Analyst commentary is synthesized opinion, not SEC-filed fact; it is attributed as such throughout.
Goldman Sachs Conference quotes and "full-funnel marketing" framing sourced to investing.com transcript summary (Sep 3, 2025).
Jordan supplier labor allegations are sourced verbatim from FIGS 10-K FY2024 Item 1A. These are risk disclosures, not adjudicated findings.
Global medical clothing market size ($121.5B in 2025) is sourced to Fortune Business Insights, as cited in the Parallel.ai research bundle. This is a third-party market sizing, not a company-disclosed figure.
Social signal is colour only. The three TikTok embeds in Section 2 are from the medical scrubs / FIGS category and carry no financial claim. @hailee_shelley (641K plays), @gabby_rod09 (149.9K plays), and @pattygaffxoxo (142.5K plays) were selected from the tiktok_top5_embeds.json research bundle as illustrative of community demand, brand identity signaling, and consumer trust risk. They are not evidence of any revenue or margin figure.
Limitations. FIGS does not break out TEAMS revenue, international revenue, or Community Hub revenue as separate reporting segments in XBRL-accessible format. Geographic revenue split is not disclosed in structured form. Repeat customer percentage of revenue is mentioned qualitatively but not precisely quantified. This post reflects filings and disclosures current through June 23, 2026.
Frequently asked questions
is figs profitable?
Yes, in GAAP terms. FIGS posted $34.3M net income and $38.1M operating income on $631.1M revenue in FY2025. The nuance is that operating income in FY2025 ($38.1M) is lower than FY2020's $57.9M despite revenue 2.4x'ing, because gross margin has compressed 580bps from the 72.3% peak while operating expenses grew alongside revenue. Profitability is real, but the model converts each dollar of revenue into fewer operating income dollars than it did five years ago. Source: FIGS 10-K FY2025.
why has figs gross margin fallen every year since the ipo?
Five drivers compounded across different years: elevated air freight costs from COVID supply chain disruptions (FY2021-2022), FY2022 inventory overhang that required promotional markdowns, Red Sea shipping disruptions forcing premium freight in FY2024, product mix shift toward lower-margin non-scrubwear categories, and April 2025 US tariff impacts on Vietnam and Jordan production. Critically, FIGS has never demonstrated an ability to reverse the trend - gross margin has declined every fiscal year since FY2020. Source: FIGS 10-K filings FY2021-FY2025.
what is the tariff risk for figs?
Severe and concentrated. The FY2025 10-K MD&A (Recent Developments / Global Trade Policy) states verbatim that Vietnam and Jordan "together account for nearly all of our production of finished goods." The April 2025 US tariff regime imposed a baseline 10% tariff on all imports plus country-specific tariffs on both countries simultaneously. A February 2026 Supreme Court ruling partially invalidated the IEEPA-based tariffs, providing some relief, but management notes "we cannot predict additional near-term changes in global trade policy." The production concentration was built for cost efficiency; it is now the company's single largest macro risk. Source: FIGS 10-K FY2025, MD&A / Recent Developments; Item 1A for broader tariff risk factors.
what is figs teams and how big is it?
FIGS Teams is the B2B institutional channel through which healthcare organizations purchase scrubs in bulk. It is a direct-to-consumer construct - no wholesale distribution. Teams is a stated growth priority in every filing since FY2022, but FIGS has never disclosed Teams revenue separately. The Goldman Sachs Conference (Sep 3, 2025) cited Teams as a growth vector, and Community Hub physical stores serve as local activation points. Source: FIGS 10-K FY2025; Goldman Sachs Conference transcript (Sep 3, 2025).
who are figs main competitors?
Within premium medical scrubs: Jaanuu, Fabletics Scrubs, and DTC entrants. Legacy players - Cherokee, Barco, Careismatic, Landau, Medline, Maevn, Adar - rely on wholesale/institutional supply chains rather than direct consumer relationships. The FY2025 10-K refers to "copycat competition" from established apparel brands entering the medical niche. FIGS' competitive moat is the DTC model, the FIONx fabric technology, and the community/identity positioning.
what happened with the figs jordan supplier?
In FY2024, FIGS disclosed its Jordan-based supplier - "currently accounts for a majority of our production" - faced allegations of labor conditions "that do not meet our high standards." FIGS announced an active transition away from this supplier. By FY2025, the 10-K confirmed Vietnam and Jordan together still account for nearly all production, meaning the transition is ongoing. The event created simultaneous ESG/reputational risk, operational supply chain risk, and elevated freight exposure, as Jordan shipments transit Red Sea routes affected by Middle East conflict. Source: FIGS 10-K FY2024 and FY2025, Item 1A.
does figs have debt?
No funded debt. EDGAR XBRL tags for LongTermDebt and TotalDebt return null for FIGS across all fiscal years through FY2025, consistent with zero outstanding bank debt or bond obligations. FIGS does maintain an undrawn $100M revolving credit facility (Bank of America, 2021 Facility, maturing September 2026) with $95.1M available as of FY2024 year-end - it provides liquidity headroom but is not debt unless drawn. The company was funded by its May 2021 IPO (approximately $450M gross). Cash declined from $195M (FY2021 year-end) to $82M (FY2025 year-end), driven by inventory builds, fulfillment capex, and $45.5M in share repurchases in FY2024. Free cash flow was $53.0M in FY2025. Source: FIGS 10-K FY2024 and FY2025 balance sheet; EDGAR XBRL.
what is figs 2026 guidance?
Following Q1 FY2026 results (revenue $159.9M, +28.0% YoY), FIGS raised its FY2026 guidance to 14-16% net revenue growth with an Adjusted EBITDA margin of 13.0-13.2% and operating margin of 7.8-8.0%. Q4 FY2025 was the first quarter above $200M ($201.9M, +33% YoY). The guidance debate - whether 14-16% is conservative sandbagging or the actual go-forward rate - is the primary analytical disagreement on FIGS as of June 2026. Source: FIGS Q1 2026 press release (ir.wearfigs.com, May 7, 2026); Seeking Alpha (Feb 27, 2026).