
Insights
What is GMROI? The retail inventory metric your P&L doesn't show (with 2026 category benchmarks)
GMROI (gross margin return on inventory investment) measures gross margin dollars earned per dollar of average inventory cost. The healthy DTC band is 2.0 to 3.0; beauty brands routinely hit 3 to 5 because high margins offset fast turns, while grocery sits at 1.2 to 2.0. Below 2.0 means inventory is consuming cash faster than it earns margin.
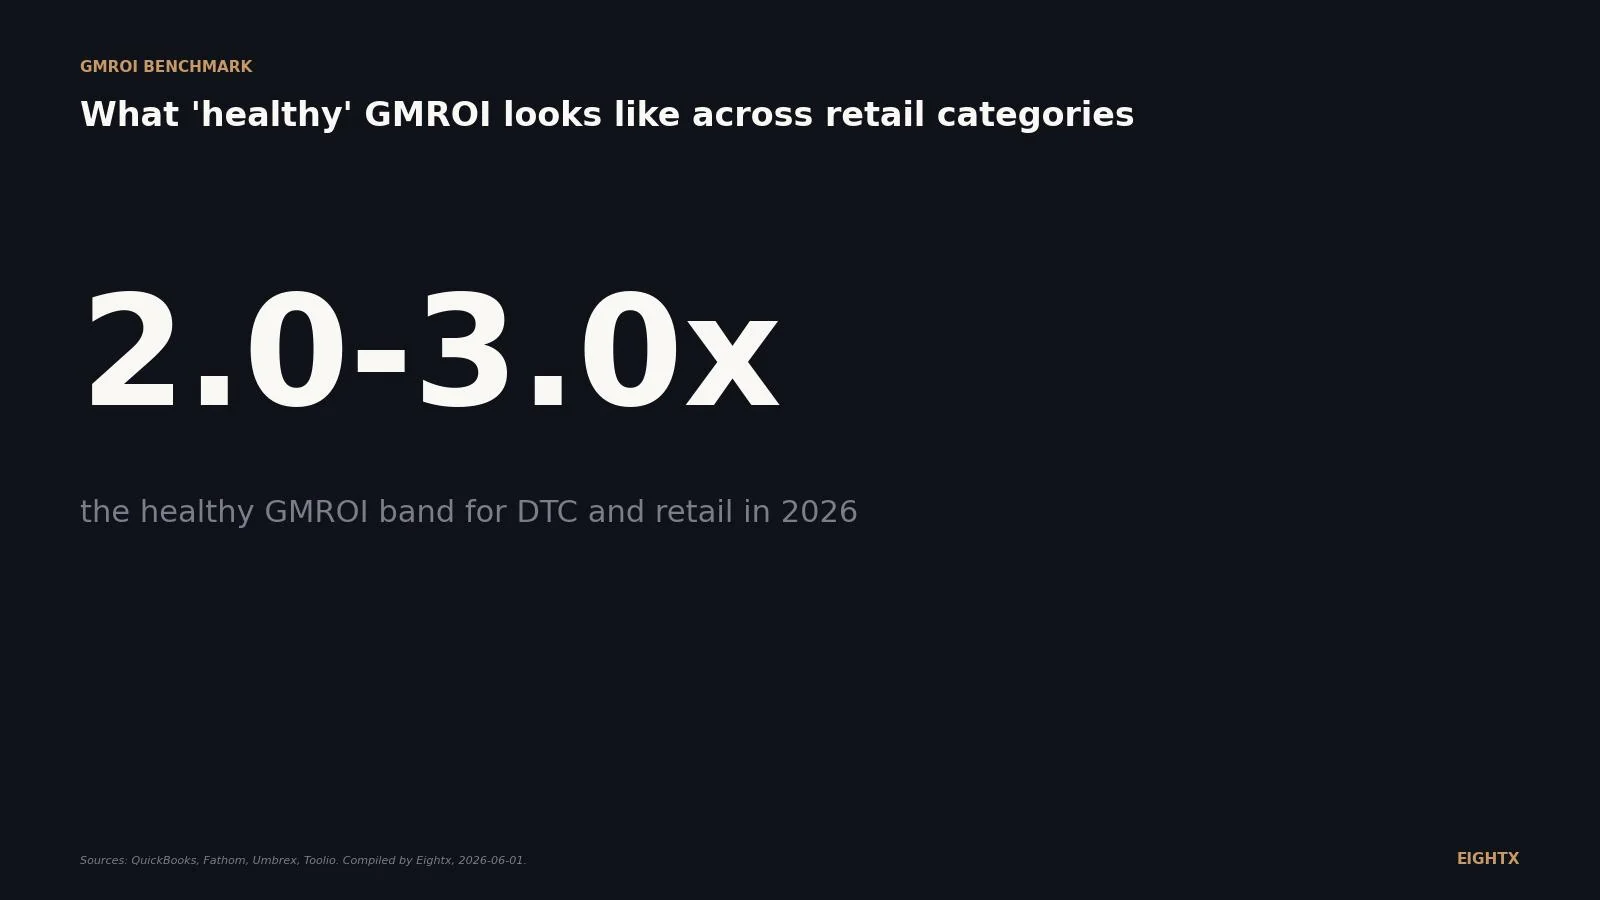
GMROI (Gross Margin Return on Inventory) is the retail and consumer packaged goods (CPG) metric that tells you how many dollars of gross profit you earn for every dollar tied up in inventory at cost. It is the only single number that blends margin AND turns into one capital-efficiency ratio, which is why merchants, direct-to-consumer (DTC) brands, and stockholding planners use it to decide what to reorder, what to mark down, and what to delete from the assortment. Most healthy retailers run between 2.0 and 3.0 overall. Beauty pushes 3.0 to 5.0 plus, grocery sits 1.2 to 2.0, and furniture lands 1.3 to 2.5.
GMROI answers a question your profit and loss statement (P&L) cannot: is the inventory you're holding actually earning its keep? A category can post a healthy gross margin and still destroy cash if it turns once a year. GMROI puts margin and turns on the same scoreboard. Anything under 1.0 means that category is losing gross-margin dollars relative to the inventory carried, and either needs a price or markdown intervention or should be cut. For ecommerce operators between $5M and $150M in revenue, this is the difference between a healthy reorder rhythm and a working-capital hole that compounds every season.
How it works
The canonical formula is GMROI = Gross Margin Dollars / Average Inventory at Cost. The equivalent form (Annual Sales / Average Inventory at Cost) multiplied by Gross Margin % shows why the metric works: it is literally inventory turnover multiplied by gross margin percentage. Worked example: a hero serum stock-keeping unit (SKU) with a 70% gross margin and 6.0 inventory turns lands at a GMROI of 4.2 (strong, beauty band). A core apparel basic at 55% margin and 4.5 turns lands at 2.5 (healthy). A sofa at 45% margin and 3.0 turns lands at 1.4 (weak, furniture band). A snack bar at 35% margin and 8.0 turns lands at 2.8. Two routes to a strong number: beauty wins on margin, consumer packaged goods snacks win on turns. Both land above 2.5 by different paths.
Common triggers
- You're sitting on a slow-moving category and trying to decide whether to mark it down, reorder less, or delete it from the assortment.
- You're choosing between depth (more units of fewer winners) and breadth (more skus, less per sku) for the next purchase order cycle.
- Your bank account feels tight even though the P&L shows a profit, and you suspect inventory is locking up the cash.
- You're prioritizing where to allocate Meta or Google ad spend across your assortment and need a margin-and-cash filter, not just a margin filter.
- You're sizing a working-capital line of credit or revenue-based financing and need a defensible cash-efficiency number per category.
The most common mistake
Treating GMROI as a net-profit proxy. GMROI ignores operating expenses (OPEX) entirely. Rent, fulfillment, ad spend, headcount: none of it is in the formula. A category can post a GMROI of 4.0 and still lose money once Meta CPAs and 3PL pick-pack fees are layered in. The second-most common mistake is comparing GMROI across categories that have fundamentally different turn-rates: grocery should NOT be benchmarked against beauty. Use category-specific bands. If you need a cash-realistic view that adjusts for markdowns and shrink, CMROI (Cash Margin Return on Inventory) is the variant most planners reach for. Use GMROI weekly for reorder decisions. Use the full P&L monthly for the net-profit picture.
Browse the full ecommerce finance glossary for every metric and money term a DTC operator needs.
Frequently Asked Questions
what's a good gmroi for an ecom store in 2026?
2.0 to 3.0 is the broadly healthy band for direct-to-consumer and ecommerce retail in 2026. Under 1.0 means inventory is destroying gross-margin dollars and the category needs intervention or deletion. Over 3.0 is strong and typical of beauty winners and apparel hero stock-keeping units. Always benchmark against your category band, not the overall number.
how do i calculate gmroi for my store?
Pull gross margin dollars and average inventory at cost from your trailing 12 months. Divide gross margin by average inventory at cost. The equivalent form is (annual sales divided by average inventory at cost) multiplied by gross margin percent. Most operators run this monthly by category and weekly by top stock-keeping unit.
whats the difference between gmroi and inventory turnover?
Inventory turnover tells you how fast inventory moves. GMROI tells you how profitable that movement is per dollar locked up. GMROI is literally turnover multiplied by gross margin percent. Looking at turns alone misses thin-margin SKUs that spin fast but earn nothing. Looking at margin alone misses fat-margin SKUs that sit on the shelf for a year.
why is my gmroi below 1.0?
Either the category has thin gross margins, slow turns, or both. Below 1.0 means every dollar of inventory cost is returning less than a dollar of gross margin over the period measured. Options: raise price, cut Cost of Goods Sold (COGS), markdown out the depth, or delete the category. Loss-leader SKUs that drive basket can sit below 1.0 intentionally, but they need to be tagged as such in your reorder logic.
should i use gmroi or cmroi for cash planning?
CMROI (Cash Margin Return on Inventory) is the cash-realistic version because it adjusts for markdowns and shrink. Use GMROI for reorder and assortment decisions because it's faster to calculate and most planners already track its inputs. Use CMROI when you're sizing a working-capital line or stress-testing a slow-moving category that's been marked down repeatedly.