
Cash Flow
Seasonal Cash Flow Planning for Apparel Brands 2026
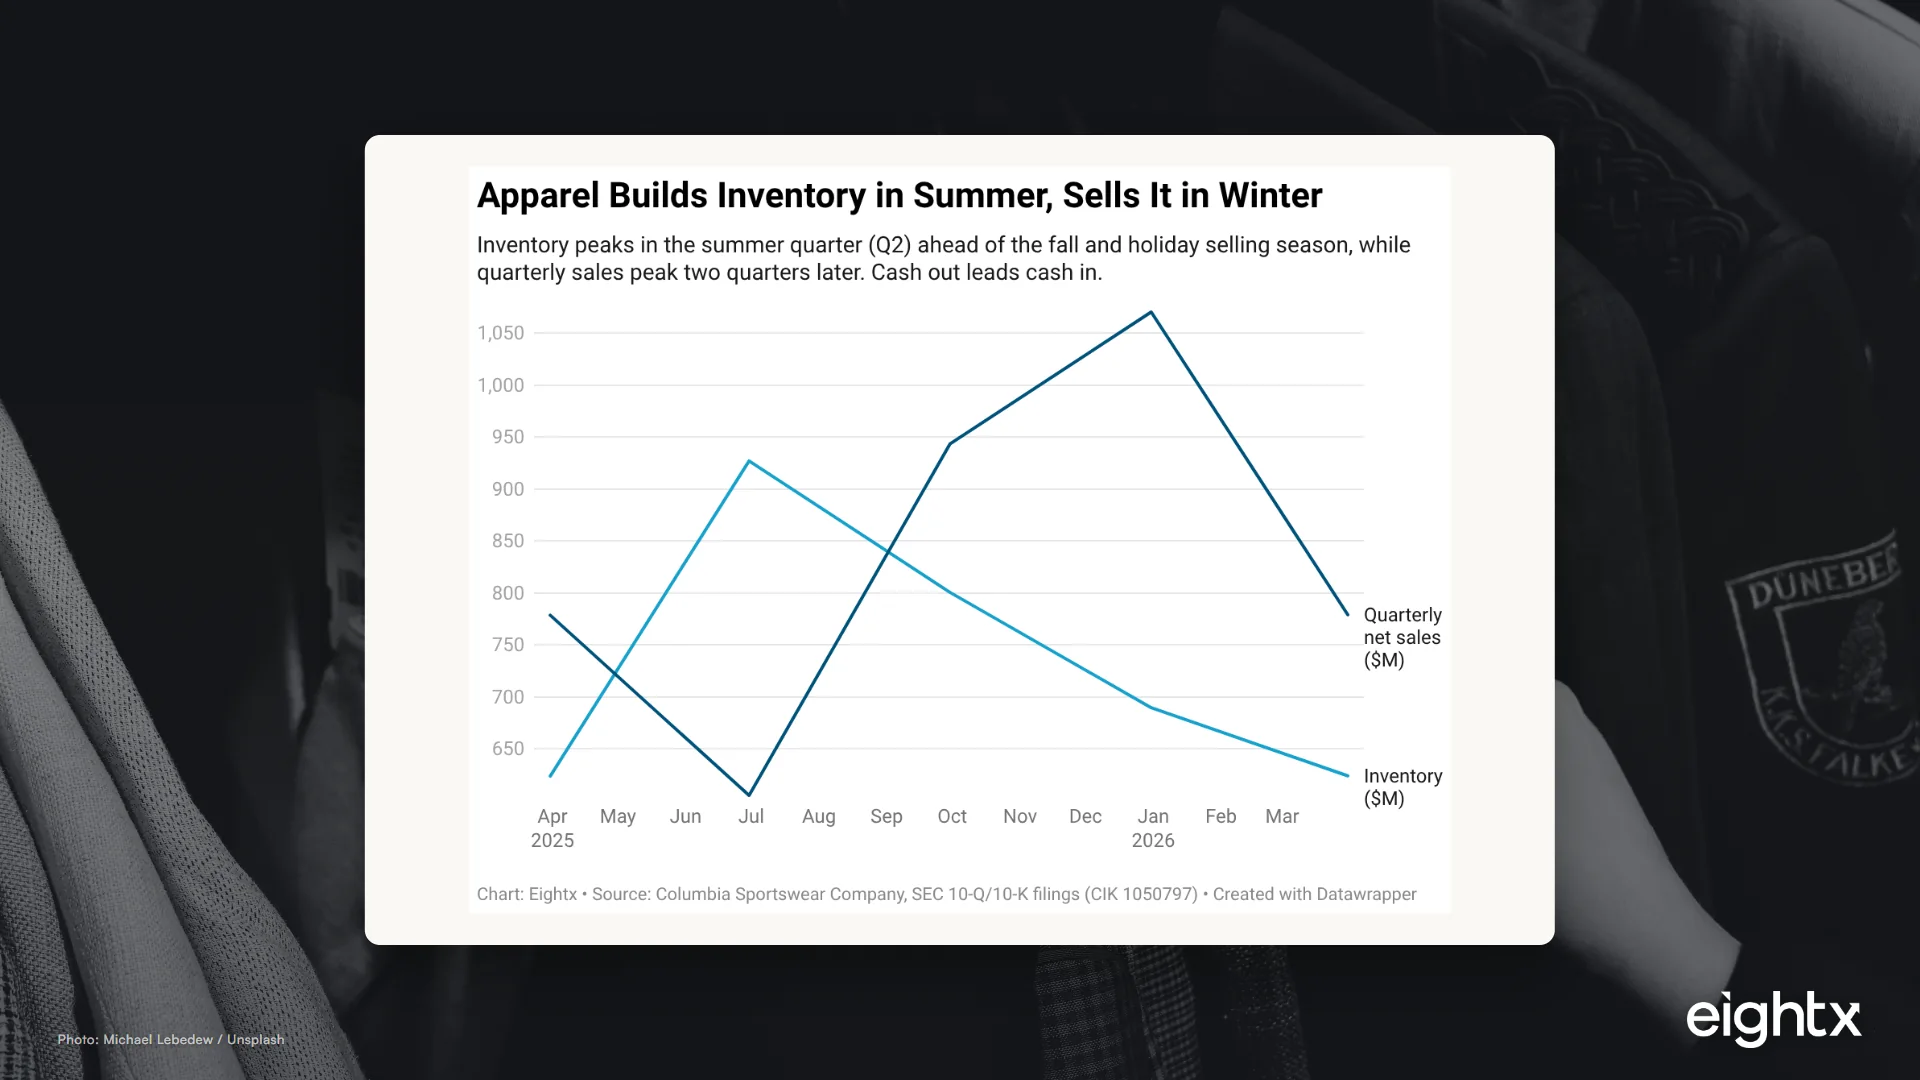
Apparel cash flow is seasonal because brands pay for SS and FW production months before goods sell through. Public filings prove it: inventory peaks in summer and bottoms after the holidays, while revenue peaks two quarters later. Plan buys and financing around that curve, not the calendar.
Key Takeaways
- Apparel brands pay for production 6 to 8 months before sell-through, so cash out leads cash in by 2 to 3 quarters.
- Public filings prove the curve: Columbia Sportswear inventory ran $623.7M in spring to $926.9M in summer (+48%), then revenue peaked at $1,070M two quarters later.
- Public apparel carries a median 128.8 inventory days, and the apparel DTC median is 145 days, so cash is tied up roughly 4 to 5 months.
- The cash trough for a two-season brand lands in summer (Jun to Aug) and again post-holiday (Jan to Feb).
- Finance the buy, not the business: size a line to the seasonal gap, clean it down each cycle, and a permanent draw is a red flag for over-buying.
Most apparel founders I work with think they have a profit problem. They have a timing problem. The brand is profitable on paper, the margins are fine, and yet every summer the bank balance gets uncomfortably thin and every winter it does it again. That is not bad luck. It is the structure of the business. Apparel buys in seasons, pays for those seasons months in advance, and collects the revenue months later. Cash out leads cash in by two to three quarters, twice a year, every year.
When I talk to founders running a brand this size, the line I hear most is some version of "the P&L looks great but I am scared of July." One operator on a cash-flow forecast call put it bluntly: there were "negative balances in the first week of August," and the diagnosis wrote itself. July is terrible for apparel. That is not a one-off. It is the curve.
The fix is not "sell more." The fix is to see the seasonal cash curve clearly, know exactly where the trough sits, and plan your buys and financing around it. This post shows the curve in real public filings, names the trough, and gives you a month-by-month cash plan for a two-season brand.
Why apparel cash flow is structurally seasonal
Apparel runs on a season calendar: Spring/Summer (SS) and Fall/Winter (FW). For each season you commit to production well ahead of delivery. According to apparel sourcing and manufacturing trade guidance, bulk orders are typically placed and deposited 4 to 8 months before a season's first delivery, with 6 to 8 months of total planning lead time common for programs that need fabric development and sampling once you count QC and logistics. A deposit, commonly around 30%, is due at PO confirmation and the balance, around 70%, near completion or at shipment.
Then the goods land and you still wait. Public apparel brands carry a median of 128.8 inventory days, and the apparel DTC median is 145 days, per our apparel public benchmarks and inventory days by vertical work from SEC 10-K filings. That is four to five months of stock sitting before it sells. If you wholesale, add another 1 to 3 months because the cash arrives on Net 30 to Net 90 terms after you ship. Stack it all up and the cash you spent in the fall does not fully come back until the following spring.
| Step | Timing before delivery | Cash event |
|---|---|---|
| Design, fabric development, sampling | 6 to 8 months | Minimal cash |
| Place order plus deposit | 4 to 6 months | Deposit (~30%) out |
| Bulk production (PO to factory gate) | 75 to 110 days | No cash event |
| Balance payment | At completion or before shipment | Balance (~70%) out |
| Goods land and sell through | 128.8-day median (public apparel) | Cash comes back |
| Wholesale collection | Net 30 to Net 90 after shipment | Cash comes back, lagged |
That lead-lag is the whole story. The brand is solvent and profitable across the year, but inside the year it is feast and famine on a predictable schedule.
The seasonal cash curve, proven in public filings
You do not have to take the model on faith. The curve is visible in audited filings. Columbia Sportswear, a fall/winter-weighted apparel issuer, builds inventory hard into the summer quarter and then sells it in the fall and holiday quarters. Its inventory ran $623.7M at the end of Q1 (spring), jumped to $926.9M at the end of Q2 (the summer build, a 48% increase), then drew down to $800.4M in Q3 and $689.5M after the holidays. Quarterly net sales did the opposite, bottoming at $605.2M in Q2 and peaking at roughly $1,070M in the holiday quarter. The cash you spend building inventory in June does not come back as revenue until September through December.
| Quarter end | Columbia inventory ($M) | Columbia net sales ($M) |
|---|---|---|
| 2025-03-31 (spring) | 623.7 | 778.5 |
| 2025-06-30 (summer build) | 926.9 | 605.2 |
| 2025-09-30 (fall ship) | 800.4 | 943.4 |
| 2025-12-31 (holiday) | 689.5 | 1,070.2 |
This is not one company's quirk. G-III Apparel, an outerwear-heavy brand on a January fiscal year, shows the identical shape: inventory of $456.5M in spring, peaking at $639.8M in the summer quarter (a 40% build), then bottoming at $460.0M after the holidays. Two independent public issuers, same summer build, same winter sell-down. The seasonal cash curve is a category fact, not a planning assumption.
Where the trough actually sits
The trough is not the month with the biggest single outflow. It is the month where your cumulative cash gap is deepest, the point where everything you have paid out since the last refill exceeds everything you have collected. For a fall/winter-weighted two-season brand, that low point lands in summer, around July. You have paid FW deposits and balances, spring sell-through is winding down, and fall revenue has not started.
The chart above is an illustrative monthly model for a $20M two-season brand, the same idea at finer resolution than the public filings. Read the curve, not the individual bars. There are two stretches where cash out towers over cash in: roughly June through August, when you are paying FW balances before fall revenue lands, and January through February, when SS deposits go out while holiday cash has already been spent down.
| Window | What is happening | Cash effect |
|---|---|---|
| Jan to Feb | SS deposits go out, holiday cash spent | Secondary trough |
| Mar to May | Spring sell-through lands | Cash refills |
| Jun to Aug | FW balances paid, summer is slow | Primary trough (deepest ~July) |
| Sep to Oct | Fall sell-through begins | Cash refills |
| Nov to Dec | Holiday peak revenue | Annual high |
If you only look at your P&L you will never see this. Net income is smooth-ish across the year while cash whipsaws. The pattern we see again and again is a founder with healthy accrual profit getting caught short on payroll in August, not because the business is broken but because that gap between accrual profit and cash flow is at its widest in the trough. That gap is exactly why apparel brands with good margins still feel broke in July.
A month-by-month cash plan for a two-season brand
Here is the plan I give apparel operators. It is built around the curve above, with the actions placed in the months where they matter.
- January and February (SS deposit window): Pay SS deposits from cash you reserved in November and December, not from current sales. Lock your SS buy quantities here; this is the last cheap moment to cut an over-optimistic order.
- March, April, May (spring refill): Spring revenue is landing. Do not treat it as profit. This is the cash that has to carry you to the summer trough and fund FW deposits. Sweep a defined share into a separate reserve.
- June, July, August (the trough): This is where the year is won or lost. FW balances are due, summer is slow. Draw on your seasonal line here if you sized it correctly, and watch the 13-week forecast weekly, not monthly. One operator facing an August payroll squeeze tested a simple lever: instead of paying a factory balance in July, could the balance move to August or September? Air-freighting a portion to push the payment trigger trades a bit of freight cost for a few weeks of cash timing right in the trough. Sometimes that swap is the whole difference.
- September and October (fall refill): Fall sell-through starts and wholesale invoices begin collecting. First priority: pay down the line you drew over the summer. Second priority: reserve for January SS deposits.
- November and December (holiday peak): Your biggest cash-in months. Resist the urge to spend the surplus on a bigger next buy until you have funded the January deposit reserve and rebuilt your buffer.
The discipline that makes this work is a deposit calendar laid over a 13-week cash flow forecast. When we have struggled with this, what worked was treating 13 weeks as the standard planning horizon and updating it weekly, not monthly, so a negative balance in week 8 shows up while there is still time to act. List every PO, its deposit and balance dates, ship dates, and the net-terms lag on collections. Now the curve is not a vibe, it is a set of dated obligations you can fund against. This is the same engine behind our peak-season cash flow approach, applied to a two-season calendar instead of one Q4 spike.
Financing the gap without financing the business
Seasonal businesses should use seasonal financing. The right tool funds the buy and gets repaid from sell-through inside the same cycle: a revolving line of credit, an inventory-backed facility, or supplier terms that push your balance payment closer to when goods ship. Size the facility to your peak cumulative gap, not to your total buy. In the $20M model above, the worst-case cumulative gap is roughly one to one and a half months of revenue, so a line covering that plus a safety margin is the target, not a line equal to the whole FW order.
The warning sign is a line that never gets paid down. The pattern we see again and again is a brand that is maxed on its facility at the start of the build rather than the end, with the draw never returning to zero by year-end. When that happens the line is masking a deeper issue: too much inventory, margin that is too thin to refill the buffer, or buys that keep outrunning sell-through. On one diagnosis the first thing that jumped out was 250 days of inventory, far above the roughly 3 to 4 months we would target, and pulling that down was what freed the liquidity. At that point the answer is in the buy size and the inventory days, not in a bigger overdraft. Apparel is structurally slow inventory; your financing should respect that without becoming permanent.
If you want the full apparel picture behind these numbers, our fractional CFO work pairs the seasonal cash plan with margin and inventory discipline. The cash curve is also tied tightly to how you take orders and get paid, which is why it pairs with the apparel preorder cash model and apparel wholesale net terms and cash.
Methodology
The public seasonality data comes directly from SEC EDGAR filings. Columbia Sportswear (CIK 1050797, calendar-year filer) inventory by quarter-end: $623.7M (Q1 2025), $926.9M (Q2), $800.4M (Q3), $689.5M (Q4). Quarterly net sales: $778.5M, $605.2M, $943.4M, and a Q4 figure of about $1,070.2M derived as full-year ($3,397.351M) minus the reported nine-month ($2,327.123M), since Columbia reports three-month figures for Q1 to Q3 and full-year for Q4. G-III Apparel Group (CIK 821002, January fiscal year, so quarter-ends fall about one month after Columbia's) inventory: $456.5M, $639.8M (peak), $547.1M, $460.0M. The two issuers independently confirm the summer inventory peak.
Inventory-days benchmarks (median 128.8 days for the 9-company public apparel cohort, 145 days for apparel DTC) are from SEC 10-K filings as compiled in the Eightx apparel public benchmarks and inventory days by vertical analyses. Production lead and payment timing (4 to 8 months before delivery, with 6 to 8 months of planning lead for programs needing fabric development and sampling, deposit around 30% at PO, balance around 70% at completion or shipment) and wholesale collection lag (Net 30 to Net 90) are drawn from apparel sourcing and wholesale order-management trade publications; these are directional industry norms rather than audited figures.
The month-by-month $20M curve is an illustrative model built to show the shape of the seasonal cash curve at monthly resolution rather than to represent any single company. The seasonality it visualizes is independently supported by the Columbia and G-III filings above. Treat the trough month as directional: your exact low point depends on your DTC versus wholesale mix and your specific net terms. A fall/winter-weighted brand troughs around July; a spring/summer-weighted brand shifts the build earlier.
Frequently Asked Questions
why is apparel cash flow so seasonal?
Because apparel sells in seasons (SS and FW) and brands pay for that production 6 to 8 months before it ships and sells. Cash leaves for deposits and balances long before sell-through revenue arrives, so the business runs a structural lead-lag gap twice a year.
do public apparel brands really build inventory in summer?
Yes, and the filings show it plainly. Columbia Sportswear inventory ran $623.7M at the spring low to $926.9M at the summer peak, a 48% build, before revenue peaked two quarters later at about $1,070M in the holiday quarter. G-III Apparel shows the same summer peak. The cash goes out before it comes back.
how many months before a season do apparel brands pay for inventory?
Production is usually placed and deposited 4 to 8 months before first delivery. A deposit is due at PO confirmation and the balance near completion or shipment. With public apparel carrying a median 128.8 inventory days, cash is then tied up another 4 to 5 months before sell-through.
when is the cash low point for a two-season apparel brand?
For a typical fall/winter-weighted two-season brand the trough hits in summer (Jun to Aug), when FW production is being paid for before fall revenue lands, and again briefly post-holiday (Jan to Feb) when SS deposits go out before spring sell-through. Treat the exact month as directional and build your buffer around those two windows.
how much working capital does an apparel brand need for a seasonal buy?
Enough to cover the peak cumulative gap between inventory cash out and revenue cash in, not the full buy. In our $20M model the worst-case cumulative gap is roughly 1 to 1.5 months of revenue. Size your line and cash buffer to that gap plus a margin of safety.
should apparel brands use a line of credit for seasonal inventory?
Yes, if it is sized to the seasonal gap and repaid each cycle. A revolving line or inventory-backed facility that funds the SS and FW buy and gets paid down from sell-through is healthy. A line that never gets repaid is a sign the business is structurally short on margin or carrying too much inventory.
how do i forecast apparel cash flow by season?
Start with a 13-week rolling cash forecast and layer a deposit calendar on top of it: list each SS and FW PO, its deposit and balance dates, expected ship dates, and the net-terms lag on collections. That turns the seasonal curve into specific dates you can fund against.