
Insights
Universal Store ASX teardown: 61.1% gross margin and 13.3% online, the store-attached playbook for AU DTC operators
Universal Store (ASX:UNI) ran a 61.1% gross profit margin and 16.4% EBIT margin on A$333.3M FY25 revenue with online only 13.3% of sales, proving the store-attached model can out-earn pure DTC in AU youth apparel. But its THRILLS acquisition booked a A$13.6M goodwill impairment. Here is the store-attached playbook for AU operators.
Key Takeaways
- Universal Store ran 61.1% group gross margin and 16.4% EBIT margin in FY25, on $333.3m revenue, with online only 13.3% of sales. The pure-DTC margin story is not the only path for AU youth apparel.
- Online sales grew 8.6% in FY25 and 6.3% in H1 FY26, both lagging total sales growth of 15.5% and 14.2%. A well-run Shopify Plus stack on UniversalStore.com and PerfectStranger.com.au still does not outpace stores.
- The THRILLS acquisition is a cautionary tale. $50m EV at 6.8x FY22 EBIT in September 2022, $13.6m goodwill impairment in H1 FY25, and CTC gross margin still 14-18 points below the group rate two years later.
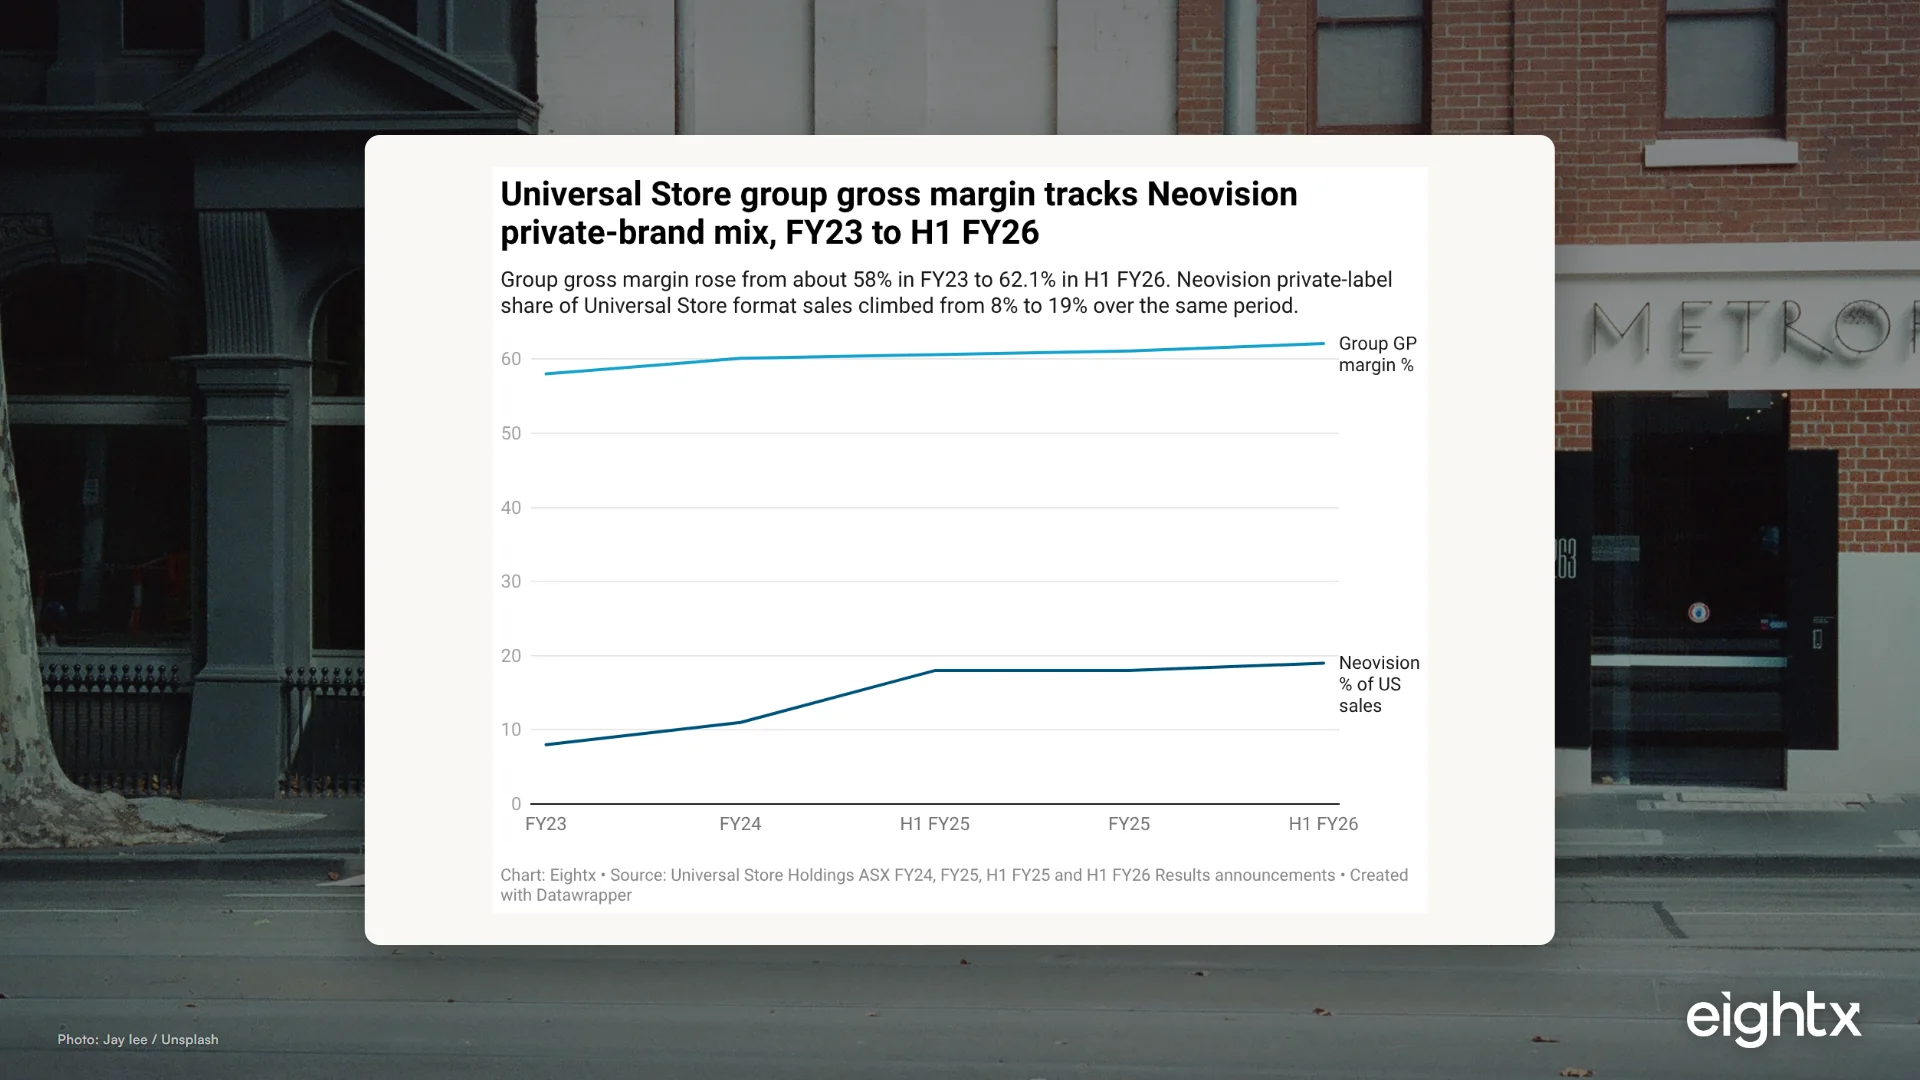
- Private-brand mix is the durable margin lever. Neovision moved from 11% of Universal Store format sales in FY24 to 19% in H1 FY26. Group gross margin moved with it, from about 58% in FY23 to 62.1% in H1 FY26.
- CFO Ethan Orsini is the named signatory on both the FY25 results (21 August 2025) and the H1 FY26 results (19 February 2026). Operating cash flow of $98.0m on $54.6m underlying EBIT is the working-capital signal to benchmark against.
If you run a $5m to $50m DTC apparel brand in Australia, Universal Store Holdings is the cleanest public benchmark you can read this year. ASX:UNI closed FY25 (financial year ended 29 June 2025) with $333.3m revenue, a 61.1% group gross margin, 16.4% underlying EBIT margin and operating cash flow of $98.0m. Online sales were only 13.3% of the group total. The lesson for AU operators staring down a 2026 plan is not that pure-DTC is dead. It is that store-attached margin economics still beat pure-online cash conversion when stores are productive, private-brand mix is the durable margin lever, and acquiring a brand costs more than the headline multiple suggests.
Universal Store's FY25 numbers, in one operator-readable scorecard
The FY25 ASX results (released 21 August 2025, signed off by CFO Ethan Orsini) print clean across the board. Group revenue grew 15.5% to $333.3m. Gross margin expanded 100 bps to 61.1%. Underlying EBIT grew 15.9% to $54.6m (a 16.4% EBIT margin). Underlying NPAT was $34.8m. Operating cash flow before financing was $98.0m, a 23.3% jump on FY24. The statutory NPAT of $23.3m looks weaker (-32.3% YoY) but that line includes the $13.6m H1 FY25 goodwill impairment on CTC, which we unpack in lesson two below.
For an AU DTC operator benchmarking against this scorecard, three numbers matter more than the rest. The 61.1% gross margin is the ceiling for omni-channel youth apparel with a meaningful private-label mix. The 16.4% EBIT margin is what disciplined operating leverage looks like at 100+ stores. And the $98.0m operating cash flow on $54.6m underlying EBIT (a 1.8x cash conversion ratio) is the working-capital benchmark every founder should chase.
| Metric | FY25 value | YoY change |
|---|---|---|
| Group revenue | $333.3m | +15.5% |
| Gross margin | 61.1% | +100 bps |
| Underlying EBIT | $54.6m | +15.9% |
| Underlying NPAT | $34.8m | +15.2% |
| Statutory NPAT | $23.3m | -32.3% (includes $13.6m CTC impairment) |
| Underlying operating cash flow | $98.0m | +23.3% |
| Online share of sales | 13.3% | (online grew +8.6%) |
| Net cash | $17.2m | +20.3% |
| Stores at year-end | 111 | +5 net new (FY24: 106) |
| FY25 dividend (fully franked) | 38.5 cps | +8.5% |
Lesson one: physical plus online still beats pure-DTC on cash conversion
The lazy read of the UNI numbers is that online is small and getting smaller as a share of sales. The sharper read is that the physical store base is doing the heavy lifting on cash conversion and that is exactly what you would design into a multi-brand AU youth retailer if you were starting from scratch.
Online sales grew 8.6% in FY25 against total growth of 15.5%, and the gap widened in H1 FY26 (online +6.3% vs total +14.2%). Online share of group sales slipped from 13.3% to 12.9%. Both the universalstore.com and perfectstranger.com.au sites run on Shopify Plus, with Klaviyo, Okendo, Loop Returns and Shoplift A/B testing in the stack. The capability is there. The customers prefer stores.
Why? Three operator reasons. AOV is higher in store for fashion, where the customer wants to feel the fabric and try the fit before paying $80 for a top. Returns rates are lower in store, because the conversion happens after the fit-room try-on. And cross-brand discovery happens on the same trip. A Universal Store customer at the Westfield Bondi store walks into Perfect Stranger next door without paying a second customer acquisition cost.
The cash conversion math compounds the advantage. UNI's $98.0m operating cash flow on $54.6m underlying EBIT is a 1.8x ratio that pure-DTC operators rarely touch, because pure online stores need to spend on paid acquisition every month while UNI's stores convert walk-by foot traffic from rents already paid. If you are running a pure-online brand benchmarking against UNI, do not try to copy the gross margin headline (61.1%) without acknowledging that you do not have the cash-conversion structure behind it.
The takeaway for your business: if you are deciding between scaling online or opening your first physical store in 2026, the UNI signal is that store productivity beats online growth on cash conversion for AU youth apparel right now. That does not mean every DTC operator should open stores. It means if you are already 50%+ of revenue through wholesale or store partners, a flagship retail door usually pencils.
Lesson two: the THRILLS acquisition is the case study in what acquired-brand growth actually costs
In September 2022 UNI announced the acquisition of CTC (the holding company for THRILLS and Worship) at a $50.0m notional enterprise value, roughly 6.8x FY22 normalised EBIT. The deal structure was $17.5m cash, $17.5m scrip (3.525m UNI shares at $4.96, equal to 4.59% of UNI), and $15.0m of Deferred Variable Consideration payable in three tranches against FY23, FY24 and FY25 EBIT hurdles. THRILLS came with $34.6m of FY22 revenue, around 79% wholesale, and eight retail stores.
Three years later the deal thesis has not landed cleanly. CTC sales fell 9.8% to $40.1m in FY25, with a 13.8% wholesale decline. CTC gross margin compressed 330 bps to 42.9%, against the group's 61.1%, on aged-inventory markdowns. UNI booked a $13.6m goodwill impairment in H1 FY25 to recognise the gap between deal expectations and trading reality. H1 FY26 brought a partial recovery (CTC total sales +4.8%, DTC LFL +9.5%, gross margin +150 bps to 46.8%), but the brand still runs 14 to 18 margin points below the group rate.
| Item | At announcement (26 Sep 2022) | Reality (FY25) |
|---|---|---|
| Headline EV | $50.0m notional (cash free, debt free) | $13.6m impairment booked H1 FY25 |
| Implied multiple | 6.8x FY22 normalised EBIT (no synergies) | Synergies have not materialised at deal-thesis pace |
| Upfront cash | $17.5m | Funded from existing $38.8m cash reserve |
| Upfront scrip | $17.5m (3.525m UNI shares at $4.96) | 50% escrow released FY24 results, 50% FY25 results |
| Deferred Variable Consideration | $15.0m payable in 3 tranches vs FY23/24/25 EBIT | DVC payments cycled through FY23 to FY25 |
| THRILLS FY22 revenue | $34.6m (~79% wholesale) | CTC FY25 revenue $40.1m (-9.8% YoY) |
| THRILLS store count | 8 (plus 2 opening Nov 2022) | 9 at 31 Dec 2025 |
| CTC GP margin | Not separately disclosed pre-deal | 42.9% FY25 (group 61.1%), 46.8% H1 FY26 |
If you are a private DTC operator considering a brand acquisition this year, the three operator lessons are simple. Acquired brands cost real cash to integrate, almost always more than the LOI assumes. The deferred earnout structure (60% of consideration tied to EBIT hurdles) is what protects you when the deal thesis underperforms. And a brand running at lower gross margin than your platform is not cheap to fix; it took UNI more than two years just to get CTC's margin moving in the right direction. Build the integration cash plan before you sign, not after.
Lesson three: private-brand mix is the only durable gross margin lever
Group gross margin moved from about 58% in FY23 to 60.1% in FY24, 61.1% in FY25, and 62.1% in H1 FY26. That 400+ bps expansion in three years is not from rent renegotiation, supply chain optimisation, or vendor leverage. It is from private-brand mix.
Neovision (a Universal Store private label) climbed from 8% of US format sales in FY23 to 11% in FY24, 18% at H1 FY25, and 19% by H1 FY26. Perfect Stranger, also a UNI-owned brand, grew 83.1% in FY25 to $25.5m and is still adding stores (14 to 19 to 22 across FY24, FY25, H1 FY26). UNI explicitly notes that Perfect Stranger continues to attract new customers with little to no discernible cannibalisation of nearby Universal Store doors.
The economics work because private-label apparel typically runs 10 to 25 margin points higher than third-party wholesale or branded goods at retail. When you own the IP, the design, the manufacturing relationship and the channel, you do not give margin away to a brand house. UNI's group gross margin expansion is the direct read-through.
For an AU DTC operator at $3m to $30m revenue, the move is clear. Build a private label before you scale paid acquisition. Start with a single category where you have customer-feedback evidence of demand and where the third-party brand margin is the lowest. Test for 6 to 12 months at small order quantities. Scale only once the gross-margin uplift is provable at unit economics. The Perfect Stranger playbook (start small, prove the LFL, then roll the stores) is the template.
What this means for your brand if you are $3m to $50m DTC in AU or NZ
Three operator takeaways to act on in the next quarter.
Do not chase pure-DTC gross margin below 55% in apparel. UNI runs 61.1% with stores carrying part of the cost base. If your pure-online business is below 55% at the unit level, you are bleeding before paid acquisition even prints. Cut the lowest-margin SKUs, raise prices on the top-3 sellers, and rework returns before you spend another dollar on Meta.
Build a private label before you scale ad spend. Neovision is the model. One category, one season, prove the gross-margin uplift, then expand. If you cannot beat your platform's blended gross margin by 8 to 10 points in your first private-label SKU, the category is wrong or the supplier is wrong; do not scale yet.
If you are considering a brand acquisition, structure 60% of the consideration as a multi-year earnout. The THRILLS deal at 6.8x EBIT with $15m in DVC is the protection blueprint. Even with that protection UNI still booked a $13.6m impairment. Private operators acquiring sub-$10m revenue brands should anchor at 4 to 6x EBIT, never pay above 5x in cash without milestone protection, and write the integration cash plan into the LOI.
The biggest mistake AU DTC operators make benchmarking against UNI is treating 61.1% gross margin as a pure-online target. It is not. It is a store-attached number with private-brand mix baked in. Copy the private-label playbook. Copy the cash-conversion discipline. Do not copy the headline without the structure behind it.
What we are watching next
The H2 FY26 trading update (weeks 27 to 34, included in the H1 FY26 results) prints Universal Store LFL +7.1%, Perfect Stranger LFL +4.9%, and CTC online -31.7%. The CTC online decline is the most important number on the page; if it does not stabilise in the next two halves, the case for keeping the THRILLS brand inside the platform gets harder. FY26 store rollout guidance is 11 to 17 new stores (4 to 6 Universal Store, 5 to 7 Perfect Stranger, 2 to 4 THRILLS), so Perfect Stranger is still the growth engine and THRILLS is in retrenchment.
For more on AU DTC operator benchmarks, see our Australian online retail spend 2026 and DTC layoff and hiring tracker.
Sources and methodology
Every figure in this teardown is sourced from primary ASX announcements on the Universal Store investor centre. The four anchor documents are the FY25 Results released 21 August 2025 (group revenue $333.3m, gross margin 61.1%, EBIT $54.6m, NPAT $34.8m, online 13.3%, operating cash flow $98.0m, net cash $17.2m, 111 stores), the H1 FY26 Results released 19 February 2026 (H1 group sales $209.6m, gross margin 62.1%, EBIT $43.6m, NPAT $28.3m, online 12.9%, net cash $38.4m, 118 stores), the Acquisition of Thrills investor presentation dated 26 September 2022 (notional EV $50.0m, $17.5m cash plus $17.5m scrip plus $15.0m DVC, 6.8x FY22 EBIT, THRILLS FY22 revenue $34.6m), and the 2025 Annual Report for inventory ($66.4m at 30 June 2025) and CFO Ethan Orsini disclosure.
CFO Ethan Orsini is named as Group CFO in both the FY25 results announcement (21 August 2025) and the H1 FY26 results announcement (19 February 2026). Renee Jones is listed as the predecessor in some third-party databases; the exact CFO appointment-date ASX announcement was not retrieved for this teardown, so we have not stated a tenure figure.
FY21 and FY22 brand-level revenue splits in the area chart are estimates anchored on group totals. CTC consolidates from 31 October 2022, so FY23 is a partial year, and Perfect Stranger was not separately disclosed as a banner before FY23. FY24 onward is reported exactly per ASX results announcements.
Inventory days of approximately 179 is a calculated figure (not separately disclosed) using average inventory of about $63.4m divided by implied COGS of about $129.5m, times 365 days. This is consistent with apparel retail cycling stock roughly twice a year. The exact COGS line is in the 2025 Annual Report Note 4.
THRILLS' current ecommerce platform was not confirmed for this teardown. Storeleads indexes universalstore.com on Shopify Plus (7,601 SKUs, 45,367 variants, employee count 486, monthly app spend approximately US$37,498) and perfectstranger.com.au on Shopify Plus (upgraded May 2024, 2,231 SKUs, 12,785 variants, monthly app spend approximately US$32,899). The apparel THRILLS website (thrillsco.com) is not currently in Storeleads' AU Shopify index in 2026.
This teardown is editorial benchmarking commentary, not investment advice. Universal Store Holdings is not an Eightx client.
Frequently asked questions
is universal store actually a dtc business or a retail chain pretending to be one?
It is a multi-brand specialty retailer where stores drive 87% of revenue and online sits at 13.3% (FY25). The Shopify Plus stack on universalstore.com and perfectstranger.com.au is real and well-run, but online is supportive rather than primary. If you are a pure-DTC operator benchmarking against UNI, treat them as the store-attached upside case, not a peer.
what gross margin should a 10m to 50m au dtc apparel brand benchmark against?
Aim for 55% or higher at the unit-economics level before you scale ad spend. UNI runs 61.1% group gross margin with 100+ stores carrying part of the cost base. A pure-online brand without that physical footprint typically gives back 4 to 8 points to fulfilment, returns and digital marketing. Below 55% means you are bleeding before paid acquisition even prints.
why is universal store's online only 13% of sales when shopify plus brands are usually 50-80%?
Because UNI is a store-first business with online attached, not the other way around. Their target customer (16 to 35, youth fashion) still converts at higher AOV in store, returns are lower in store, and visits drive cross-brand discovery (Universal Store buyers find Perfect Stranger on the same trip). The Shopify Plus capability is there for omni-channel reach, not pure-online dominance.
what does the thrills goodwill impairment teach about acquiring brands as a private operator?
Three things. First, premium acquired brands often cost 14 to 18 margin points to integrate (CTC ran 42.9% gross margin in FY25 vs group 61.1%). Second, the deferred variable consideration earnout is the protection, not the headline EV. Third, even a public acquirer with cash on hand books a $13.6m goodwill impairment when the brand underperforms the deal thesis. Pre-built brand equity does not guarantee post-deal margin retention.
is perfect stranger's 83% sales growth realistic for a private au dtc to copy?
The 83% is on a small base, $13.9m to $25.5m, and inside an existing 80-store network that opens cheap doors. The LFL signal (+25.5% in FY25) is the realistic transfer. A private DTC running a private-label range inside an existing channel can target 20 to 30% LFL growth on the new line for two to three years if customer overlap is real and cannibalisation is low.
how much should i pay if i am acquiring a brand doing 5-10m revenue right now?
Anchor on 4 to 6x normalised EBIT, structured 40% upfront and 60% earnout against EBIT hurdles spanning two to three years. UNI paid 6.8x FY22 EBIT for THRILLS in 2022 (a frothier market) and still booked an impairment three years in. In 2026 the buyers are tighter and earnouts are longer. Never pay a multiple above 5x EBIT in cash without milestone protection.
what's universal store's secret to running ebit margin north of 16% on apparel?
Three things stacked. Private-brand mix lifts gross margin (Neovision now 19% of US format sales). Store productivity at LFL +13% in FY25 covers fixed cost with operating leverage. And tight working capital: $98m operating cash flow on $54.6m underlying EBIT is a 1.8x cash-conversion ratio, which means receivables and inventory are not eating profit.
how does uni's inventory days compare to my dtc apparel brand?
UNI carries roughly 179 days of inventory based on $66.4m inventory at 30 June 2025 against an implied $129.5m COGS. That is normal for apparel cycling stock twice a year. If your DTC brand is at 240+ days, you are over-stocked on aged SKUs and a write-down is sitting on your balance sheet. Aim for 150 to 200 days for full-price apparel.