
eCommerce
Australia Ecommerce KPI Benchmark 2026
In 2026 a healthy Australian ecommerce store hits roughly a 2% conversion rate, an average order value around A$95 to A$150, gross margin of 35% to 50% for pure-play DTC, and an LTV:CAC ratio above 3:1. Online is now 12.7% of all Australian retail, so unit economics, not channel choice, decide who survives.
Key Takeaways
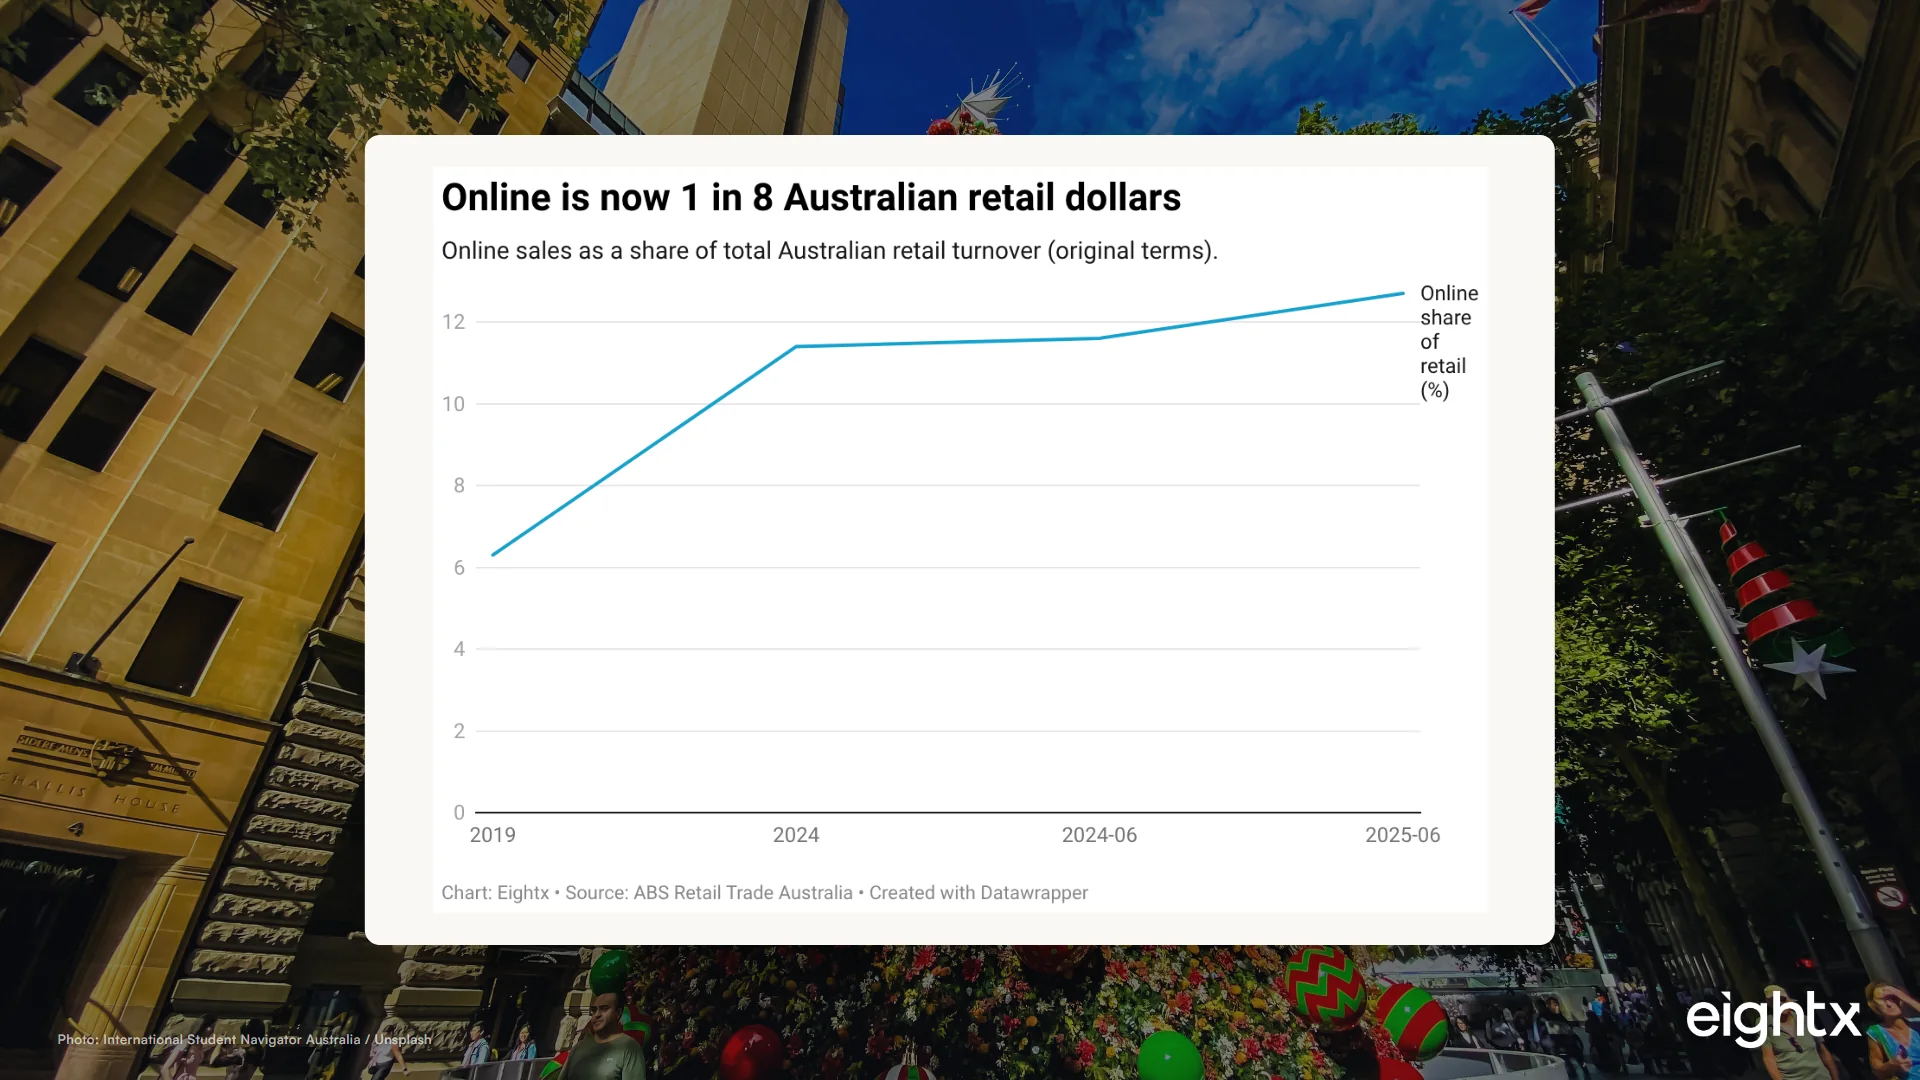
- Online is now 12.7% of total Australian retail (ABS, June 2025), up from 11.6% a year earlier and just 6.3% in 2019. The channel is mainstream, so the question is no longer online vs store. It is whether your unit economics work at the Australian cost base.
- The average online basket fell to about A$95 in FY25 (Australia Post), the lowest in a decade. Growth is coming from more orders, not bigger ones, so brands relying on AOV creep have to engineer it.
- A 2% conversion rate puts an Australian store at market. The defensible AU band is 1.5% to 2.5%, with 3%+ strong. Below 1.5% you have a funnel problem, not a traffic problem.
- Your CAC runs 20% to 35% above the US on a thinner population and a more concentrated ad auction, while wages (WPI +3.2% YoY) and freight keep climbing. That is why a US dashboard makes your P&L look broken when it is not.
- The AU market is Shopify-dominated and long-tailed: about 235,600 active stores, 153,140 on Shopify, only 3,592 on Shopify Plus. Differentiation, not scale, is the realistic edge for most operators.
If you run an Australian online store, you have almost certainly been handed a benchmark deck built on US numbers and told your store is underperforming. AOV (average order value, the average dollars per order) should be higher. CAC (customer acquisition cost, what you pay to land one new customer) should be lower. Conversion should be miles up. The problem is not your store. The problem is that you are being measured against a different country's cost base. This is the Australian KPI scoreboard for 2026, built on ABS national statistics, Australia Post and NAB ecommerce data, and an Australian store cut from Storeleads, not US figures with the labels swapped.
The macro: online is now 1 in 8 Australian retail dollars
Australian online retail just crossed a structural line. As of June 2025, online is about 12.7% of all retail turnover (ABS, original terms), up from 11.6% a year earlier and just 6.3% back in 2019. That is roughly a doubling in six years. NAB's index puts trailing-twelve-month online spend at about A$64.9bn, or about 14.6% of retail, a little higher than ABS because of methodology. Either way, online is no longer a fringe channel you can treat as upside.
That matters for how you benchmark. When a channel is 6% of retail, "are we online enough?" is a real question. When it is 12% to 15% and growing double digits, the question flips. Online retail turnover hit about A$4.70bn in June 2025, up 13.0% year over year. The channel is mainstream and still growing fast. So the operator question is no longer whether to be online. It is whether your unit economics actually work at the Australian cost base, because everyone is online now and the easy growth has been competed away.
When we work with Australian brands at the A$5M to A$30M mark, the pattern we see again and again is a founder who scaled on a US-shaped plan and is now confused about why the P&L feels tight despite top-line growth. The macro is not the problem. The macro is a tailwind. The store-level economics are where the squeeze lives.
The Australian KPI scoreboard for 2026
Here is the scoreboard. Each KPI carries a conservative band (roughly at-market) and a strong band (top-quartile-ish). Use it to find your weakest line, not to congratulate yourself on the strong ones.
| KPI | Conservative benchmark | Strong benchmark | Source |
|---|---|---|---|
| Conversion rate | 1.5%-2.0% | 2.5%-3%+ | 3P Digital / IRP Commerce 2026 |
| Average order value (basket) | ~A$95 (Australia Post FY25) | A$150+ market AOV (Salesforce AU) | Australia Post / Salesforce AU 2026 |
| Gross margin (pure-play DTC) | 35%-50% | 55%-70% (premium own-brand) | RedSearch AU public-cohort 2025 |
| LTV:CAC ratio | 3:1 | >3:1 | Industry standard (multiple) |
| Return rate | 10%-15% (overall) | under 10% (ex-fashion) | DTC benchmarks / Marketix 2026 |
| Cart abandonment | ~70% (Baymard global) | low-to-mid 60s | Baymard 2026 |
A few reads on this table. A 2% conversion rate puts you at market, so do not panic if you are there. Gross margin is the line that quietly kills AU brands: below about 35% there is rarely enough contribution left to cover local CAC, freight and returns and still leave a profit. And the A$95 basket is the consumer reality, while the A$150+ market AOV figure is real but inflated by electronics and buy-now-pay-later orders. They measure different things, so do not set your free-shipping threshold off the A$150 number.
The honest way to use this scoreboard is to circle the one KPI furthest from its strong band and fix that before touching anything else. Spreading effort across all six at once is how operators stay busy and stay flat.
Why your unit economics look worse than the US dashboards
This is the part the US deck never tells you. On our numbers, Australian CAC commonly runs 20% to 35% above comparable US levels; treat that as an Eightx operating estimate from the AU brands we work with rather than a published benchmark. The population is smaller, the ad auction is more concentrated among fewer platforms, and you are competing for the same incremental customer with less inventory to spread across. On top of that, freight over long domestic distances is expensive, and the local cost base keeps rising.
Since the start of 2022, Australian consumer prices are up about 18% (ABS CPI) and wages about 15% (ABS Wage Price Index, +3.2% year over year in Q1 2026). Your inputs, wages, freight, packaging, software, have risen faster than the average basket, which actually shrank. That is a contribution-margin squeeze in slow motion. A US dashboard does not price any of this in, so when you lay your numbers over it, your store looks broken when it is simply Australian.
When we have struggled to make a brand's plan work, the thing that almost always fixes it is the same: re-underwrite contribution margin against the real Australian cost of acquisition and freight, then decide how much you can afford to spend, in that order. The number of AU founders we meet who have a target CAC pulled straight from a US case study is the single most common avoidable mistake. A brand sitting at a A$48 blended CAC on a A$95 basket and a 42% margin has roughly A$40 of contribution before CAC, which leaves almost nothing once you add freight and returns. The US version of that same store would look fine. It is the local cost base that turns it red.
Where the growth is actually coming from
If online is growing 13% year over year but the average basket is falling, the growth has to be coming from more orders, not bigger ones. That is exactly what is happening. The average online basket fell to about A$95 in FY25, the lowest in a decade, down about 2.1% year over year, while total retail turnover climbed steadily.
| Metric | Value | Period | Source |
|---|---|---|---|
| Online retail turnover (seas. adj.) | A$4.70bn | Jun 2025 | ABS Retail Trade |
| Online share of total retail (original) | 12.7% | Jun 2025 | ABS Retail Trade |
| Online share year prior | 11.6% | Jun 2024 | ABS Retail Trade |
| Online retail growth YoY | 13.0% | Jun 2025 | ABS Retail Trade |
| Trailing-12-month online spend | A$64.88bn | Jul 2025 | NAB Online Retail Sales Index |
For an operator, the implication is concrete: if baskets are shrinking across the market, AOV growth is not going to arrive on its own. You have to engineer it. The levers that actually move it in Australia are bundles, free-shipping thresholds set just above your current AOV, and buy-now-pay-later at checkout, which lifts basket size on considered purchases. When I talk to founders running stores at this size, the ones holding margin in a falling-basket market are the ones who treat AOV as something they design, not something they hope for.
The Australian story is not weak demand. Online retail is growing double digits. The story is a margin squeeze hiding inside a growth headline: more orders, smaller baskets, a rising cost base, and a CAC that runs 20% to 35% above the US figures most AU dashboards are quietly built on. Win on contribution margin per order, not on a US conversion target.
The AU store landscape: who you're competing with
Knowing the competitive structure tells you whether scale or differentiation is the realistic edge. A Storeleads cut of active Australian stores (pulled 2026-06-11) shows a market that is Shopify-dominated and very long-tailed.
| Segment | Active stores | Source |
|---|---|---|
| All AU ecommerce stores | 235,621 | Storeleads (country=AU) |
| On Shopify | 153,140 | Storeleads |
| On WooCommerce | 82,481 | Storeleads |
| On Shopify Plus | 3,592 | Storeleads |
About 65% of active AU stores run on Shopify, and just 3,592 stores, about 1.5% of all active AU stores, are on Shopify Plus. The takeaway is not that you need to be on Plus. It is that the platform is not your moat, because two-thirds of your competitors are on the same one. With 235,600 stores fighting for a market where the average basket is shrinking, the realistic edge for most operators is differentiation, product, brand, retention, not out-spending the long tail on acquisition. You will not win a price-of-traffic war against a market this fragmented. You can win on the customer you keep.
What to do with this scoreboard
Three moves, in order. First, re-underwrite your contribution margin against the actual Australian cost base: real local CAC, real freight, real return rates, not a US template. Second, find the single KPI on the scoreboard furthest from its strong band and fix that before anything else. For most AU brands that is either gross margin or LTV:CAC, and both are fixed more by retention and pricing than by cheaper ads. Third, engineer AOV deliberately, because the market basket is falling and it will not lift itself.
If you do only one thing, make it the first one. The most expensive mistake we see in Australian ecommerce is scaling ad spend on a plan that was underwritten against US economics. The macro is genuinely on your side: 13% growth, a mainstream channel, a structural tailwind. The discipline is making sure each order is profitable at the Australian cost base before you pour money into getting more of them. If you want a second set of eyes on that re-underwrite, this is exactly the work our interim CFO team does with Australian operators.
Sources and methodology
ABS Retail Trade Australia. Monthly Australian retail turnover (current prices, seasonally adjusted) was pulled via the ABS Australia statistics interface for January 2022 through June 2025, with the latest point at A$37,906.6m for June 2025. The online proportion of total retail (12.7% at June 2025, 11.6% a year prior) is published in the ABS Retail Trade latest release; the 2019 figure of 6.3% and the 2024 figure of 11.4% come from the ABS retrospective on 75 years of retail statistics. (The two 2024 readings are not a contradiction: 11.6% is the June 2024 monthly point from the latest release, while 11.4% is the full calendar-year 2024 average from the retrospective.) Note that the ABS data interface did not expose a dedicated online-retail dataflow, so the online-share figures are drawn from the ABS publication rather than a single machine-readable series, and were cross-checked against ABS source URLs.
ABS Consumer Price Index and Wage Price Index. All Groups CPI (quarterly index) was pulled from Q1 2022 (index 86.05) through Q1 2026 (index 101.7), a cumulative rise of about 18%. The Wage Price Index (total hourly rates of pay, all industries) was pulled across the same window, with Q1 2026 up about 3.2% year over year. For the cost-squeeze chart, both series were rebased to 100 at Q1 2022 so the trends sit on a comparable scale and neither line flatlines.
NAB Online Retail Sales Index (July 2025). Trailing-twelve-month online spend of about A$64.88bn, implying roughly 14.6% of total retail, is taken from NAB's published index. The gap between the NAB share and the ABS 12.7% is a methodology difference, so 12% to 15% is treated as the defensible online-share range rather than a single point.
Australia Post, Inside Australian Online Shopping. The average online basket of about A$95 for FY25, described as the lowest in a decade and down about 2.1% year over year, is from Australia Post's annual ecommerce report. This is a consumer-basket measure and is deliberately distinguished in the post from the higher market-AOV figures (A$150+) that are inflated by electronics and buy-now-pay-later orders.
Benchmark layer (conversion, margin, returns, abandonment). Conversion bands (1.5% to 2.5% AU, about 1.9% global) come from 3P Digital and IRP Commerce. Gross-margin, return-rate and cart-abandonment bands come from RedSearch's Australian public-cohort compilation, Marketix and Baymard (70.2% global cart abandonment). These are external benchmark sources, triangulated rather than first-party, and should be read as market context, not Eightx-measured figures. The 20% to 35% AU-versus-US CAC premium cited throughout the post is an Eightx operating estimate drawn from the Australian brands we work with, not a single published figure; it reflects the smaller population, more concentrated ad auction and longer freight distances described above.
Storeleads Australian geo cut. Active-store platform counts (235,621 total; 153,140 Shopify; 82,481 WooCommerce; 3,592 Shopify Plus) were pulled from Storeleads with the country filter set to Australia on 2026-06-11. The revenue and visit fields did not return populated values in this pull, so these counts are reported as a market-structure signal only, not a revenue ranking.
Benchmarks only translate into retained profit if you clear the compliance calendar, so build your end-of-financial-year checklist for Australian ecommerce into the same planning cycle.
A benchmark only pays off when someone acts on it, which is what virtual CFO services do for a growing Australian brand.
Frequently asked questions
what is a good conversion rate for an australian ecommerce store?
About 2% is at market in Australia. The defensible benchmark band is 1.5% to 2.5%, with 3% or higher counting as strong (3P Digital, IRP Commerce 2026). If you are sitting below 1.5%, that is usually a checkout or product-page problem, not a traffic problem, and more ad spend will only make it more expensive.
what aov should australian dtc brands target in 2026?
The average online basket in Australia fell to about A$95 in FY25 (Australia Post), the lowest in a decade, so that is the realistic floor for a broad-catalogue store. Market AOV figures of A$150+ exist but are inflated by electronics and buy-now-pay-later baskets. Target a number you can defend on contribution margin, then engineer it up with bundles and free-shipping thresholds.
what is a healthy ltv to cac ratio for ecommerce in australia?
Above 3:1, same as the global standard, but it is harder to hit in Australia because CAC runs 20% to 35% above US levels. If your ratio is below 3:1, the fix is almost always repeat-purchase rate and margin, not just cheaper acquisition. We tell AU operators to underwrite to a 3:1 minimum on a 12-month LTV, not a lifetime guess.
how does australia ecommerce performance compare to the uk and us?
Conversion bands are broadly similar, but Australian CAC is structurally higher because the population is smaller and the ad auction is more concentrated, and freight is more expensive over long domestic distances. The headline numbers look like the US and UK, but the cost base underneath them does not, which is why benchmarking against a US dashboard misleads AU operators.
what gross margin do australian online retailers need to stay profitable?
Pure-play AU DTC brands typically run 35% to 50% gross margin, and premium own-brand makers reach 55% to 70%. Below about 35% there is usually not enough contribution left to cover Australian CAC, freight and returns and still leave a profit, so margin is the first thing we pressure-test before approving more spend.
what percentage of australian retail is online in 2026?
About 12.7% of total Australian retail was online as of June 2025 (ABS, original terms), up from 11.6% a year earlier and 6.3% in 2019. NAB's index implies a higher 14.6% on a different methodology, so 12% to 15% is the defensible range depending on the source.
why is my australian store's cac higher than us benchmarks?
Because the Australian market is smaller and the ad auction is more concentrated among fewer platforms, so you pay more to reach the same incremental customer, and long domestic freight distances add cost on top. AU CAC commonly runs 20% to 35% above comparable US figures, which is exactly why a US benchmark makes your numbers look broken when they are normal for the market.
what is the average cart abandonment rate for australian ecommerce?
Around 70%, in line with the global average of 70.2% (Baymard). Strong checkouts pull that into the low-to-mid 60s. Most of the recoverable loss in Australia sits in surprise shipping costs and slow delivery promises, so a clear freight threshold and an honest delivery estimate move the number more than another discount code.
Related Eightx benchmarks: AU online retail just lost its scoreboard: what 12.7% means and what to use instead and ASX DTC benchmark 2026: 10 listed brands, a 67-point gross margin gap, and where the cohort actually earns money. For hands-on help with your numbers, talk to our fractional CFO team.