
Insights
AU online retail just lost its scoreboard: what 12.7% means and what to use instead
Key Takeaways
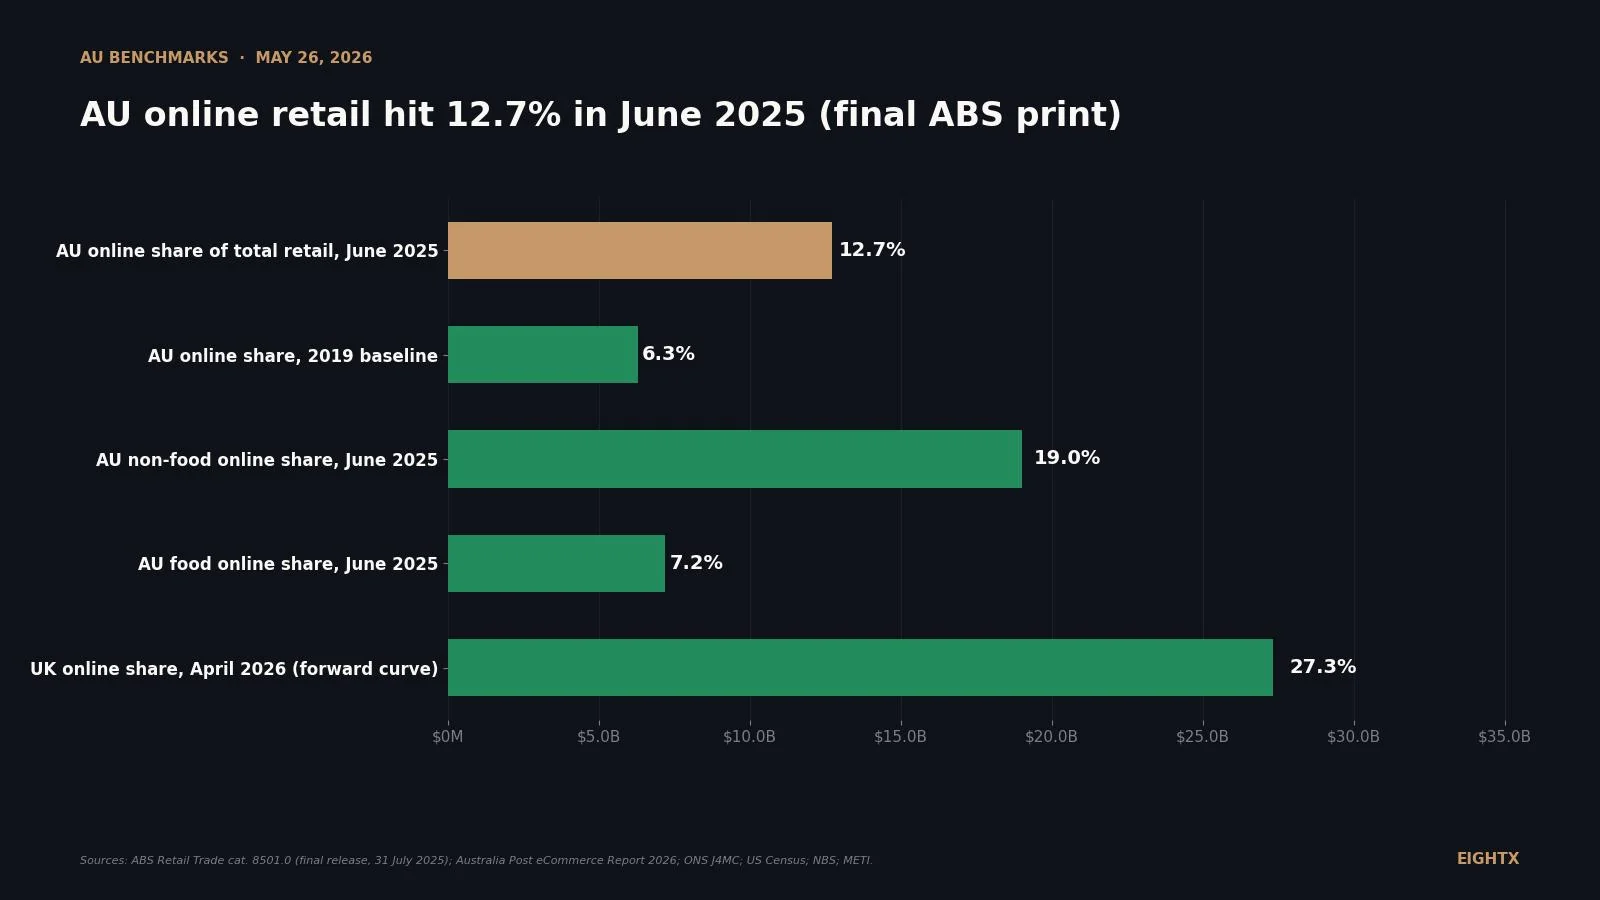
- Australia's online retail share hit 12.7% in June 2025 (ABS cat. 8501.0). That is double the 6.3% baseline from 2019. The COVID spike never normalised back down. It became the floor.
- The ABS killed the monthly 8501.0 series after the June 2025 release. AU operators just lost their primary forecasting scoreboard. Rebuild from Australia Post + NAB Online Retail Sales Index + ABS Monthly Household Spending Indicator.
- The 'ecommerce growth' story in Australia is a non-food story. Non-Food retail is 19.0% online. Food is 7.2%. If you sell apparel, electronics, beauty, or homewares your category is already pulling above the national average.
- AU at 12.7% is closer to Japan (9.8%) than to the UK (27.3%) or China (31.9%). The UK monthly J4MC series is the closest model for what AU's next four to five years look like. There is no ceiling in sight.
- Marketplaces took 23% of all AU online spend in 2025 (AUD 18.9 billion). Amazon, eBay, Temu, and Catch are the gatekeepers for nearly a quarter of demand. Forecast your direct channel and your marketplace channel separately.
Australian online retail share hit 12.7% of total retail turnover in June 2025, according to the final release of ABS cat. 8501.0 on 31 July 2025. That number matters for two reasons. First, it is roughly double the 6.3% share from 2019, which means the COVID spike never normalised back down. It became the new floor. Second, that June 2025 release was the last one. The ABS killed the monthly 8501.0 series after that print, which means every Australian ecommerce operator just lost their primary forecasting scoreboard.
This post does three things. It walks through what 12.7% actually means once you split it by category (because "online share" in Australia is really a Non-Food story). It compares Australia to the rest of the world and explains why the UK's trajectory is the cleanest model for what AU's next four to five years look like. And it lists the data sources AU operators should subscribe to now that the ABS series is gone.
The headline: 12.7% in June 2025, and the level is misleading on its own
The 12.7% June 2025 print is the highest official AU online retail share on record outside the 2020-2021 lockdown peak. It is up from 11.6% in June 2024 and up from 6.3% in 2019. So the share has roughly doubled in six years.
But the number on its own is misleading. Three things sit behind it.
The first is the COVID effect. AU online share spiked to 9.4% annual average in 2020, fell back to 10.8% in 2022 and 2023, then resumed climbing in 2024 (11.4%) and 2025 (12.7%). The post-COVID trough was about 70% above the 2019 baseline. The pandemic did not create temporary online shoppers. It created permanent ones, and the share growth has been on a structural trajectory ever since.
The second is the category split. ABS reports Food retailing and Non-Food retailing online shares separately. Non-Food online share is 19.0%. Food online share is 7.2%. The headline 12.7% is a weighted average of those two very different numbers. If your category is apparel, electronics, beauty, homewares, sporting goods, or department-store-equivalent, your part of the index is already above 19%. If you sell groceries, you are operating well below the headline.
The third is the data discontinuity. The June 2025 release was the final cat. 8501.0 print. The ABS announced earlier in 2025 that the monthly Retail Trade Australia series would be discontinued after June, replaced by lower-frequency quarterly data plus the Monthly Household Spending Indicator. AU operators who were building forecasts off the monthly online share series now have to rebuild that scoreboard from other sources.
The annual time series captures the COVID step-change plus the post-2023 resumption of growth. Note that the 2025 (Jun) point is a single monthly reading, not an annual average, so the slope into 2025 should be read as directional rather than as a strict year-on-year comparison.
Where the growth actually is: Non-Food at 19%, Food at 7.2%
The single most useful slice in the June 2025 ABS release is the Food vs Non-Food split. The two categories tell completely different stories.
Non-Food retail (apparel, footwear, electronics, household goods, recreational goods, department stores, "other" retailing) sits at 19.0% online share. That is nearly three times the Food share and well above the headline 12.7%. The drivers are familiar to anyone who has been operating in AU DTC for the last five years: apparel and footwear continue to migrate to ecommerce, electronics is structurally high-share online, beauty has accelerated post-COVID, and department stores have lost ground to specialist online competitors.
Food retail (supermarkets, grocery, liquor, specialty food) sits at 7.2% online share. That is about half the headline and it has not moved meaningfully in two years. The structural reasons are well-rehearsed: perishable supply chains, basket-economics that favour weekly bricks-and-mortar trips, and the difficulty of unit-economics on grocery delivery in a country with low population density outside the capitals. Coles and Woolworths have both invested heavily in online grocery without materially shifting the share number.
For an AU DTC operator the implication is straightforward. Do not benchmark your category against the national 12.7% number. Benchmark against the Non-Food 19.0% if you sell physical goods that are not perishable food. If your category-specific online share is below 19%, you are likely behind the curve. If you are above 25%, you are tracking with the UK rather than with AU.
Category (ABS, June 2025) Online share of total retail (%) Total retail 12.7 Non-Food retailing 19.0 Food retailing 7.2
International comparison: AU is closer to Japan than to the UK
Now layer in the international context. The chart below ranks the major economies by latest reported online retail share.
China leads at 31.9% (full-year 2025, calculated from NBS totals). The UK is next at 27.3% (April 2026, ONS series J4MC). The US sits at 16.9% (Q1 2026, Census). Germany prints at 13.4% (2024, HDE Online-Monitor). Australia is at 12.7% (June 2025, ABS). Japan at 9.8% (2024, METI) is below Australia.
The implication is that AU is closer to Japan than to the UK. The reference periods are not perfectly aligned (China and Germany are annual, the UK and US are recent monthly or quarterly), so the bar chart should be read as directional rather than as a strictly apples-to-apples comparison. But the rough ordering is stable: AU has roughly 5-10 years of potential upside if it tracks the UK with a lag, and roughly 15+ percentage points of headroom before it approaches the UK level.
The reasons for the gap are well-understood. The UK has higher population density, more mature parcel networks, and a head-start on grocery online (Tesco, Ocado). China has WeChat-and-livestream commerce baked into consumer behaviour and a digital payments infrastructure AU does not have. The US has Amazon at scale. Germany sits in a similar bracket to AU and has been stuck around 13-14% for two years. Japan is the cautionary peer: high population density, advanced retail, but online share that has stalled below 10%.
The UK as Australia's forward curve
The single most useful comparator for an AU operator forecasting beyond 2026 is the UK monthly online share series (ONS series J4MC). The UK series gives the closest thing to a "what happens next" curve for AU online retail.
Three features of the UK series are worth flagging. First, the pre-COVID baseline sat at 18-20%. AU's pre-COVID baseline was 6-7%, so AU is now roughly where the UK was in 2014. Second, the lockdown spike pushed UK share to 37.8% in January 2021, then unwound to a stable 26-28% plateau through 2022-2026. That post-COVID plateau is well above the pre-COVID level. The COVID effect was structural, not transient, in both countries. Third, the UK series shows clear seasonality: November-December peaks every year as Christmas demand pushes online share 4-5 points higher than the trailing baseline.
The forecasting implication for AU operators is that the UK is roughly a 10-year-forward proxy. If AU follows the UK with a 4-5 year lag (which has been roughly true since 2015), then AU online share at 12.7% in June 2025 maps to where the UK was around 2014-2015. UK share grew from there to 19% pre-COVID, then to 27% post-COVID. A reasonable base-case AU forecast for 2030 is 18-20% online share, with the same upward drift driven by Non-Food categories and the same Christmas-quarter seasonality once monthly data resumes.
Australia's online retail share has just doubled in six years and the ABS has simultaneously killed the scoreboard that everyone has been using to track it. The level is no longer the interesting question. The interesting questions are which category you are in (Non-Food at 19% or Food at 7%), what data you replace 8501.0 with, and how fast you expect to converge on UK-style 25%+ share.
What this means for your business if you run an AU DTC brand
Three things to do this quarter.
Rebuild your forecasting scoreboard. The monthly ABS 8501.0 series is gone, so you cannot just run the same dashboard you ran last year. The replacement data stack is: ABS Quarterly Retail Trade for total retail context, ABS Monthly Household Spending Indicator for spend-direction (not quite the same as retail but directionally correlated), Australia Post quarterly parcel data for online-spend volume, and NAB Online Retail Sales Index for monthly directional reads. None of these is a perfect substitute. Together they cover most of what 8501.0 was telling you.
Stop benchmarking against 12.7%. Almost every AU DTC operator sells Non-Food categories, which means the relevant benchmark is 19.0%, not 12.7%. If your category-level online share is below 19%, your category has not yet caught up with the AU non-food average. If it is above 25%, you are operating on UK economics and should plan your supply chain and ad-spend accordingly.
Forecast direct and marketplace separately. Marketplaces (Amazon, eBay, Temu, Catch) took 23% of all AU online spend in 2025, growing +13% YoY. Total online grew +14%. So marketplaces are growing roughly in line with the total, not pulling ahead, but they are also not losing share. If you sell on a marketplace plus direct, forecast each channel as its own line item. Treating them as one consolidated "online" number obscures the unit-economics differences that matter for capital allocation.
For more on AU benchmarks and forecasting context, see our companion analysis of the NAB Online Retail Sales Index for 2026 and our broader work on Australian DTC benchmarks.
Sources and methodology
Primary AU data: ABS Retail Trade, Australia (cat. 8501.0). The June 2025 final release was published 31 July 2025. The headline series is "online sales as a proportion of total retail turnover" in original terms. ABS announced in April 2025 that the monthly 8501.0 series would be discontinued after the June 2025 print, with future online-retail data triangulated from lower-frequency ABS Quarterly Retail Trade, ABS Monthly Household Spending Indicator, and external industry sources.
Australia Post eCommerce Report 2026. Published 2026, covers calendar year 2025. Headline: AUD 82.6 billion total online spend, +14% YoY, 9.8 million households shopping online. Companion Marketplaces report: AUD 18.9 billion in marketplace spend, +13% YoY, average basket size AUD 56.37. Methodology combines Australia Post Group parcel-deliveries data with the Australia Post eCommerce Report Survey 2025 and Australia Post Omnibus Survey (November 2025). Scope is narrower than ABS (physical-goods parcels only) but deeper on household behaviour.
UK comparison: ONS series J4MC. "Internet sales as a percentage of total retail sales (ratio) (%)". Full monthly history from January 2019 through April 2026 is captured in the third chart above. Most recent value: 27.3% (April 2026). Peak: 37.8% (January 2021 lockdown). The series is the most-cited monthly online-share dataset in the English-speaking world and serves as the closest comparator for AU.
US comparison: US Census Bureau Quarterly Retail E-Commerce Sales, Q1 2026. Release date 18 May 2026. E-commerce share 16.9% seasonally adjusted. E-commerce sales USD 326.7 billion SA, total retail USD 1,929.0 billion SA. YoY growth +9.8% with a ±1.8% confidence band.
China comparison: NBS Total Retail Sales of Consumer Goods, December 2025. Release date 20 January 2026. Online retail sales 15,972.2 billion yuan (+8.6% YoY), total retail 50,120.2 billion yuan (+3.7% YoY). The 31.9% share is a direct calculation from the two NBS totals, not a quoted NBS percentage.
Limitations. Reference periods across the international comparison are not perfectly aligned (AU is June 2025, UK April 2026, US Q1 2026, China full-year 2025, Germany 2024, Japan 2024). The chart should be read as directional rather than as a strict apples-to-apples comparison. Australia Post and ABS totals are not directly reconcilable because of scope differences (parcels-only versus business-survey turnover). ABS Food vs Non-Food is the only category split visible in the June 2025 release commentary; finer 6-category splits live in the underlying data cube but are not extracted here.
Frequently asked questions
what % of australian retail sales are actually online in 2026?
12.7% as of the June 2025 final ABS print (cat. 8501.0). That is the most recent official monthly figure and it is the highest reading on record outside the 2020-2021 lockdown peak. Australia Post's parcel-network data puts total 2025 online spend at AUD 82.6 billion, up 14% on 2024.
is the abs still publishing the monthly online retail share or did that get killed?
Killed. The ABS discontinued cat. 8501.0 after the June 2025 release on 31 July 2025. There is no more monthly online retail share series from the ABS. You now have to triangulate from the ABS Quarterly Retail Trade release, the ABS Monthly Household Spending Indicator, Australia Post parcel data, and the NAB Online Retail Sales Index.
how does australia's online retail share compare to the us and uk?
AU is well behind both. UK April 2026: 27.3% (ONS series J4MC). US Q1 2026: 16.9% (Census Bureau). China 2025 full year: 31.9% (NBS calculation). Australia at 12.7% sits closer to Japan (9.8%) than to the UK. The gap is real and it is mostly upside, not a structural ceiling.
is the covid spike still propping up the online share or is it actual structural growth?
It is structural. The 2020 spike took online share from 6.3% to 9.4% and the post-COVID trough in 2022-2023 only fell back to 10.8%. That trough was still about 70% above the 2019 baseline. From 2024 onwards the share resumed growing without any lockdown shock, hitting 11.4% in 2024 and 12.7% in June 2025.
what categories are driving the online share, is it all food delivery or something else?
Almost the opposite. Online share of Non-Food retail is 19.0%, online share of Food retail is 7.2%. The growth is happening in apparel, electronics, beauty, homewares, and department-store categories. If you sell food or grocery your online share is well below the national average. If you sell anything else, you are likely already above it.
how much did australians actually spend online in 2025?
AUD 82.6 billion according to the Australia Post eCommerce Report 2026, up 14% on 2024. Marketplaces alone accounted for AUD 18.9 billion of that (about 23%), with average basket size of AUD 56.37. About 9.8 million Australian households shopped online during the year, roughly 9 in 10 households.
should i forecast my dtc tam as a fixed share of retail or assume the share keeps growing?
Assume it keeps growing. The UK followed exactly the path AU is now on, with a 4-5 year lag. UK online share sat at 12% in 2014-2015, was at 19% pre-COVID, and is now 27.3%. A reasonable base case for AU is 18-20% online share by 2030, which is roughly AUD 40-50 billion of additional online TAM at current total retail levels.
is online retail share growth in australia going to plateau or keep climbing?
Keep climbing, but unevenly by category. Food online share has been stuck at 6-7% for two years and may be hitting a soft ceiling. Non-Food is still pulling above 19% and rising. Expect the headline number to lift another 1-2 percentage points each year through 2027, dragged up by apparel, electronics, beauty, and homewares.
what's the share of online retail spend going through marketplaces like amazon and ebay in australia?
23% in 2025 (AUD 18.9 billion of AUD 82.6 billion, per Australia Post). Amazon, eBay, Temu, and Catch are now the four largest marketplaces by spend. If you sell on a marketplace and direct, forecast each channel separately. Marketplace growth was +13% YoY in 2025, slightly below total online (+14%), but the absolute spend pool keeps expanding.