
eCommerce
Average Australian ecommerce conversion rate by vertical 2026: Temple & Webster 3.2%, Step One 4.7%, and the APAC discount you have to apply
Australia has no published conversion-rate table by vertical, but five ASX pure-plays disclose enough to triangulate. Temple and Webster reported 3.2 percent and Step One reported 4.7 percent for 2025-2026. Applying a 15 to 20 percent APAC discount to global Shopify benchmarks gives AU operators a working range of 1.5 to 4.0 percent depending on category and traffic mix.
Key Takeaways
- Temple & Webster (ASX:TPW) is the gold-standard AU disclosure: 3.2% sitewide conversion in H1 FY26, up from 3.0% in FY25. That is roughly 3.5 times the APAC-adjusted home and furniture baseline.
- Step One (ASX:STP) discloses a 4.7% conversion rate in 1H FY26, the highest published AU pure-play number. Apparel and underwear DTC, single-SKU bundle business.
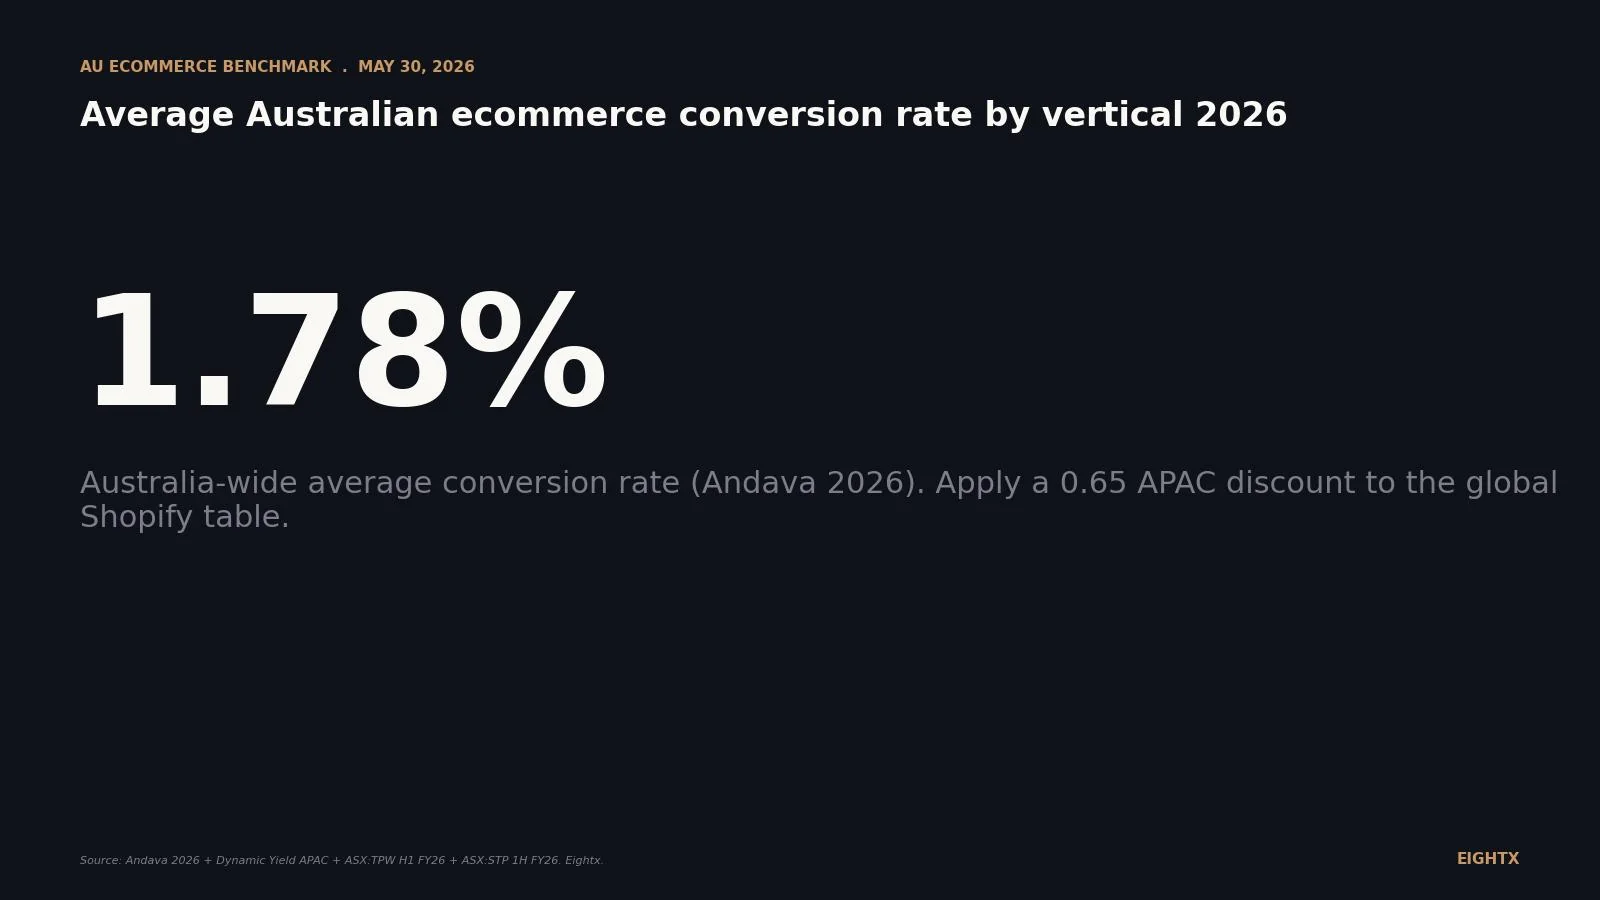
- Australia inherits the APAC discount: roughly 35% below the global all-industry average. Dynamic Yield pegs APAC at 1.7% versus global 2.69%; Andava pegs Australia-wide at 1.78%.
- Australia Post 2026 publishes the single most actionable AU finding: THE ICONIC loses 3-10% of conversion for every extra day of delivery time quoted at checkout.
- If you are an AU store running 1.5% to 2.0% sitewide on 78%-plus mobile traffic, you are not broken. You are at or above the APAC market. Above 3% is great. 4-5% is exceptional.
If you sell on Shopify in Australia and you have ever tried to answer "is my conversion rate broken or boring," you will know the answer. There is no AU-specific, vertical-by-vertical conversion-rate dataset published anywhere in 2026. Australia Post's 2026 eCommerce Report covers A$82.6B in 2025 spend (up 14% year-over-year) but does not break out session-to-order conversion by category. Power Retail's Switched On, Shopify Plus ANZ Future of Commerce, NORA, IAB Australia, and Klaviyo ANZ either keep that data behind a paywall or do not disclose it at all.
What operators actually have is a five-piece puzzle: two ASX-listed AU pure-plays that disclose their sitewide conversion rate (Temple & Webster 3.2% in homewares, Step One 4.7% in apparel), three more ASX names that disclose adjacent KPIs (Cettire, Adore Beauty, Kogan), one Australia Post quantitative finding (THE ICONIC loses 3-10% of conversion per extra day of delivery time at checkout), global vendor benchmarks (Shopify, Dynamic Yield) that need an APAC discount applied, and one Australia-wide single figure (Andava 1.78%). This post puts those five pieces together so you can stop benchmarking your store against the US Shopify table at face value.
Quick vernacular note: this post uses "virtual CFO" rather than the US "fractional CFO" because that is the AU search and conversational default. Same role, different label. We refer to "interim CFO" only where the temporary employee variant is the right description.
The headline: Australia has no published vertical conversion-rate table, and that is the whole story
Australia Post is the most authoritative voice on AU ecommerce and the 2026 report runs to dozens of pages of consumer behaviour, category share, marketplace penetration, and delivery economics. What it does not publish is a sitewide-conversion-rate-by-vertical table. None of the other usual AU sources do either. Power Retail Switched On gates it behind a paid subscription. Shopify Plus ANZ keeps it internal to their merchant base. NORA and IAB Australia do not publish it. Klaviyo's ANZ benchmark report covers email open and click rates, not site conversion.
The directional answer for any AU operator is therefore a layered build: take the global Shopify vertical benchmark for your category, apply an APAC discount of roughly 35% (factor 0.65), then cross-check against the disclosed AU pure-play in your vertical if one exists. The two pure-plays that publish a sitewide conversion rate (Temple & Webster in homewares, Step One in apparel) both run materially above the APAC-adjusted baseline, which tells you the AU category-leader ceiling is meaningfully higher than the average. Whether that matters for your store depends on how close you are to category-leader status on brand recognition, AOV, and repeat-order share.
The chart shows the gap. The two AU pure-plays that disclose a rate are not running average funnels. They are running category-leader funnels in markets with weak brick-and-mortar competition (homewares) or strong single-brand recognition (apparel underwear).
What the ASX pure-plays actually disclose: TPW 3.2%, STP 4.7%, and three more telling silences
The five ASX-listed AU DTC pure-plays each report differently on conversion. Temple & Webster (TPW) and Step One (STP) publish a number. Cettire, Adore Beauty, and Kogan do not.
Temple & Webster (ASX:TPW), homewares and furniture, H1 FY26: 3.2%. From the half-year results and trading update lodged on the ASX on 12 February 2026: "Conversion rate grew to 3.2%, demonstrating a continued positive trend." That is up from 3.0% in FY25, which itself was 5% higher year-over-year per the FY25 annual report lodged 14 August 2025. Active customers at FY25 were 1.3 million, revenue A$601 million, and the company's AU furniture and homewares market share was 2.7%. TPW is operating at roughly 3.5 times the APAC-adjusted home and furniture baseline of 0.9%. Homewares converts better in Australia than globally, likely because the AU brick-and-mortar furniture alternative is weaker than the US equivalent.
Step One (ASX:STP), apparel and underwear, 1H FY26: 4.7%. From the 1H FY26 investor materials cited via Alphaspread: "a stable order mix and a strong 4.7% conversion rate." That is the highest disclosed AU pure-play conversion rate in this dataset. Step One is a single-SKU bundle-driven business with strong brand recognition (Hugh Jackman is the celebrity endorser, paired with late-night TV advertising) and a high repeat-purchase rate. At 4.7% they run about 50% above the global Shopify apparel benchmark of 3.06% and about 2.4 times above the APAC-adjusted apparel baseline of 2.0%.
Cettire (ASX:CTT), luxury fashion, FY25: no numeric rate disclosed. From the FY25 results presentation: management "prioritised traffic quality (conversion) over traffic volume." Cettire instead disclosed 657,000 active customers (down 5% year-over-year), 68% of gross revenue from repeat customers (up from 61% in FY24), AOV A$820 (up 3%), and sales revenue A$742.1 million. Luxury globally caps conversion under 1% (Shopify benchmark 0.94%). Cettire leans on AOV times repeat economics rather than session-to-order.
Adore Beauty (ASX:ABY), beauty: a 12.1% number that is not what it looks like. ABY's FY25 results presentation disclosed an "average conversion per customer visit of 12.1%" but this is the new in-store retail concept, not online session-to-order. ABY's online conversion was separately reported at 0.75% versus 1.01% prior corresponding period in Power Retail commentary. Two different metrics that should not be quoted side by side. The online figure is the AU online-beauty data point and it sits materially below the global beauty Shopify benchmark of 4.94%. Treat the 12.1% as physical-store performance only.
Kogan (ASX:KGN), multi-brand retail, FY25: no headline conversion rate. Kogan instead disclosed active customers 3.5 million (up 35.1%), more than 50% of orders from prior-12-month repeat customers, and platform sales A$107.9 million (up 20.5%). Multi-brand retail would normally benchmark at the Shopify 3.93% baseline, APAC-adjusted to about 2.6%.
Brand Ticker Vertical Reporting period Metric disclosed Value Temple & Webster ASX:TPW Homewares & furniture H1 FY26 Sitewide conversion rate 3.2% Temple & Webster ASX:TPW Homewares & furniture FY25 Sitewide conversion rate 3.0% (+5% YoY) Step One ASX:STP Apparel / underwear 1H FY26 Sitewide conversion rate 4.7% Cettire ASX:CTT Luxury fashion FY25 Strategy language "Quality over volume" Cettire ASX:CTT Luxury fashion FY25 Repeat-revenue share 68% (vs 61% FY24) Adore Beauty ASX:ABY Beauty (in-store) FY25 In-store conversion per visit 12.1% Adore Beauty ASX:ABY Beauty (online) Recent PCP Online conversion rate (PR commentary) 0.75% (vs 1.01% PCP) Kogan ASX:KGN Multi-brand retail FY25 Prior-12-month repeat share >50%
How to read the global Shopify table from Australia: the APAC discount and how to apply it
Dynamic Yield's 12-month rolling global benchmarks put global all-industry ecommerce conversion at 2.69% and APAC all-industry at 1.7%. That is a 35-37% discount on the global figure. Andava's 2026 AU-wide ecommerce conversion figure of 1.78% lands inside the same band. The cleanest way to read the Shopify global vertical table from an AU operator's chair is to apply a 0.65 factor to every category line, then treat the result as a directional baseline rather than a hard target.
Vertical Global Shopify 2026 APAC-adjusted (x 0.65) Disclosed AU Food & beverage 6.22% 4.04% n/d (no AU pure-play) Beauty & personal care 4.94% 3.21% 0.75% (ABY online via PR) Multi-brand retail 3.93% 2.55% n/d Pet care & veterinary 3.28% 2.13% n/d Fashion, accessories & apparel 3.06% 1.99% 4.7% (STP 1H FY26) Consumer goods 2.85% 1.85% n/d Home & furniture 1.41% 0.92% 3.2% (TPW H1 FY26) Luxury & jewelry 0.94% 0.61% n/d (CTT does not disclose) Sitewide AU average (all-industry) n/a n/a 1.78% (Andava 2026)
A small caveat on Andava. Their 2026 AU vertical table also publishes a food and beverage figure (6.26%), arts and crafts (5.2%), and home and furniture (4.94%) that tracks the global Shopify table almost line for line. We have not been able to verify those AU-labelled figures against Australia Post or Power Retail primary sources. We treat Andava's 1.78% AU-wide figure as the cleanest published baseline and flag the AU vertical breakouts as Andava-reported pending corroboration.
The cascade is visible: global Shopify median 1.4%, APAC 1.7%, Australia-wide 1.78%, global all-industry 2.69%. The two disclosed AU pure-plays at 3.2% and 4.7% are the upside exceptions, not the rule.
The Australia Post finding that beats any benchmark: every extra day of delivery costs 3-10% of conversion
The single most actionable conversion finding in any AU 2026 source is buried in Australia Post's 7-point eCommerce Report action plan. THE ICONIC, AusPost's named case study, loses 3-10% of conversion for every additional day of delivery time quoted at checkout. AusPost also notes that 70% of shoppers say poor delivery communication at checkout reduces their likelihood of purchase.
That finding is more useful to most AU operators than the entire global Shopify vertical table because it is testable in your own checkout this week. If your default delivery ETA shows "5-8 business days" and you can shrink that to "3-5 business days" via a 3PL re-jig or a faster carrier on the AU east coast lane, you should expect a measurable conversion lift on volume customers who reach checkout. On a 1.78% sitewide rate with 78% mobile traffic share, even a 1-day improvement in quoted ETA translates to a 3-10% relative lift, which is 5-18 basis points of sitewide conversion. That is bigger than most A/B tests will move in a quarter.
The mobile mix matters here because AU shoppers are even more delivery-time impatient on mobile than on desktop. APAC has the highest cart abandonment rate of any major region at 80.5% versus 73.99% in the Americas and 80.17% in EMEA, per Dynamic Yield. Baymard's meta-analysis pegs global cart abandonment at 70.22% across 50 studies. AU operators sit at the top of the cart abandonment leaderboard, so the checkout funnel is the highest-impact lever before any traffic work.
The operator playbook: five levers that actually move the AU number
These are the levers we work through with AU virtual CFO clients in the first 30 days when conversion is the named problem. We are intentionally not listing "improve product photography" or "fix the search bar." Those are real but they are not where the AU-specific gap lives.
Cut your checkout delivery ETA. AusPost's 3-10% per day finding is the highest-impact AU-specific lever in this list. Quote the fastest credible ETA on the cart page, not the slowest. If you are on a single carrier, get a quote from one competitor on east coast lane and use it to negotiate.
Put Afterpay, Klarna, and Zip above the pay-now CTA at checkout. BNPL placement at or above the pay-now button is table stakes for AU DTC in 2026; Afterpay, Klarna, and Zip penetration on AU Shopify is widespread. If you are an AU brand without BNPL at checkout you are missing the highest-volume payment preference for younger AU shoppers and your conversion rate is reflecting it. See the AU Shopify landscape post for the full BNPL penetration data.
Set your free-shipping threshold at median basket times 1.3-1.4. AU operators we work with use thresholds at A$45, A$49, A$60, A$100, and A$160 depending on AOV. The discipline is: median basket plus 30-40%, not a number you saw on a competitor. Flash "today only" free-shipping promos move short-term conversion 15-25% on known-converting cohorts.
Audit mobile checkout speed on a real telco mobile network. AU mobile traffic share is around 78%, and the Sydney CBD wi-fi reality you test on is not what your customer sees in regional Queensland. Use a throttled 3G or 4G network simulation and time every step of your checkout. Anything above 3 seconds on the cart-to-checkout transition is bleeding conversion.
Track reach-checkout rate weekly, not sitewide conversion. Reach-checkout (the share of cart additions that reach the checkout step) in the 30-50% band is one of the highest-impact diagnostics on a low-converting AU store. Sitewide conversion moves slowly and noisily. Reach-checkout moves fast and tells you whether the cart-to-checkout transition is the problem or whether you have a traffic-quality issue upstream.
Above 3% sitewide is great. 4-5% is exceptional. Below 1.5% on heavy mobile is the AU market average, not a broken funnel. The two AU pure-plays that disclose a rate (TPW 3.2%, STP 4.7%) are the ceiling, not the median, and they earned the rate through brand consolidation, single-SKU bundle economics, and category-leader trust. If you are not those, your job is to find the lever that closes the APAC gap, not the lever that closes the gap to a category leader.
For more on how the AU Shopify market actually distributes, our Storeleads census of 152,323 AU Shopify stores is the denominator. The ASX DTC benchmark post cross-references the five pure-plays referenced above on revenue, margin, and active customer trajectories. For US versus AU funnel framing, see the AU versus US ecommerce finance comparison and the global sibling average conversion rate by ecommerce vertical.
Sources and methodology
Primary AU disclosures. Temple & Webster's H1 FY26 conversion rate of 3.2% comes directly from the company's half-year results and trading update lodged on the ASX on 12 February 2026. The FY25 baseline of 3.0% comes from the FY25 annual report lodged on 14 August 2025. Step One's 1H FY26 rate of 4.7% is sourced from Alphaspread's syndication of the company's 1HFY26 investor materials. Cettire's FY25 strategy language is from the company's results presentation and trading update lodged on 29 August 2025. Adore Beauty's 12.1% in-store conversion figure is from the company's FY25 results presentation; the 0.75% online figure is from Power Retail commentary covering recent ABY trading. Kogan's FY25 disclosures are from the company's FY25 annual report.
Australia Post 2026 eCommerce Report. The A$82.6 billion 2025 spend figure, the 14% year-over-year growth, and the 7-point action plan including THE ICONIC's 3-10% conversion per delivery day finding are all from Australia Post's 2026 eCommerce Report and its companion 7-point action plan PDF. Australia Post does not publish a vertical conversion rate breakout.
Vendor benchmarks. The Shopify 2026 Ecommerce Conversion Rate Guide provides the eight-vertical global table. Dynamic Yield's 12-month rolling global benchmarks provide the regional cuts (APAC 1.7%, global all-industry 2.69%, cart abandonment by region). Andava's 2026 Australia digital marketing statistics provides the 1.78% Australia-wide figure. Baymard Institute's meta-analysis of 50 studies provides the 70.22% global cart abandonment baseline. Contentsquare's 2026 Digital Experience Benchmark for retail is referenced for the global retail -5.5% year-over-year direction but its ANZ regional breakouts are gated.
Storeleads market sizing. The active AU Shopify base figure of 152,323 stores (3,653 of those on Plus, or 2.4%) is from a Storeleads MCP query (country=AU, platform=shopify, state=Active) accessed 2026-05-30.
Operator-voice triangulation. Six themes were synthesised from Eightx's 5,400-plus founder-call segment library (Pinecone, namespace anonymised) covering AU conversion, Shopify benchmark, and mobile-checkout queries. The operator calibration in the playbook section (above 3% great, 4-5% exceptional, below 1.5% mobile-heavy is market average) is based on those segments and a Perplexity sonar-pro confirmation that no AU-specific public vertical conversion-rate dataset exists in 2026 from Power Retail, Shopify Plus ANZ, NORA, IAB Australia, or Klaviyo ANZ.
Limitations. The APAC discount factor of 0.65 is the midpoint of a credible range (0.55 to 0.75) and is derived from Dynamic Yield's APAC 1.7% divided by global 2.69%. We have seen published APAC conversion-rate figures cited as low as 0.5% and as high as 2.0% across vendor reports without a single agreed authority; Dynamic Yield's 1.7% and Andava's 1.78% AU-wide are the two we treat as load-bearing. Andava's AU vertical breakouts mirror the global Shopify table closely enough that we treat them as Andava-reported pending verification against Australia Post or Power Retail. Adore Beauty's 0.75% online figure is a Power Retail secondary citation, not a primary annual-report disclosure. Of the five ASX-listed AU DTC pure-plays, only Temple & Webster and Step One publish an audited sitewide conversion rate; Cettire, Adore Beauty online, and Kogan do not.
Update cadence. This is a living index post. We refresh on each TPW, STP, Cettire, Adore Beauty, and Kogan results release. Next planned refresh trigger is TPW's FY26 full-year results in August 2026.
Frequently asked questions
what's the average ecommerce conversion rate for australian stores in 2026?
Andava puts the Australia-wide average at 1.78%. Dynamic Yield puts APAC at 1.7%. Both are the cleanest single-figure baselines published in 2026. If you are a Shopify store on or near that number you are an average AU operator, not a broken one.
is the shopify global benchmark a fair number for an au shopify store?
No, not at face value. The global Shopify table runs at the global 2.69% average; AU sits at roughly 1.78% (Andava) or 1.7% (Dynamic Yield APAC). Apply an APAC discount of about 35% (factor 0.65) to the Shopify vertical you sell into before treating any number as your target.
what conversion rate does temple & webster actually disclose?
3.2% sitewide in H1 FY26, up from 3.0% in FY25. That is in their February 2026 ASX half-year results and trading update. It is the only audited 2026 AU pure-play conversion rate disclosure in a homewares or furniture vertical.
why does cettire say it prioritises conversion over traffic but not publish a rate?
Cettire trades luxury, which globally caps conversion under 1% (Shopify benchmark 0.94%). They lean on AOV (A$820, up 3% in FY25) and repeat-revenue share (68% in FY25 versus 61% in FY24). Disclosing a low single-digit conversion rate against a luxury benchmark would not help the equity story, so they describe the strategy instead of the rate.
is a 1.5% sitewide conversion rate broken if i'm 80% mobile in australia?
No. AU mobile average is 1.8% (Andava), APAC all-industry is 1.7%, and global Shopify median is 1.4%. A 1.5% sitewide rate on a heavily mobile AU traffic mix is at or just above the market. Fix the reach-checkout rate before you fix the funnel design.
how much does delivery speed actually move conversion for au fashion brands?
Australia Post 2026 reports that THE ICONIC loses 3-10% of conversion for every extra day of delivery time quoted at checkout. AU is mobile-heavy and impatient. Faster ETA at the checkout label is one of the highest-impact AU-specific levers.
what's the difference between adore beauty's 12.1% in-store number and their online conversion rate?
The 12.1% is the new Adore Beauty physical-retail concept, measured as conversion per customer visit to a store. It is not online session-to-order. Online conversion for ABY has been reported at 0.75% (Power Retail commentary) versus 1.01% prior corresponding period. Two different metrics that should not be quoted side by side.
how do i benchmark my conversion rate if there's no published au vertical table?
Three steps. One, take the Shopify global vertical figure for your category and multiply by 0.65 to APAC-adjust it. Two, compare against the disclosed AU pure-play if your category has one (TPW 3.2% homewares, STP 4.7% apparel). Three, check Andava's 1.78% AU-wide as a floor. Anything between the APAC-adjusted baseline and the disclosed AU pure-play is normal.