
Insights
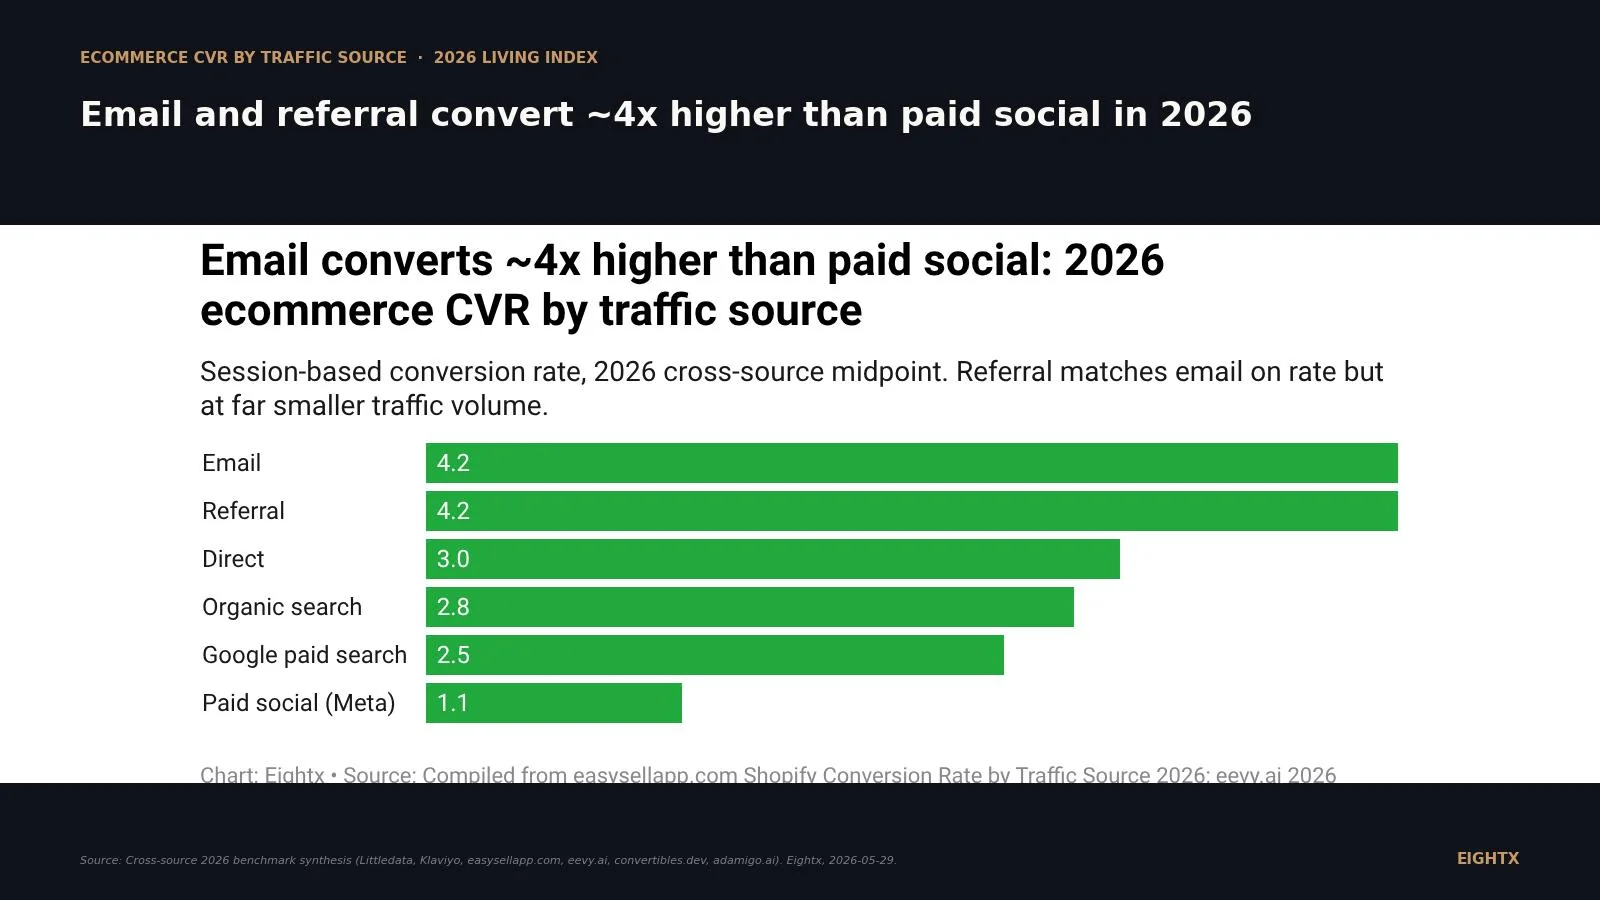
Average ecommerce conversion rate by traffic source (2026): email 4.2%, organic 2.8%, paid social 1.1%
Email converts at 4.2%, organic at 2.8%, paid social at 1.1%. These are not surprises, but most operators under-invest in the channel with the highest conversion and over-index on the channel that looks biggest in the attribution report. If email is below 30% of your revenue, you are leaving compounding returns on the table while paying Meta for the same customers.
Key Takeaways
- Email and referral are tied at the top at ~4.2% session-based CVR in 2026, roughly 3x the Shopify-wide blended average of 1.4% (Littledata, Statista Q1 2026). Referral matches the rate but at a fraction of the traffic volume.
- Organic search converts at 2.7-2.8%, Google paid search at 2.0-3.0%, Meta paid social at 1.0-1.5% on cold traffic. The full session-CVR hierarchy is locked in 2026 cross-source data. Your blended CVR is the weighted average of these channels, not a target in itself.
- The Shopify-wide blended is 1.4%; top 20% sits at 3.2%+ (Littledata). Anything above the platform median already puts you ahead of half the merchant base, but the operative number is your per-channel floor, not the blended.
- Klaviyo flows convert 25-150x higher than campaign blasts per send. Welcome series 3-5%, abandoned cart average 3.3% (top performers 7.7%), post-purchase 1-2%, automation blended 1.23%. Campaign blasts: 0.05%. That's a 25x gap on the all-flows-blended floor and 150x on the abandoned-cart top-performer ceiling. Calling email one channel is the single biggest CVR mismeasurement operators make.
- US ecommerce hit $326.7B in Q1 2026, +9.75% YoY (FRED ECOMSA). Aggregate demand is growing roughly 10% but the IRP Commerce blended CVR slipped from 1.81% to 1.70% YoY in April. More volume, the same conversion gravity. Channel mix is doing more of the work in 2026 than it did in 2024.
Most operators read a single blended conversion rate (CVR) off their dashboard and use it to grade every channel. That's how a 1.1% Meta CVR becomes "broken paid social" and a 4.2% email CVR becomes "we should send more emails." Both reads are wrong. The 2026 cross-source benchmarks are now tight enough to lock the channel hierarchy: email and referral convert highest (~4.2%), direct sits at 3.0%, organic search and Google paid search land in the middle (2.0-2.8%), and Meta paid social converts at roughly 1.1% on cold traffic. Shopify-wide blended is 1.4% (Littledata). Statista's Q1 2026 global ecommerce CVR is also 1.4% on a visit-CVR basis. Two independent samples land in the same neighborhood, though the metric definitions differ slightly.
The operator decision this post points to is not "pour more into the highest-converting channel." It's "stop measuring acquisition channels against retention channels, and start setting source-specific CVR floors for your CRO program." This is a living index. We refresh it quarterly as Klaviyo, Littledata, easysellapp, eevy, and the FRED ECOMSA macro series update their cuts.
The 2026 average ecommerce conversion rate by traffic source
The cross-source channel hierarchy for 2026 ranks like this, midpoint first: email 4.2%, referral 4.2%, direct 3.0%, organic search 2.7-2.8%, Google paid search 2.5%, Meta paid social 1.1%. Email and referral tie at the top on rate but referral has a fraction of email's traffic volume (typically 2-5% of sessions vs email's 10-20%), so the channel economics differ even when the per-session conversion math looks identical.
The number to anchor on for context is Littledata's Shopify-wide blended of 1.4%. That figure is the platform-wide average across the entire Shopify merchant base. Anything above 3.2% blended puts you in the top 20% of Shopify stores. The Statista Q1 2026 global ecommerce blended CVR is also 1.4%. Two completely different samples (Shopify-only merchants vs global ecommerce visit-tracking) landing on the same blended number is unusual, and it's the strongest sign yet that the blended-average glide path is structurally flat at 1.4% in 2026 even as channel-mix shifts beneath it.
Traffic source Midpoint CVR (%) Typical range (%) Relative to paid social Email 4.2 4.0 to 5.3 ~4x higher Referral 4.2 2.9 to 5.4 ~4x higher Direct 3.0 2.2 to 3.8 ~3x higher Organic search 2.8 2.1 to 4.0 ~2.5x higher Google paid search 2.5 1.4 to 3.2 ~2x higher Paid social (Meta) 1.1 0.5 to 2.1 Baseline Shopify platform blended (Littledata) 1.4 n/a n/a Global ecommerce blended (Statista Q1 2026) 1.4 n/a n/a
Why the channel hierarchy looks the way it does
Three structural reasons the 2026 channel ranking lands where it does, and why that order is unlikely to flip in the next 18 months.
Email and referral self-select for intent. A person on your email list opted in. A referral visitor was sent by someone they trust. Both arrive with a layer of warm-up already done. The site doesn't have to prove credibility before it can sell. That's the structural reason email and referral run at 4%+ CVR while paid social (which interrupts a cold scroll) runs at 1.1%. It's not creative quality. It's traffic quality.
Organic search captures problem-aware demand. Someone Googling "best running shoes for plantar fasciitis" has already identified their problem and is shopping for the solution. That's mid-to-bottom funnel intent. Organic CVR at 2.7-2.8% sits in the middle of the channel hierarchy because the visitor is warmer than paid social but cooler than email or direct.
Paid social is interruption traffic. Meta CVR runs at 1.1% on cold traffic because the channel's job is discovery, not conversion. A scroller's default state is "next reel." Even with strong creative and a tight offer, you're recruiting attention from a deeply distracted audience. Industry variance is enormous: adamigo.ai's 2026 Meta breakdown shows 14.29% in Fitness on the high end and 0.37% in Hardware/Automotive on the low. The 1.1% blended is what falls out when you average across all of that.
The macro context underneath: IRP Commerce reported the average ecommerce blended CVR dropped from 1.81% in April 2025 to 1.70% in April 2026 (a 5.89% YoY decline), even as US ecommerce GMV grew 9.75% YoY. More volume, the same conversion gravity. That gap means channel mix is doing more of the work in 2026 than it did in 2024.
The range matters more than the average
A single midpoint number hides where the operator decisions actually sit. Paid social ranges from 0.5% to 2.1% in 2026, a 4x spread. Email ranges 4.0% to 5.3%, just 1.3x. That gap shape matters: a Meta account at 1.5% is doing better than the channel average; an email program at 4.0% is at the floor of its range. The same "we hit the benchmark" language hides two different operating realities.
The honest read for a $5M to $50M Shopify operator: anyone giving you a "good Meta CVR is X" number without a range attached is overselling. Use Littledata's 1.4% blended / 3.2% top-quintile as the calibration anchor and use the per-channel range as the operating signal. Channels at the bottom of their own range are CRO targets. Channels at the top of their own range are budget-allocation candidates.
Email is two different channels, and Klaviyo proves it
The single biggest CVR mismeasurement operators make in 2026 is treating email as one channel. It isn't. Klaviyo's own 2026 benchmark data splits cleanly into two stories: flows (triggered, behavioral, automated) and campaigns (scheduled blasts to the list). Per send, the flow story converts 25 to 150 times higher than the campaign story (25x at the all-flows-blended floor, 150x at the abandoned-cart top-performer ceiling).
Welcome series flows convert at 3-5% placed-order rate. Abandoned cart flows average 3.3% with top performers hitting 7.7%. Post-purchase flows land at 1-2%. The blended automation flow rate across all flow types is 1.23%. Campaign blasts: 0.05%. That's not a typo. The per-send placed-order rate on a one-time campaign blast is roughly 25 times lower than the all-flows blended average and 150 times lower than the abandoned cart top performer.
Email mechanic Placed-order rate (avg) Top performers Notes Abandoned cart flow 3.3% 7.7% Single highest-converting flow type Welcome series 3-5% n/a Strongest at first touch with a clear offer Post-purchase flow 1-2% n/a Often miscategorized as a retention channel Automation flow (all flows blended) 1.23% n/a Klaviyo aggregate across all flow types Campaign blast (one-time send) 0.05% n/a ~25x lower than flow average Email click rate (engagement, not CVR) 1.69% 5.58% Klaviyo industry benchmark range
The implication: your "email CVR" is roughly the weighted average of your flow rate and your campaign rate, weighted by send volume. Operators who fix this measurement gap usually discover their campaign-heavy program is dragging the channel average down. On a 2025 retention call with a beauty brand on Shopify, the operator was reporting a single "email CVR" number; once we split flows from campaigns, the flow rate was running several times the campaign rate, and campaigns were sending the bulk of the volume. The fix was not "send more email." It was "stop reporting flows and campaigns under one heading."
What this changes about your CRO program and your CAC math
Three actions for this week.
Set channel-specific CVR floors in GA4 and review monthly. Email floor 4%, organic 2.5%, Google paid search 2%, Meta paid social 1%. Channels under floor get the next CRO sprint. Channels at floor hold. The biggest CRO ROI for a $10M Shopify brand usually sits in lifting paid-search CVR from 1.4% to 2.5% (closing the Littledata top-quintile gap), not in lifting blended. Blended is a derived number; per-channel is the operating number.
Stop comparing your blended to a peer's blended without comparing mix. A brand running 70% paid social will have a structurally lower blended than a brand running 70% email and organic, even if both are operating at the top of their respective channel benchmarks. On a 2024 founder call with a wellness operator, the diagnostic ran like this: the blended was sitting below the Shopify-wide average, but paid social was the majority of sessions. That's not a CRO problem, that's a channel mix problem. The fix path was different (push organic and email higher to dilute the paid-social drag) and the timeline was different (90 days, not a sprint).
Split flows from campaigns in your email reporting. This is the single largest data-quality lift available in 2026 email. If you have one "Klaviyo CVR" number on your dashboard, you don't have a useful number. Add two lines: flow placed-order rate and campaign placed-order rate. The minute you do, your real email economics surface and the budget-allocation conversation gets easier.
Stop using blended CVR as a target. The 2026 number to lock is your per-channel floor: email 4%+, organic 2.5%+, Google paid search 2%+, Meta paid social 1%+. Blended is a derived number that hides channel-mix shifts underneath. Per-channel is the operating number that maps to where your next CRO dollar should land.
For more on how channel-level conversion math interacts with vertical-specific benchmarks, see our average ecommerce cart abandonment rate by vertical (2026) and our average ecommerce ROAS by vertical (2026).
Sources and methodology
Klaviyo 2026 Email Marketing Benchmarks by Industry. URL: https://www.klaviyo.com/products/email-marketing/benchmarks. Klaviyo publishes industry-segmented benchmark data for open rate, click rate, and placed-order rate across both campaigns and flows. The "placed-order rate" is Klaviyo's term for the percentage of emails sent that result in an order placed within an attribution window. It is not the same metric as session-based CVR (which is orders divided by sessions). Both metrics appear in this post and are labeled accordingly in chart and table captions.
Littledata Shopify Conversion Rate Benchmark Database. URL: https://www.littledata.io/ecommerce-conversion-rate. Littledata aggregates Shopify CVR data across its analytics customer base. The 1.4% Shopify-wide blended and 3.2% top-quintile threshold are the two most-cited Shopify CVR figures in 2026 syntheses. Sample is Shopify-only; results may not generalize to BigCommerce, WooCommerce, or custom platforms.
Cross-source 2026 syntheses (easysellapp.com, eevy.ai, convertibles.dev, adamigo.ai). URLs: easysellapp.com/blogs/wiki/shopify-conversion-rate-by-traffic-source-2026; eevy.ai 2026 Shopify benchmark synthesis; convertibles.dev 2026 ecommerce CVR by industry; adamigo.ai Meta Ads benchmarks 2026. These aggregators each compile from different underlying samples (Shopify partner data, GA4 industry cuts, Meta Ads Manager reports). Cross-source convergence on the email-4.2% / organic-2.8% / Meta-1.1% hierarchy is the validation method, not single-source authority.
Statista Global Q1 2026 online shopping conversion rate. Reported as 1.4% for visits to ecommerce websites worldwide that converted to purchases in Q1 2026. Sample is global ecommerce (not Shopify-specific) and is reported as visit-CVR rather than session-CVR; cross-comparable but not identical to the Shopify-specific Littledata figure.
IRP Commerce monthly retail CVR. Reported the average ecommerce CVR dropped from 1.81% in April 2025 to 1.70% in April 2026 (a 5.89% YoY decline). IRP's sample is UK-focused and skews to fashion / apparel, so the absolute number is not directly comparable to the US Shopify-blended; the directional read (blended CVR structurally compressing in 2026 even as GMV grows) is consistent with US data.
FRED ECOMSA and ECOMPCTSA. URL: https://fred.stlouisfed.org/series/ECOMSA. US Census Bureau quarterly ecommerce retail sales, seasonally adjusted, republished on FRED. Q1 2026 = $326.7B (up 9.75% YoY from $297.7B in Q1 2025). ECOMPCTSA reports the ecommerce share of total retail sales at 16.9% in Q1 2026. Used here for macro-demand context only; not combined with CVR axes (scale differs by orders of magnitude).
Limitations. CVR definitions are inconsistent across sources. Session-based CVR (Shopify, GA4, Littledata), placed-order rate (Klaviyo), checkout completion rate (some CRO tools), and visitor CVR (older Statista cuts) are not directly comparable. This post defaults to session-based CVR throughout, with Klaviyo placed-order rate explicitly labeled in Section 4. No primary-source 2026 dataset publishes a public channel-by-channel CVR table. The 2026 figures come from third-party aggregators (Littledata, easysellapp, eevy, convertibles, IRP, adamigo) that each aggregate a different sample. GA4 "industry benchmarks" are not a published Google product. Anything labeled "GA4 benchmark" without an aggregator name is unverifiable. Meta paid social variance by industry is huge (0.37% Hardware/Automotive vs 14.29% Fitness per adamigo.ai); the 1.1% is a Shopify-blended midpoint and vertical floors differ wildly.
Update cadence. This index is refreshed quarterly. Next refresh target: 2026-08-29 (after Q2 2026 FRED ECOMSA release in mid-August and after Klaviyo's summer benchmark update).
Frequently asked questions
what's the average ecommerce conversion rate by traffic source in 2026?
Session-based midpoints in 2026: email 4.2%, referral 4.2%, direct 3.0%, organic search 2.7-2.8%, Google paid search 2.0-3.0%, Meta paid social 0.5-2.1% on cold traffic (1.1% midpoint). The Shopify-wide blended average is 1.4% (Littledata) and the top quintile sits at 3.2%+. These are session-based rates from cross-source 2026 syntheses, not platform-attributed numbers.
why does email convert so much higher than paid social?
Email and referral self-select for intent. The person on your list opted in or was sent by a friend. Paid social interrupts someone scrolling. Cold Meta traffic is competing with cat videos and converts at about 1.1%; an email open is already a signal of interest before the click happens. The structural CVR gap between 4.2% and 1.1% is not a media-buying skill issue, it's a traffic-quality issue baked into the channel itself.
should i shift budget from meta to email if email converts 4x higher?
No, because email and paid social do different jobs. Paid social is the top of your funnel (it builds the list email then monetises). If you cut Meta and pour the budget into email, you'll get higher CVR on a smaller list within 6 months. The right question is whether each channel is clearing its own breakeven (CAC vs LTV for paid, deliverability and revenue per recipient for email), not which channel converts higher on average.
what's the difference between email campaign cvr and email flow cvr?
Flows are triggered by behavior (signup, cart abandon, purchase). Campaigns are scheduled blasts to your list. Klaviyo's 2026 data shows flow placed-order rate averages 1.23% across all flow types, abandoned cart flows hit 3.3% (top performers 7.7%), welcome series 3-5%. Campaign blasts: 0.05%. That's a 25-150x gap per send. If you report 'email CVR' as one blended number, you're hiding the program's real efficiency.
why is direct traffic conversion higher than paid traffic?
Direct traffic is people typing your URL or clicking a bookmark. They already know who you are, which is the highest-intent traffic on the site. The 3.0% direct CVR is closer to email than to Google paid search because it's the same psychological mechanic: warm visitor, low decision cost. Most operators undercount direct because GA4 attributes ambiguous sessions to 'unassigned' or 'direct/none,' which can inflate or deflate the number depending on cookie loss.
should i use a different conversion rate target for each channel in ga4?
Yes. A single site-wide CVR target is a vanity metric. Set channel-specific floors based on the 2026 benchmarks: email 4%+, organic 2.5%+, Google paid search 2%+, Meta paid social 1%+. Then review monthly. Channels that fall below floor get the next CRO sprint; channels at or above floor get held while you push the underperformer up to floor. The biggest CRO ROI usually sits in lifting paid-search CVR from 1.4% to 2.5%, not in lifting blended.
is the 1.4% shopify average actually good or bad for my brand?
Below 1.4% means you're in the bottom half of Shopify stores by CVR; above 3.2% puts you in the top 20% (Littledata). But the blended is mix-dependent. A brand running 70% paid social will have a structurally lower blended than a brand running 70% email and organic, even if both are operating at the top of their respective channel benchmarks. Don't compare your blended to a peer's blended without comparing channel mix first.
does branded paid search count as paid search or as direct in cvr benchmarks?
Most aggregators (Triple Whale, Northbeam, Littledata) keep branded paid search inside the Google paid search bucket, which is why the channel's blended CVR runs 2.0-3.0% rather than the 4-6% you'd see on branded alone. If you're modeling your own CVR target, separate branded from non-branded in your reporting and benchmark each against the right comparable. Non-branded paid search at 1.5-2% is healthy; branded at 5%+ is the baseline.