
Insights
Average CPG air vs sea freight cost by vertical, 2026: $5.47/kg air vs $0.23-0.40/kg ocean
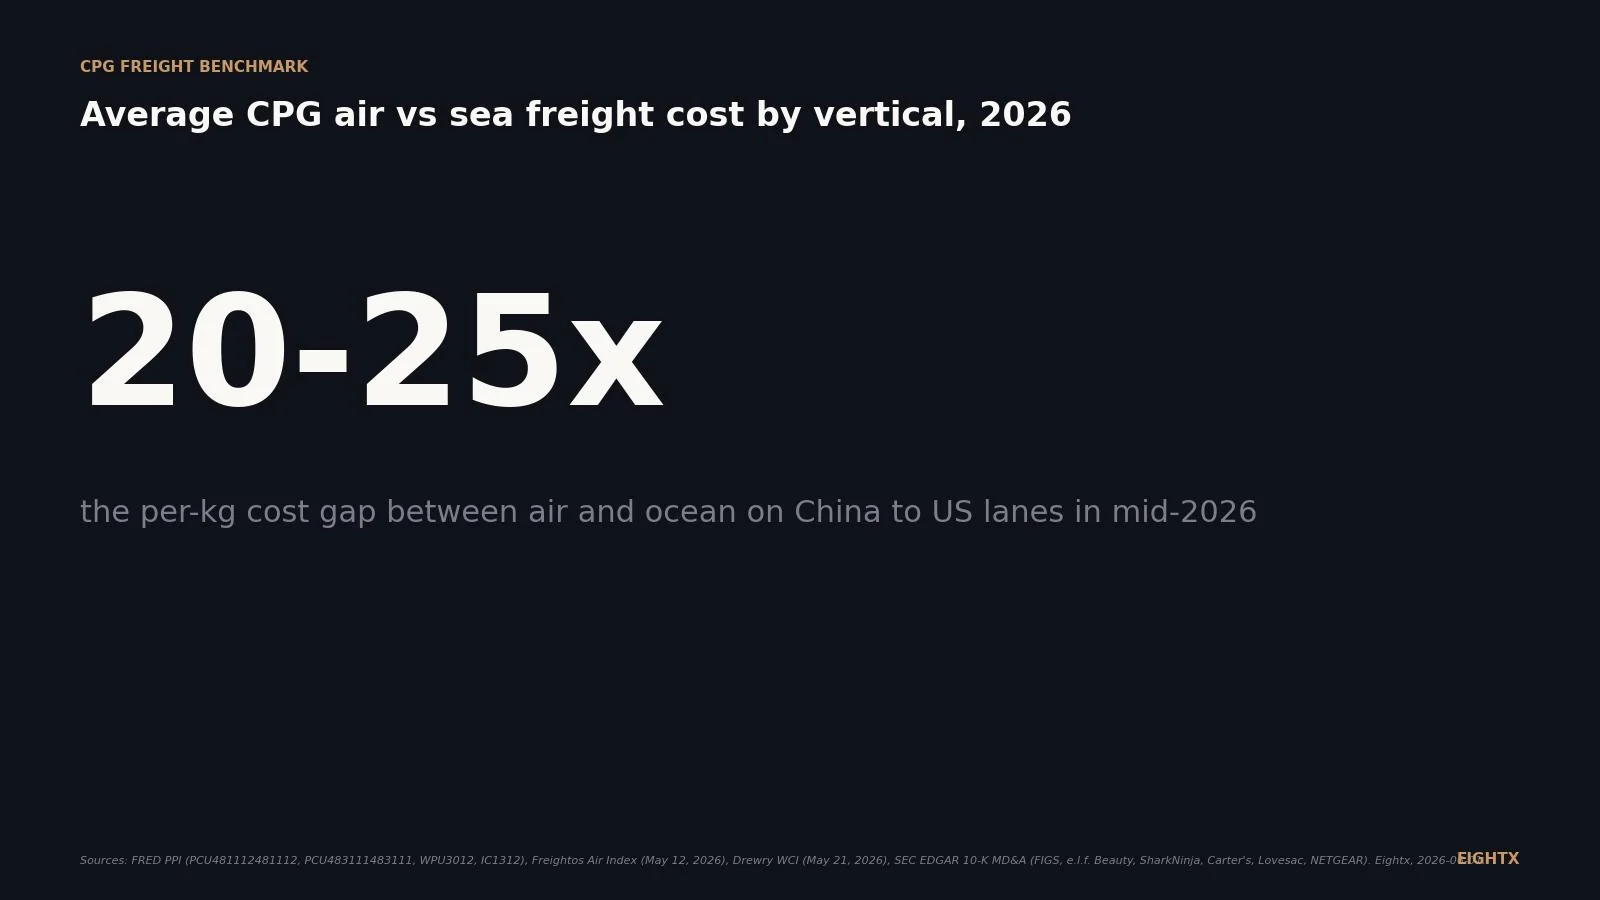
Air freight from China to North America cost roughly $5.47 per kg in May 2026 (Freightos), while ocean freight worked out to $0.23 to $0.40 per kg, making air 20 to 25 times more expensive per kilogram. Most DTC apparel brands run 10 to 20 percent of shipments by air, peaking at launch windows and Q3 restock.
Key Takeaways
- Air freight runs $5.47 per kg China to North America in May 2026 (Freightos Air Index, week of May 12, 2026), while ocean equates to $0.23 to $0.40 per kg depending on lane and container fill. The gap is roughly 20 to 25 times per kg.
- Air-cargo PPI hit a fresh 2024-26 high in April 2026 at 194.1 (FRED PCU481112481112), up 12.9% year-over-year and up 12% month-over-month. Ocean PPI is still 25% above pre-COVID levels but stable.
- Mode mix varies more by vertical than per-kg rates do. Consumer electronics runs 20 to 40% air share, supplements 15 to 40%, beauty 15 to 30%, apparel 10 to 20%, home goods 5 to 15%, ambient food and beverage 2 to 10%.
- Break-even unit value for air freight is roughly $80 to $150 per kg of product. Apparel and beauty often clear it on launch SKUs. Food and beverage almost never does. That is the math that sets your mode mix.
- Public CPG 10-Ks confirm the pattern. FIGS, e.l.f. Beauty, SharkNinja, Carter's, Lovesac, and NETGEAR all contrast air vs ocean freight in MD&A gross-margin discussions for FY25 and FY26.
If you import physical product into the US from Asia, the air-vs-ocean decision sets your gross margin more than your price test ever will for many import-heavy CPG brands. The May 2026 Freightos Air Index puts China-to-North-America air freight at $5.47 per kg. The Drewry World Container Index composite (an 8-lane average) sat at $2,712 per 40-ft container (FEU) on May 21, 2026; the trans-Pacific China-to-US-West-Coast lane specifically printed around $2,600 to $3,000 per FEU in the same week's Freightos commentary. Either way, ocean works out to $0.23 to $0.40 per kg depending on how you fill the box. The gap is 20 to 25 times. This page is the 2026 planning benchmark by CPG vertical: what the FRED Producer Price Indexes (PPIs) are saying, what the spot indices print, what public-company 10-Ks disclose, and how to think about mode mix at $5M to $150M in revenue.
What the 2026 freight indices are telling us
Three FRED Producer Price Index series tell the story. Air freight (NAICS 481112, FRED PCU481112481112) hit 194.099 in April 2026, up 12.9% year-over-year and up 12% from March alone. That is the steepest single-month move since the late-2024 Red Sea diversions. Deep-sea ocean freight (NAICS 483111, FRED PCU483111483111) sat at 430.372, up 5.0% year-over-year but still volatile month-to-month. Truck (FRED WPU3012) was at 179.5, up 9.4% year-over-year. Rebased to January 2023 = 100, air is at 113.8, ocean at 97.2, truck at 115.7.
What the indices do not capture is the lane-level reality. PPI measures producer prices on average; it does not isolate trans-Pacific. For that you need Freightos and Drewry. The BLS does publish an Inbound Price Index specifically for Asia-origin air freight (FRED IC1312), and it sat at 127.440 in April 2026, up 6.5% year-over-year and the highest reading in the post-2022 series. So even on the Asia-specific cut, air-freight cost is climbing.
The practical read for an operator: the air premium is wider in mid-2026 than it has been since the back half of 2024. If your 2026 plan assumed you could lean on air for in-season replenishment, the budget is now wrong.
Series FRED ID April 2026 value YoY % change PPI Scheduled Freight Air Transportation PCU481112481112 194.099 +12.9% PPI Deep Sea Freight Transportation PCU483111483111 430.372 +5.0% PPI Truck Transportation of Freight WPU3012 179.5 +9.4% Inbound Price Index, Air Freight Asia IC1312 127.440 +6.5% PPI Commodity Air Transportation of Freight WPU3014 174.625 +15.2%
The per-kg gap that decides mode mix
Producer indices are useful for trend, but the planning conversation happens in dollars per kg. Here is the math.
Air freight: Freightos Air Index averaged $5.47 per kg China to North America in the week of May 12, 2026. Lane-level pricing inside that average ranged from roughly $5.00 on flat-deck consolidations to $6.00 plus on tight-belly carriers.
Ocean freight: Drewry WCI composite hit $2,712 per 40-ft container on May 21, 2026 (up 6% week-over-week). Trans-Pacific lane-level prints sat at roughly $2,600 to $3,000 per FEU for US West Coast and $3,600 to $4,500 per FEU for US East Coast. A 40-ft container has a payload limit of about 26 tonnes by weight but typically cubes out for CPG at 10 to 15 tonnes depending on product density. Using a 10 to 12 tonne planning range, that pencils to $0.23 to $0.40 per kg.
The 20 to 25 times spread is the headline. But there are two second-order pieces you need to model alongside.
First, drayage. Air freight is rarely door-to-door for CPG. You pay drayage to the origin airport, you pay the airline, then you pay drayage from the destination airport to your 3PL. Truck PPI is up 9.4% year-over-year, so the last-mile leg is no longer free either. Budget $0.20 to $0.40 per kg in drayage on top of the $5.47 air rate for a fully-landed Asia-to-3PL comparison.
Second, transit time. Ocean transit Asia to US West Coast in Q2 2026 is 30 to 35 days including port dwell. Air is 3 to 7 days. The $5 to $6 per kg air premium buys you about 25 days of inventory-cycle compression. That is a working-capital story, not just a freight story, and it is the lever that decides when air actually pays back (more on that below).
Mode-mix benchmarks by CPG vertical
Per-kg rates vary less by vertical than mode mix does. The CPG verticals that ship the most air are the ones with high unit value, fast launch cadence, and SKU proliferation. The verticals that ship the most ocean are heavy, low-margin, or shelf-stable.
Six verticals, midpoint planning numbers, with ranges in the table below:
Consumer electronics (60-80% ocean / 20-40% air). Highest air share. New-product launches and stockout recovery routinely flex air. NETGEAR's FY25 10-K (filed 2026-02-13) discloses air freight is used more aggressively for new-product launches. Per-kg unit value is high enough that air pencils.
Supplements and health (60-85% ocean / 15-40% air). DTC-skewed brands run more air than CPG-channel brands. Subscription replenishment is forgiving on transit time, so the air share is concentrated in launch quarters and supply-chain disruptions, not steady-state.
Beauty and personal care (70-85% ocean / 15-30% air). Higher unit value than apparel, lower than electronics. e.l.f. Beauty's FY26 10-K (filed 2026-05-21) cites freight as a contributor to gross-margin variability without breaking out the mix. Ocean is the default; air is used for promo-driven stock and missed forecast catches.
Apparel and footwear (80-90% ocean / 10-20% air). FIGS (FY25 10-K filed 2026-02-26) is the cleanest disclosure: ocean is the standard mode, air is used only for "select inventory replenishment when in-stock service levels are at risk." Carter's FY25 10-K (filed 2026-02-27) names ocean surcharges and air contingency in its supply-chain risk factors. Most apparel brands at $5M to $50M revenue we work with sit at 12 to 18% air by weight.
Home goods (85-95% ocean / 5-15% air). Heavy, low value per kg. SharkNinja (FY25 10-K filed 2026-03-02) and Lovesac (FY25 10-K filed 2026-04-02) both treat ocean as the base mode and call out air as exception handling. The air share that does exist concentrates in launch quarters and capacity-constrained periods.
Food and beverage, ambient (90-98% ocean / 2-10% air). Lowest air share. Shelf-stable F&B has low unit value per kg and forgiving stockout economics; air almost never pencils. The 2 to 10% air share is concentrated in supplements-adjacent functional food and premium-priced launch SKUs.
Vertical Ocean share Air share Ocean $/kg (USWC, 10-12t) Air $/kg (China-NA) Ratio Consumer electronics 60-80% 20-40% $0.15-0.25 $5.00-6.00 ~25-35x Supplements and health 60-85% 15-40% $0.20-0.30 $5.00-6.00 ~20-25x Beauty and personal care 70-85% 15-30% $0.20-0.30 $5.00-6.00 ~20-25x Apparel and footwear 80-90% 10-20% $0.20-0.35 $5.00-6.00 ~17-25x Home goods 85-95% 5-15% $0.15-0.30 $5.00-6.00 ~20-35x Food and beverage (ambient) 90-98% 2-10% $0.12-0.20 $5.00-6.00 ~30-45x
What public-CPG 10-Ks actually disclose about freight
CPG companies do not report freight as a separate GAAP line. The disclosure shows up in two places: supply-chain risk factors and MD&A gross-margin discussion. Here is the language pattern across the eight CPG-relevant 10-Ks filed between mid-2025 and mid-2026.
Company Ticker Vertical 10-K filed Freight cost language (paraphrased) FIGS FIGS Apparel (healthcare) 2026-02-26 Ocean is standard; air used only for "select inventory replenishment when in-stock service levels are at risk" e.l.f. Beauty ELF Beauty 2026-05-21 Cites freight as contributor to gross-margin variability; ocean is base mode SharkNinja SN Home goods / small appliances 2026-03-02 Discloses inbound freight cost as gross-margin line item; FY25 GM +90bps Carter's CRI Apparel (children's) 2026-02-27 Names ocean freight surcharges and air-freight contingency in supply-chain risk Lovesac LOVE Home goods (furniture) 2026-04-02 Notes ocean container cost normalization and selective air for launches NETGEAR NTGR Consumer electronics 2026-02-13 Air freight used more aggressively for new-product launches and stockout recovery Abercrombie & Fitch ANF Apparel 2026-03-26 Discusses ocean vs air tradeoff in supply-chain risk factors Corsair Gaming CRSR Consumer electronics 2026-02-25 Cites freight cost normalization as 2025 gross-margin tailwind
The pattern is consistent. Ocean is the default mode across every vertical. Air is reserved for launch, replenishment, or stockout recovery. None of the eight 10-Ks discloses a mode-mix percentage; that is private operator knowledge. But the language tells you that even at FIGS and SharkNinja scale, the air-vs-ocean decision is made SKU by SKU, not channel by channel.
When air pays back and when it doesn't
This is the section that actually changes your plan. Three scenarios where air freight is the right call, and one where it almost never is.
Air pays back: new-SKU launch with stockout risk. First 4 to 6 weeks of stock on a launch SKU, where stocking out the launch costs you the entire marketing curve, not just one week of sales. The air premium is roughly $5 per kg over ocean. If your unit is 200 grams, that is $1 of incremental landed cost per unit. On an $80 launch SKU at 60% gross margin, that is $1 against $48 of contribution. Air pays back if it prevents even a single week of stockout.
Air pays back: high-value-per-kg replenishment. The break-even rule of thumb (derived from inventory cost-of-capital times transit-time compression math, not an observed industry statistic) is unit value of $80 to $150 per kg of product. Translate your unit weight and unit price: a 100-gram beauty SKU at $40 retail is $400 per kg, well above breakeven. A 1-kg sneaker at $120 is $120 per kg, right at breakeven. A 2-kg coffee bag at $25 is $12.50 per kg, far below. Run the math for your top 20 SKUs and you will find air pencils on fewer than you think.
Air pays back: working-capital compression on a fast-growing brand. Ocean transit is 30 to 35 days; air is 3 to 7. That 25-day compression is worth real money if you are carrying inventory on a credit line at 12% APR or on RBF at 18%+. The math: 25 days saved on $1M of inventory at 12% APR is ~$8,200 in working-capital savings. The air premium on 10 tonnes of $80/kg product is $50,000. Air does not pay back on the working-capital math alone; it pays back on stockout prevention plus working-capital, combined.
Air rarely pays back: routine ambient F&B replenishment. Low unit value, forgiving stockout, predictable demand. The 30 to 45x air-to-ocean ratio for ambient F&B is not a planning constraint; it is a tell that air is the wrong mode for that vertical at steady state.
The operator read on air vs ocean in 2026: ocean is the default at 80-90% by weight for most CPG, air is the exception you flex during launches and supply chain breaks. The 20 to 25x per-kg gap is too wide to absorb at steady state, but the working-capital compression and stockout-prevention math can justify air on the right SKUs. Run the math at the SKU level, not the brand level.
What we are watching next
Four signals that move the 2026 picture between now and Q4.
Q3 2026 contract season. Most CPG brands lock in trans-Pacific ocean contracts in June and July for the back-half. Spot rates that climb between now and then push more brands onto contract terms, which dampens further spot volatility.
Panama Canal water levels. The 2025 drought constrained Panama transits and pushed traffic to the Suez and longer routes. 2026 prints have been more normal, but a repeat would tighten ocean capacity and push some east-coast lanes higher.
Red Sea and Hormuz routing. Houthi disruption in late 2024 was the last comparable air-freight shock. Sustained Hormuz tension in mid-2026 could replicate that pattern on a different vector.
Section 321 de minimis disposition. The US de minimis policy on sub-$800 import parcels affects e-commerce air-freight demand more than ocean. Policy moves here would reshape the air-cargo mix and rate structure.
Sources and methodology
FRED PPI series. Five core series pulled via the FRED MCP on 2026-06-01. PCU481112481112 is the Producer Price Index by Industry for Scheduled Freight Air Transportation, base December 2003 = 100, April 2026 print 194.099. PCU483111483111 is the Producer Price Index by Industry for Deep Sea Freight Transportation, base June 1988 = 100, April 2026 print 430.372. WPU3012 is the Producer Price Index by Commodity for Truck Transportation of Freight, base June 2009 = 100, April 2026 print 179.5. IC1312 is the BLS Inbound Price Index for Asia-origin air freight, base 2000 = 100, April 2026 print 127.440. WPU3014 is the commodity-side PPI for air-freight transportation, used as a cross-check.
Freightos. Air Index China-North America $5.47 per kg (week of May 12, 2026) sourced from the public Freightos weekly market update. FBX (Freightos Baltic Index) trans-Pacific lane commentary cites $2,600 to $3,000 per FEU US West Coast and $3,600 to $4,500 per FEU US East Coast in May 2026. Exact FBX numerical prints are paywalled; figures used here are from public commentary.
Drewry World Container Index. Composite container index sat at $2,712 per FEU on 2026-05-21 (up 6% week-over-week) and $2,553 per FEU on 2026-05-14. Sourced from the Drewry public WCI weekly bulletin.
Per-kg ocean derivation. A 40-ft container has a payload limit of about 26 tonnes by weight, but CPG containers typically cube out (volume-limited) at 10 to 15 tonnes depending on product density. We used a 10 to 12 tonne planning range and divided lane spot rates ($2,800 USWC, $4,000 USEC) by that range to get $0.20 to $0.40 per kg ocean cost. This is a planning approximation, not a Freightos or Drewry per-kg primary statistic.
SEC EDGAR. Full-text search for "air freight" AND "ocean freight" with forms=10-K and date range 2025-06-01 to 2026-05-31. 18 raw results; eight CPG-relevant issuers retained (FIGS, e.l.f., SharkNinja, Carter's, Lovesac, NETGEAR, Abercrombie, Corsair). Excluded freight providers themselves (Matson, FedEx, RXO, Landstar, ArcBest), packaging (Karat), and out-of-scope.
Limitations. No primary source publishes per-kg air or per-FEU ocean rates broken out by CPG vertical. The per-vertical numbers above are derived planning benchmarks, not observed statistics. Freightos Baltic Index lane-level prints are paywalled; only commentary-grade ranges are public. Mode-mix percentages are operator-pattern estimates from public 10-K language and Eightx client work, not census or trade-association data. Real-time freight rates can move 10 to 30% in a 90-day window. The post is dated to its snapshot.
Update cadence. This benchmark is refreshed quarterly when fresh FRED PPI prints land and we re-run the Freightos/Drewry snapshot. Next update target: September 2026.
For related context, see our DTC cost-of-goods index for 2026 and the DTC 3PL cost index.
Frequently asked questions
how much more does air freight cost than ocean freight per kg in 2026?
Air freight runs about $5.47 per kg China to North America in May 2026 (Freightos Air Index). Ocean works out to $0.23 to $0.40 per kg once you divide a spot 40-ft container rate ($2,700 to $4,000) by a typical CPG container load of 10 to 12 tonnes. That makes air roughly 20 to 25 times more expensive per kg on the same lane.
should i ship my dtc launch by air or sea if i'm a $5m to $20m brand?
Default to sea, use air for the first 4 to 6 weeks of stock on a new SKU launch where stockout cost is higher than the freight premium. If your AOV is $80+ and your unit weighs under a kg, air pencils on launch. If you sell anything heavy or low-value-per-kg, sea even on launch and just push your reorder window earlier.
what percent of my shipments should be air vs ocean if i sell apparel?
Most apparel brands we work with run 10 to 20% air by weight, peaking during launch windows and Q3 restock. FIGS discloses this pattern in its FY25 10-K: ocean is the standard mode, air is used for select inventory replenishment when in-stock service levels are at risk. That is the right default for $5M to $50M apparel brands.
when does air freight actually pay back vs the stockout cost it prevents?
The break-even unit value where air pays back is roughly $80 to $150 per kg of product, depending on your cost of capital and gross margin. Apparel and beauty often clear it. Ambient food and beverage almost never does. The cleaner test is: if you stocked out and lost a week of sales on this SKU, would the lost contribution exceed the air freight premium? If yes, ship air on that SKU.
how do public companies like figs and elf beauty disclose freight cost in their 10-k?
Both name freight as a driver of gross-margin variability without breaking it out as a separate GAAP line. FIGS calls out ocean freight as standard with air for replenishment. e.l.f. Beauty cites freight as a contributor to gross-margin moves in its FY26 MD&A. SharkNinja, Carter's, Lovesac, and NETGEAR all contrast air vs ocean freight in supply-chain risk factors. CPG companies do not report freight as a separate GAAP line, so MD&A language is the public benchmark.
what is the freightos baltic index and how often should i check it?
The Freightos Baltic Index (FBX) is a daily container-freight benchmark covering 12 trade lanes; the Freightos Air Index is the weekly air-freight sister. Both publish public commentary; lane-level numerical prints are paywalled. Check the public weekly market update every Monday during contract-negotiation windows (April to June for Q3 sailings) and otherwise once a month.
why did air freight prices jump in early 2026 if ocean is flat?
The April 2026 FRED PPI for scheduled air-freight transportation broke out +12% month-over-month while deep-sea PPI was flat-to-down. May 2026 Freightos commentary flags Hormuz tension as one factor firming trans-Pacific air bookings; other commonly cited drivers (e-commerce parcel demand around the Section 321 de minimis policy debate, belly capacity on passenger-cargo lanes) are operator speculation rather than primary-sourced in the same window. The clean read is that the index move is real and air-specific; the exact driver mix is still being debated.
how much does it cost to ship a 40ft container from china to los angeles in mid-2026?
Drewry WCI composite was $2,712 per 40-ft container on May 21, 2026 (up 6% week-over-week), with China to US West Coast specifically pricing around $2,600 to $3,000 per FEU in May 2026 Freightos commentary. China to US East Coast was higher, around $3,600 to $4,500 per FEU. Both numbers can move 10 to 30% in a 90-day window, so anchor any plan to the snapshot date.