
Insights
Average inventory days by vertical 2026: 26 public 10-Ks, 7 verticals, an 8x spread
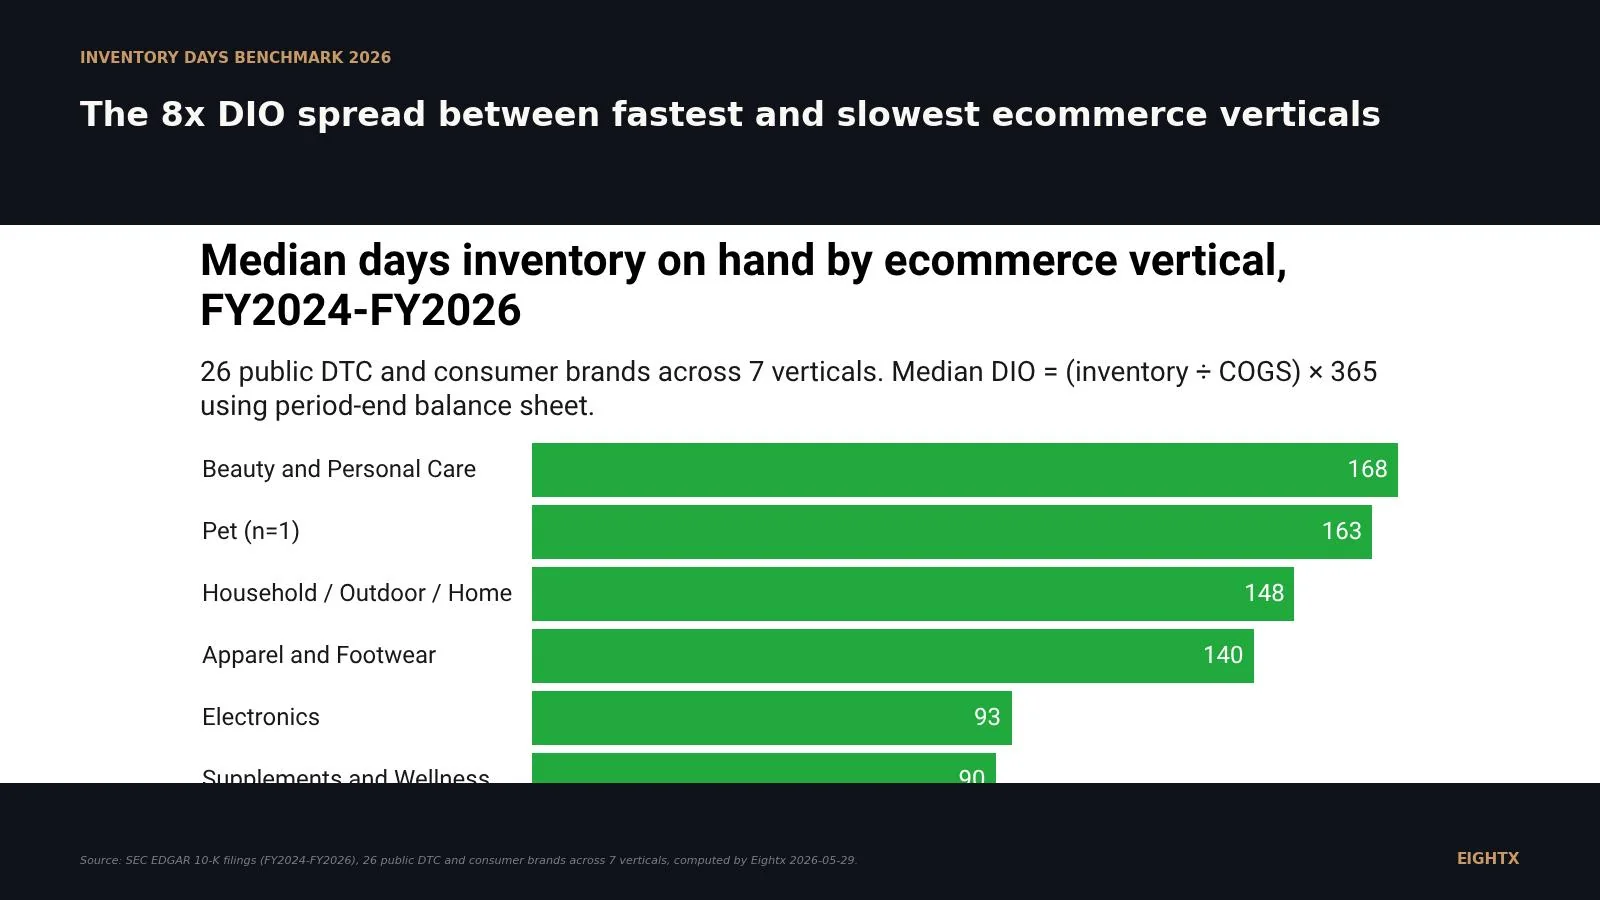
Median days inventory on hand is 127 days pooled across 26 public DTC and consumer brands in 2026, but the vertical spread is 8x. Beauty runs 168 days, apparel 140 days, and food and beverage just 38 days. Using the pooled median as a target will either strand cash in slow verticals or signal a false problem in fast-turn ones, so always benchmark against your category.
Key Takeaways
- Pooled median days inventory on hand (DIO) across 26 public DTC and consumer brands is 127 days. The range runs from 23 days (Vital Farms, perishable eggs) to 212 days (Olaplex, premium prestige beauty). The 8x spread is the single most useful number on this page.
- Vertical drives DIO more than scale or geography. Beauty and Personal Care median is 168 days (n=5). Food, Beverage and Grocery is 38 days (n=5). Apparel and Footwear sits between at 140 days (n=6). Pick the median for YOUR vertical; a universal 'good DIO' does not exist.
- Public-company DIO is 2.5 to 3x above private 'healthy' benchmarks for apparel and beauty. Perplexity and Parallel.ai both put healthy DTC apparel at 30 to 55 days; the public median is 140. Your $5M to $50M brand should benchmark against private peers, not Lululemon.
- High gross profit margin is what funds high DIO carry. Olaplex (212d) and Sally Beauty (211d) both run 50 to 70% gross margins. If your margin is sub-50% and your DIO is over 150 days, you are financing inventory the market does not reward you for holding.
- Two plays beat any sourcing change in the first 90 days for cash recovery. SKU rationalization (Bain documented a 40% SKU cut producing a 60% inventory drop) plus DPO extension on your top 5 suppliers. Both work without touching your manufacturer.
If you sell physical product, your single biggest cash lever is how long stock sits before it sells. Days inventory on hand (DIO, also called days inventory outstanding) is the formal metric, and it varies more by vertical than by anything else, including scale and channel mix. We pulled FY2024 to FY2026 10-K balance sheets for 26 public DTC and consumer brands across 7 verticals and computed DIO for each. The pooled median is 127 days. The range runs 8x wide: 23 days at Vital Farms to 212 days at Olaplex. This is the living index, refreshed quarterly as new 10-Ks land.
The data confirms what most operators feel but rarely benchmark: there is no universal "good DIO." There is only the vertical median, the gross-margin math that justifies your specific carry, and the gap between public-company numbers and private-brand healthy zones. We walk through all three below.
What the public 10-Ks say about inventory carry in 2026
Across the 26 public DTC and consumer brands we analysed, the pooled median DIO is 127 days. Beauty and Personal Care sits at the longest end with a 168-day vertical median. Food, Beverage and Grocery turns inventory in 38 days. That is the 8x spread we lead with: 130 days between the slowest and fastest vertical median.
The pattern holds across scale. Olaplex (212 days) and Vital Farms (23 days) are both public, both mid-cap, both have working capital teams, and one carries 9x more days of stock than the other. Vertical economics decide.
Two caveats before we walk through the medians. First, Pet vertical is n=1 (BARK) and is directional only; we kept it in the chart for completeness but flag it in the methodology. Second, Beauty hides a meaningful split between premium prestige (Olaplex 212d, Sally Beauty 211d, Nu Skin 126d) and mass (e.l.f. 168d, Honest Co 133d). We address the premium versus mass spread in the vertical walkthrough.
DIO by vertical: the 8x spread, explained
Walking the 7 verticals from fastest to slowest gives the structural story behind each median.
Food, Beverage and Grocery (38-day median, n=5). Vital Farms holds 23 days. Sprouts Farmers Market holds 26. Celsius energy drinks 38. Freshpet refrigerated pet food 51. Beyond Meat is the outlier at 145 days, but frozen alt-protein with declining demand has more in common with apparel than with fresh food. The forcing function here is shelf life. Product literally cannot sit, which becomes a working-capital moat: you cannot carry stock you do not have room to store.
Electronics (93-day median, n=2). GoPro at 83 days, Sonos at 102. Contract-manufacturing relationships and product cycles drive the carry. Both brands typically extend long DPO terms, which partially offsets the inventory days from a cash perspective. n=2 is thin, and we flag it.
Supplements and Wellness (90-day median, n=4). Hims and Hers sits at 78 days. BellRing at 81. Medifast at 98. USANA at 158. The split here is diagnostic: subscription-model DTC pulls inventory turns toward the food/bev end of the spectrum because billing cadence smooths demand, while traditional MLM and meal-replacement structures sit closer to the beauty pattern. If you are building a wellness brand, the subscription decision is also a working-capital decision.
Apparel and Footwear (140-day median, n=6). Warby Parker eyewear at 48 days (size matrix is thin for eyewear, so inventory is denser). TheRealReal resale apparel at 56 (consigned supply, no risk capital). Lululemon at 129, Columbia at 150, Levi at 174, FIGS at 200. The spread tells the story: pricing power funds the carry. FIGS premium scrubs at 200 days, Warby at 48; both are apparel, but Warby turns 4x faster because their SKU complexity is structurally lower.
Household, Outdoor and Home (148-day median, n=3). Purple at 68 days, YETI at 148, Helen of Troy at 171. Durables with international supply chains and seasonal selling patterns. YETI is the modal example: Q1 trough, Q3 build, Q4 sell-through, then repeat.
Pet (163 days, n=1). BARK only. We caveat this as directional. CHWY (Chewy) is too wholesale-heavy and too large to compare; Freshpet sits in Food/Bev because the product is refrigerated. If you operate in pet, look at BARK as a single data point and triangulate against the Supplements median.
Beauty and Personal Care (168-day median, n=5). Nu Skin 126 days, Honest Co 133, e.l.f. 168, Sally Beauty 211, Olaplex 212. Premium prestige sits at the top, mass slightly faster but still long. Why beauty earns the carry: 60 to 75% gross margins absorb the cost of holding 6 months of inventory, long Asian formulation lead times build the carry into the structure, and SKU sprawl (40 to 50 SKUs per launch cycle) means safety stock multiplies fast. We unpack the SKU-sprawl angle in "What this means."
For definition-level questions on DIO mechanics, see our what is days inventory on hand glossary post. For the same dataset analysed at company-level rather than vertical-level, see inventory days by DTC vertical 2026 and inventory days public DTC 2026.
How the 26 peers stack up, ranked
The full company-by-company picture. Vital Farms anchors the fast end at 23 days; Olaplex anchors the slow end at 212. Most of the action is in the middle band from 80 to 180 days, where vertical choice and gross margin together decide where you land.
Company Ticker Vertical FY Inventory ($M) COGS ($M) DIO (days) Vital Farms VITL Food and Beverage FY2024 24 376 23 Sprouts Farmers Mkt SFM Grocery FY2024 343 4,778 26 Celsius CELH Food and Beverage FY2025 131 1,248 38 Warby Parker WRBY Eyewear FY2025 52 401 48 Freshpet FRPT Pet Food FY2024 81 579 51 TheRealReal REAL Resale Apparel FY2024 24 153 56 Purple Innovation PRPL Home / Mattress FY2024 57 307 68 Hims and Hers HIMS Wellness / Subscription FY2024 64 303 78 BellRing Brands BRBR Supplements FY2024 286 1,289 81 GoPro GPRO Electronics FY2024 121 530 83 Medifast MED Supplements FY2024 42 158 98 Sonos SONO Electronics FY2024 232 829 102 Nu Skin NUS Beauty / Supplements FY2024 190 550 126 Lululemon LULU Apparel FY2025 1,701 4,818 129 Honest Co HNST Beauty / Personal Care FY2024 85 234 133 Beyond Meat BYND Food and Beverage (alt protein) FY2024 113 285 145 YETI Holdings YETI Household / Outdoor FY2024 310 767 148 Columbia Sportswear COLM Apparel / Outdoor FY2024 691 1,677 150 USANA USNA Supplements FY2024 70 161 158 BARK BARK Pet Subscription FY2024 84 188 163 e.l.f. Beauty ELF Beauty (mass) FY2026 220 479 168 Helen of Troy HELE Household / Beauty appliance FY2026 456 971 171 Levi Strauss LEVI Apparel (denim) FY2024 1,131 2,375 174 FIGS FIGS Apparel (premium medical) FY2025 116 211 200 Sally Beauty SBH Beauty Retail FY2025 1,037 1,791 211 Olaplex OLPX Beauty (premium prestige) FY2025 75 129 212
Public vs private: the 2.5x gap is the diagnostic for most readers
Cross-checking the public medians against private DTC benchmarks reveals the most operationally useful finding in this dataset.
External research (Perplexity 2026-05-29 multi-source) puts healthy DTC apparel at 30 to 55 days, healthy beauty at 45 to 70, healthy supplements at 70 to 100, and healthy food and beverage at 25 to 45. Parallel.ai independently confirmed the same bands within tolerance. Sources include the eFulfillment Service 2026 inventory benchmark and the OneCart days inventory outstanding guide.
| Vertical | Private healthy band | Public peer median (this dataset) | Gap |
|---|---|---|---|
| Apparel | 30 to 55 days | 140 days | 2.5 to 4.7x |
| Beauty | 45 to 70 days | 168 days | 2.4 to 3.7x |
| Supplements | 70 to 100 days | 90 days | aligned |
| Food and Beverage | 25 to 45 days | 38 days | aligned |
For fast-turn verticals (food, supplements) the public and private benchmarks converge. For slow-turn verticals (apparel, beauty) the public median sits 2.5 to 3x above the private healthy band. The structural reason: public-company scale carries more inventory because the wholesale-to-DTC mix is wider (LEVI and COLM sit on stock waiting for retailer orders), seasonal commit cycles run longer, and lower cost of capital absorbs the carry. None of that is true for a $5M to $50M private operator.
The operational read for most readers: if you run a private apparel brand and your DIO is 80, you are inside the healthy band even though you are 60 days below the public median. If you run a private beauty brand at 130 days, you are above the private band even though you are well below the Beauty public median of 168. Use the right peer set.
The relationship between DIO and gross margin
High DIO is economically rational when gross margin per unit is high enough to pay for the carry. Olaplex at 212 days only pencils because they earn 69% gross margins. The same 212 days at a 45% gross margin brand would consume nearly all unit profit.
Run the rough math. Every day of DIO ties up approximately 1/365 of annual COGS in working capital. At 12% cost of capital, that is about 3.3 cents per $100 of annual COGS per day. For a $20M brand at 55% COGS ($11M annual COGS), every 30 days of DIO costs roughly $108K a year in carry (30/365 × $11M × 12%). At 60% gross margins ($8.8M revenue contribution from $11M COGS), that $108K is 1.2% of contribution. Manageable.
Run it again for a 40% gross margin brand. Same $11M COGS, same 30 days of DIO, same $108K of annual carry. But the revenue contribution per dollar of COGS is now 67% (40/60), so $108K is 1.6% of contribution. Still manageable, until you compound it across 180 days. That is when high DIO without margin support becomes a runway problem.
The danger zone in our dataset: Honest Co at 133 DIO and 33% gross margin. BARK at 163 DIO and 62% margin (subscription cushions it). Beyond Meat at 145 DIO and 3% gross margin. The last one is not a benchmark, it is a warning.
Vertical drives DIO more than scale does. Beauty earns the right to 168 days through 70% gross margins; food has no choice but to clear in 38 because shelf life forces it. Pick your peer set carefully, then pick one lever and pull it. The 200-day apparel brand and the 23-day egg brand are running the same formula but living in different worlds.
What this means for your next inventory move
Five plays, ordered by effort-to-payback for a private DTC operator at $5M to $150M revenue.
1. SKU rationalization first. Bain documented a European supermarket case where a 40% SKU cut produced a 60% drop in inventory days. Most operators carry far more SKUs than the customer rewards. A-B-C tiering on trailing-12-month gross profit per SKU. A-SKUs hold 12 weeks of cover. B-SKUs hold 6. C-SKUs drop ship or die. This is the cheapest cash recovery available and usually moves DIO 30 to 60 days in a single quarter.
2. DPO extension on your top 5 suppliers. Push from net-15 to net-45 across your largest spend partners. Each incremental day of DPO releases roughly 1/365 of your annual COGS in working capital, so a 30-day move is meaningful cash on a typical $10M to $50M COGS base. Wrap the ask in a 12-month volume commitment. If the supplier wants to be paid faster than your new terms allow, a supply chain finance platform can pay them in 5 days while you still pay in 45. Both parties win, and you keep the cash.
3. Subscription billing where the category supports it. Subscription models like Hims and Hers can flip the cash conversion cycle negative by collecting cash before COGS lands. If your category has a real repeat-purchase cycle, subscription pulls your effective DIO toward the food and beverage end of the spectrum because billing predictability smooths safety stock down.
4. Forecasting accuracy over inventory policy. From a 2025 strategy call with one of our supplements clients: "definitely helping understand the demand that you will have over the next six months. Based on historical information we can take out those months where you are out of stock and rebuild the demand curve." Stockout-adjusted forecasting beats arbitrary days-of-cover targets every time. If your forecast variance is over 25%, fix that before you touch your sourcing.
5. Warehouse sales for aged stock before it becomes dead stock. The right tail of your inventory distribution is aging product that is one quarter away from being a write-down. Move it now at 40 to 60% of MSRP through warehouse sales, Whatnot, or your email list before it becomes worth zero. The cash recovery is real and the margin hit is smaller than the eventual write-down.
The lever that does NOT work for most private operators: opening a new sourcing relationship to negotiate better lead times. That is a 6-to-12-month project with execution risk. Save it for after you have done 1 through 5.
For the personalized math, cash conversion cycle benchmark 2026 has a calculator that takes your inventory, AR, AP, COGS, and vertical, and returns your DIO, DSO, DPO, CCC alongside the vertical median. That is the "run your numbers" handoff for this index.
Sources and methodology
Data source. SEC EDGAR annual report filings and financial-statement data, accessed 2026-05-29. Tickers retained with computable DIO (n=26): WRBY, YETI, OLPX, ELF, FIGS, LULU, CELH, VITL, HIMS, SONO, FRPT, BARK, PRPL, BRBR, SFM, COLM, LEVI, HELE, GPRO, USNA, MED, NUS, BYND, HNST, REAL, SBH.
Tickers attempted but excluded. On Holding (ONON) is a foreign filer reporting under IFRS via 20-F, not 10-K. Allbirds went private after 2025 Nasdaq delisting; no current 10-K is filed. Rev Group (REVG), Brilliant Earth, and Solo Brands either could not be resolved via EDGAR or had incomplete inventory disclosure. We flag these for future refresh cycles.
Formula. DIO = (period-end inventory ÷ full-year COGS) × 365. Inventory is the period-end balance from the most recently filed 10-K balance sheet. COGS is the full-year cost of revenue from the same 10-K income statement. Where Cost of Revenue is not separately reported in XBRL (YETI 2024), COGS is computed as Revenue minus Gross Profit. Period-end balances are used (not 2-period averages), matching the convention of the cash conversion cycle benchmark and the inventory-days companion posts. Period-end overstates DIO slightly for fast-growth brands like Celsius and Hims.
Fiscal year alignment. Most brands report calendar FY ending December 2024 or December 2025. Non-calendar fiscal years: Lululemon (February), Helen of Troy (February), YETI (late December), Sonos (September), BellRing (September), Sally Beauty (September), e.l.f. (March), BARK (March), Levi (late November). Each company is paired with the most recently filed FY balance sheet and same-period COGS, which means the dataset spans roughly 14 months of balance sheet dates. Apples-to-apples is imperfect, but consistent with standard lender benchmark practice.
Limitations. Five worth naming. First, the sample is public-company biased; private DTC under $50M is excluded by data availability. Triangulation against ATTN Agency, eFulfillment Service, and Parallel.ai private bands suggests public medians sit 2.5 to 3x above private healthy zones for slow-turn verticals. Second, wholesale-heavy brands (LEVI, COLM, BRBR) carry higher DIO than pure DTC because they sit on inventory waiting for retail orders; pure DTC numbers would be lower. Third, Pet vertical is n=1 (BARK). Fourth, consignment (REAL) and subscription (HIMS, BARK) models report DIO differently than transactional DTC; we flag these in the company table. Fifth, seasonal positioning of fiscal year-end matters: Q4-end balance sheets are post-peak builds; Q1-end balance sheets are post-holiday drawdown.
Vertical taxonomy edge cases. HIMS is bucketed as Supplements and Wellness; the case for Beauty is equally defensible. Honest Co is bucketed as Beauty; the case for Personal Care or Household is defensible. BARK is bucketed as Pet; the case for Subscription is defensible. Each call is named in the company table.
Update cadence. Quarterly. Next refresh: 2026-08-29 after Q2 10-Qs and late FY2025 filers. The slug stays constant across refreshes so backlinks compound. dateModified, variableMeasured values, and the medians are updated each cycle.
For deeper reading on the underlying mechanics, see what is days inventory on hand and what is cash conversion cycle. For the company-level company-by-company analysis with related metrics, see cash conversion cycle public DTC 2026. The personalized "run your numbers" calculator is at cash conversion cycle benchmark 2026.
Frequently asked questions
what is a healthy days inventory on hand for a $10m dtc brand?
Use your vertical's private benchmark, not the public median. For private DTC at $5M to $50M: apparel 30 to 55 days, beauty 45 to 70, supplements 70 to 100, food and beverage 25 to 45. The public-company medians on this page (140 days apparel, 168 days beauty) are 2.5 to 3x above the private healthy band. Public scale carries more inventory than private operators do.
how is days inventory on hand different from inventory turnover?
They measure the same thing inverted. DIO = (inventory ÷ COGS) × 365. Inventory turnover = COGS ÷ inventory. DIO of 90 days equals an inventory turnover of about 4x per year. DIO is easier to talk about with operators because the number maps to weeks of cover; turnover is easier when comparing across companies of different sizes. Pick one and stick with it.
why does beauty carry 168 days of inventory but food carries 38?
Three structural reasons. Beauty has long Asian formulation lead times (often 90 to 120 days), 40 to 50 SKUs per launch cycle, and 60 to 75% gross margins that subsidize the carry. Food has shelf-life forcing functions (perishables physically cannot sit), 35 to 50% gross margins that punish carry, and demand that the customer wants daily. Same product category, different inventory physics.
is 200 days of inventory always bad?
No. It depends on your gross margin and your category. Olaplex sits at 212 days with 69% gross margins and the math works because the carry cost is small relative to the per-unit profit. If your gross margin is 50% and your DIO is 200, that same carry consumes most of your unit economics. The diagnostic is DIO times cost-of-capital divided by gross margin per unit. If that ratio is above 25%, you have a problem.
how do i calculate dio if i'm a private brand with no published financials?
Pull your trailing-12-month COGS from your P&L, then your period-end inventory balance from your balance sheet (or your 3PL or Cogsy report). DIO = (inventory ÷ COGS) × 365. Most operators use the December 31 inventory snapshot but a 3-month rolling average is more useful because month-end inventory is noisy. If you want to compare to public peers, use the same period-end convention they do.
should i benchmark against the median or the bottom quartile for my vertical?
Under $20M revenue: target the bottom quartile (the tighter end). Your cost of capital is higher than the public peers (you are on RBF or MCA at 14 to 22%, not bank prime at 6 to 8%), so the carry costs you more per dollar trapped. Over $50M: median is fine if your gross margin supports it. The public-company medians in this index are the upper bar, not the target.
does fiscal-year-end skew DIO comparisons across companies?
A little. Most companies here use calendar-year FY ending December. Lululemon, Helen of Troy, YETI, Sonos, BellRing, Sally Beauty, e.l.f., BARK, and Levi use non-calendar FYs (January, February, March, September, or November end). That means some balance sheets are post-holiday drawdown (Q1 trough) and others are mid-Q4 build. A truly apples-to-apples comparison would use 12-month averages, but period-end is the standard convention for benchmark exercises and the spread we show holds either way.
how often does this benchmark refresh?
Quarterly. We refresh as new 10-Ks land, with planned bumps after each quarterly earnings cycle. Next refresh target: late August 2026 once Q2 10-Qs and the late FY2025 filers land. Each refresh updates the dataModified, the variableMeasured values, and re-runs the medians. The slug stays constant so backlinks compound.