
Insights
Average CPG inventory turnover 2026: public DTC sits at 2-3 turns, private brands hit 6-12
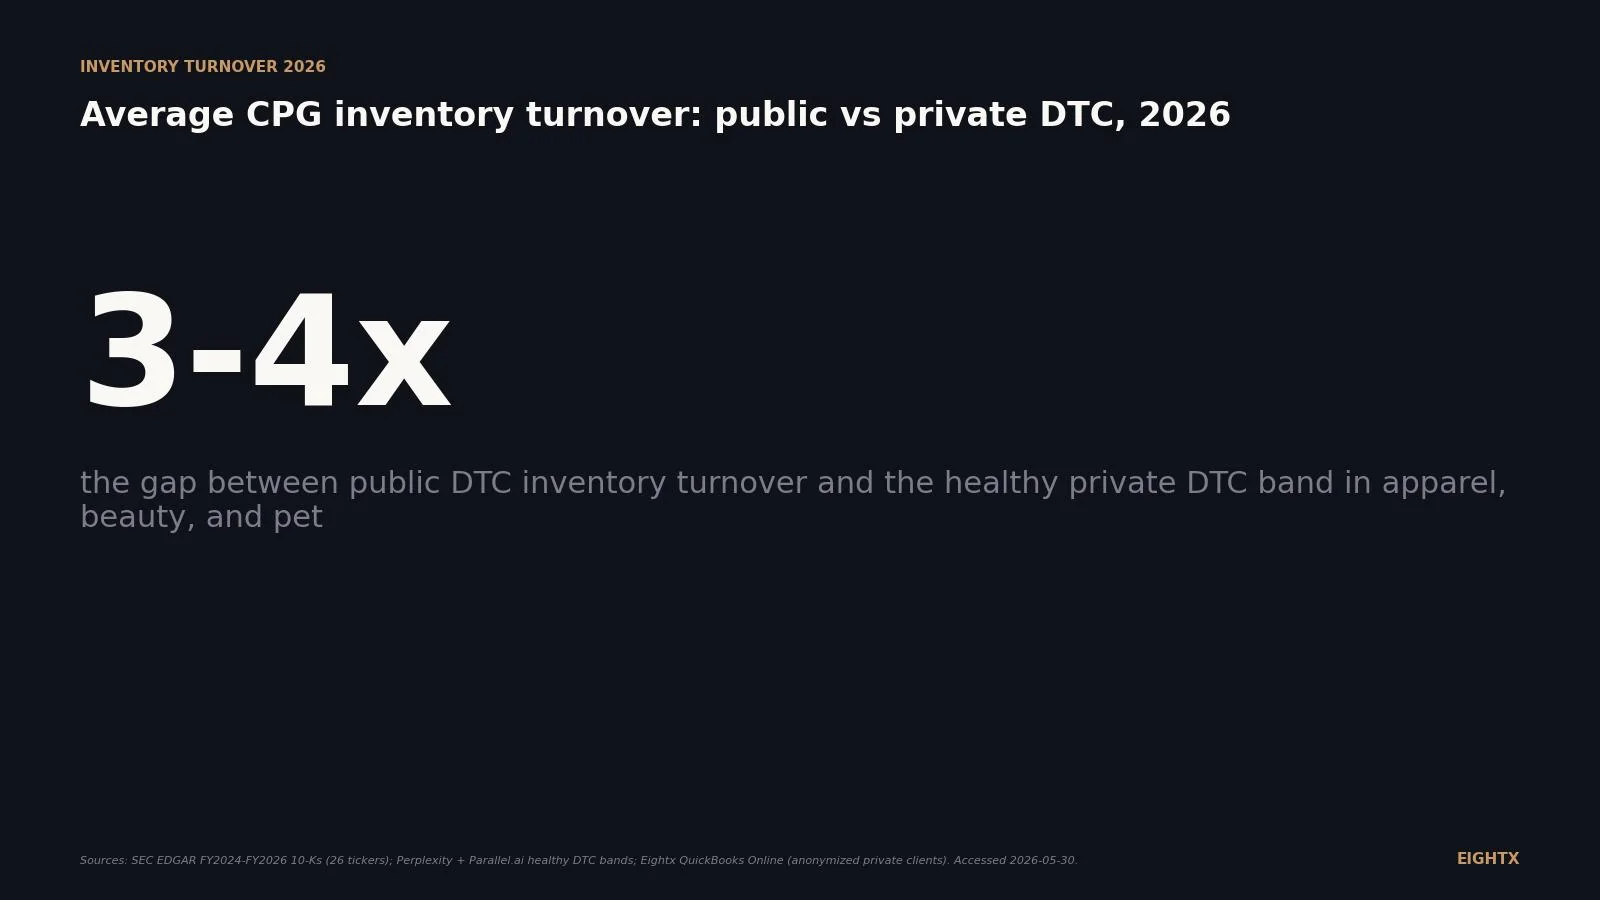
Public DTC brands turn inventory 2 to 3 times per year on average, held back by channel complexity and safety stock requirements. Healthy private DTC brands doing $5M to $50M routinely hit 6 to 12 turns because they carry fewer SKUs, hold less safety stock, and sell direct. That 3 to 4 times gap is the single biggest cash-flow lever for operators benchmarking against public peers.
Key Takeaways
- Pooled public peer median inventory turnover is 2.87 turns per year (127 days) across 26 public DTC and CPG brands, FY2024-FY2026. Range: Olaplex 1.72 to Vital Farms 15.9. Source: SEC EDGAR 10-Ks.
- The public vs private DTC gap is 3-4x in apparel, beauty, and pet. Healthy private apparel runs 6.6-12.2 turns versus a 2.61 public median. Healthy private beauty runs 5.2-8.1 turns versus a 2.17 public median.
- In food, beverage, and supplements the gap closes. Public food/bev turns at 9.61 a year, private healthy at 8.1-14.6. Shelf-life and predictable replenishment force public and private into the same band.
- Subscription beats vertical. HIMS (subscription wellness) turns 9.54 a year while USANA (supplements MLM) turns 2.31. An anonymized Eightx private apparel subscription brand turns 8.6 a year. Same vertical, 3x faster than DTC peers, because subscription billing pulls demand.
- Do not benchmark your private brand against LULU. Lululemon's 129 days of inventory is the cost of being public-scale, wholesale-heavy, and multi-geo. The right private DTC target depends on vertical and model. See the band table below.
Operators have asked us the same question all year. "What is a good inventory turnover number?" The honest answer is "compared to what?" because the public CPG peer-set median (2.87 turns a year) is 3 to 4 times slower than the band a $10M private DTC apparel brand should actually be hitting. If you have been benchmarking your turnover against Lululemon or Levi, you have been chasing the wrong number.
This is the public vs private cut of the same dataset that powers our average CPG inventory days companion post and the cash conversion cycle benchmark. We pulled FY2024-FY2026 10-Ks for 26 public DTC and CPG brands across 7 verticals, layered in two anonymized Eightx private DTC client books, and triangulated against Perplexity (3 industry benchmark sources) and Parallel.ai deep research (7 verticals). The pattern is the same in every cut: public peers sit slow, private healthy bands sit 3 to 4 times faster in slow-turn categories, and the gap collapses in food and beverage where shelf life forces the issue. This post is the playbook for closing the gap.
Public DTC turns inventory 2-3 times a year. Private DTC should be doing 5-10
The pooled median inventory turnover across 26 public DTC and CPG peers (FY2024-FY2026) is 2.87 turns per year, or 127 days of inventory on the balance sheet. Slice it by vertical and the median ranges from 2.17 in beauty up to 9.61 in food, beverage, and grocery. Beauty is the worst public vertical for turnover, supplements and electronics sit in the middle, and perishables drag the food group into double-digit territory.
The chart below shows the gap between the public peer median and the private DTC healthy band (Perplexity + Parallel.ai triangulated, midpoint shown) for the same vertical. The apparel gap is 3.6x, beauty is 3.1x, pet is 4.0x. Food, beverage, and grocery sits essentially aligned (1.18x). That is the operator headline: in slow-turn verticals, public peer medians are not the benchmark. Private healthy operating bands are.
The table below shows the full vertical breakdown alongside implied days of inventory and the gap multiplier.
Vertical Public median turnover Public median DIO (days) Private healthy turnover band Private healthy DIO band Gap (private / public) Beauty & Personal Care 2.17 168 5.2 to 8.1 45 to 70 3.06x faster Apparel & Footwear 2.61 140 6.6 to 12.2 30 to 55 3.60x faster Pet 2.24 163 8.0 to 10.0 36 to 46 4.02x faster Household / Outdoor / Home 2.47 148 3.0 to 5.0 73 to 122 1.62x faster Supplements & Wellness 4.06 90 8.0 to 12.2 30 to 46 2.49x faster Electronics 3.92 93 4.0 to 6.0 61 to 91 1.28x faster Food / Beverage / Grocery 9.61 38 8.1 to 14.6 25 to 45 1.18x faster (aligned)
What public 10-Ks say: 26 brands, 7 verticals, the turnover ranking
Walking the dataset slowest-to-fastest tells you where the structural pressures sit. Olaplex (OLPX) at 1.72 turns and Sally Beauty (SBH) at 1.73 anchor the slow end. Premium beauty brands carry months of inventory because long Asian formulation lead times force deep safety stock and a 70 percent gross margin subsidizes the working capital cost. Traditional apparel clusters at 1.8 to 2.8 turns: FIGS, Levi, Columbia, Lululemon all in band. The fast end is dominated by perishables and subscriptions: Vital Farms at 15.9 turns (egg shelf life), Sprouts at 13.93 (grocery), HIMS at 9.54 (wellness subscription), Celsius at 9.51 (high-velocity beverage).
The structural outliers tell the story most clearly:
- Olaplex at 1.72: the cost of running a premium beauty brand with 70 percent-plus category gross margins. Inventory carry is affordable so the company tolerates 212 days of stock.
- Vital Farms at 15.9: eggs have a short shelf life. Inventory cannot sit. Turnover is forced by the product, not chosen by the operator.
- Warby Parker at 7.67: eyewear is a pull model. Customers order their prescription, the lab fulfills, almost no finished goods sit. WRBY's turnover looks more like a private DTC subscription brand than a public apparel peer.
- HIMS at 9.54: wellness subscription pulls predictable demand. Smaller safety stock is sufficient because next month's COGS is largely locked in.
The full ranked dataset is in the table below.
Company Ticker Vertical Status Turnover (x/yr) DIO (days) Olaplex OLPX Beauty Public 1.72 212 Sally Beauty SBH Beauty Public 1.73 211 FIGS FIGS Apparel Public 1.82 200 Levi Strauss LEVI Apparel Public 2.10 174 Helen of Troy HELE Household Public 2.13 171 e.l.f. Beauty ELF Beauty Public 2.18 168 BARK BARK Pet Public 2.24 163 USANA USNA Supplements Public 2.31 158 Columbia Sportswear COLM Apparel Public 2.43 150 YETI Holdings YETI Household Public 2.47 148 Beyond Meat BYND Food & Beverage Public 2.52 145 Brand A (anonymized) n/a Apparel resort-wear ($12M) Private 2.75 133 Honest Co HNST Beauty Public 2.75 133 Lululemon LULU Apparel Public 2.83 129 Nu Skin NUS Beauty Public 2.89 126 Sonos SONO Electronics Public 3.57 102 Medifast MED Supplements Public 3.72 98 GoPro GPRO Electronics Public 4.38 83 Purple Innovation PRPL Home Public 5.37 68 BellRing Brands BRBR Supplements Public 5.40 68 TheRealReal REAL Resale Public 6.52 56 Freshpet FRPT Pet food Public 7.16 51 Warby Parker WRBY Eyewear Public 7.67 48 Brand B (anonymized) n/a Apparel subscription ($48M) Private 8.60 42 Celsius CELH Food & Beverage Public 9.51 38 Hims & Hers HIMS Wellness subscription Public 9.54 38 Sprouts Farmers Mkt SFM Grocery Public 13.93 26 Vital Farms VITL Food & Beverage Public 15.90 23
What private DTC actually looks like: two anonymized data points and one triangulated band
The interesting numbers in the dataset are the two private datapoints. These are original data, sourced from QuickBooks Online accrual books for two Eightx-managed brands, anonymized per agency policy. Caveat up front: both Eightx private datapoints are apparel-segment. Cross-vertical private claims in this post are triangulated from external operator benchmarks (Perplexity + Parallel.ai), not directly sampled.
Brand A. $12M revenue, premium apparel resort-wear, pure DTC. FY2025 COGS $3.27M, period-end inventory $1.19M. That works out to 2.75 turns per year, or 133 days of inventory. Sits between the public apparel median (2.61) and Lululemon (2.83). The diagnostic from a CFO call: this is too slow for a $12M private DTC brand. The right private DTC apparel band is 6 to 10 turns. Brand A is carrying roughly 2x the inventory the model requires.
Brand B. $48M revenue, apparel subscription. FY2025 COGS $21.24M, average inventory $2.47M. 8.60 turns per year, or 42 days of inventory. Same broad vertical as Brand A. 3.1x faster turnover. The mechanism is subscription billing: predictable demand lets the team carry roughly 6 weeks of stock instead of 4 to 5 months. That single structural choice (subscribe-and-save versus transactional checkout) is worth more for turnover than any SKU rationalization play. One caveat on the 8.60 figure: Brand B's COGS bucket combines product, licensing, shipping, and packaging per the brand's chart of accounts. A strict product-only COGS would lower turnover to roughly 7.4x. We cite 8.60 here to match the brand's operational reporting.
Triangulated against external operator benchmarks (Perplexity sourced Sensible, Polar, Settle, Drivepoint, Netstock; Parallel.ai sourced Sensible Forecasting, Finbox, McKinsey State of Fashion, CSIMarket), the healthy private DTC bands by vertical land where the chart at the top of this post showed:
Brand Anonymization FY end COGS (USD) Inventory (USD) Turnover (x/yr) DIO (days) Brand A $12M premium apparel resort-wear 2025-12-31 3.27M 1.19M (period-end) 2.75 133 Brand B $48M apparel subscription 2025-12-31 21.24M 2.47M (average); 2.18M (period-end) 8.60 42
Why the gap exists: 5 structural reasons
Five reasons public DTC and CPG brands operate at slower turnover than a healthy private DTC operator should.
Wholesale obligation. Lululemon, Levi, Columbia, BellRing all hold inventory waiting for retail purchase orders to drop. Pure-DTC private brands do not. Wholesale-heavy public brands sit on roughly 30 to 60 extra days of inventory versus a pure-DTC peer at the same revenue.
Scale forces safety stock. A $5B revenue brand cannot operate on the same 4-week safety stock as a $20M brand. Variability is bigger, lead times are longer, and the cost of stocking out is higher. Public-scale safety stock is a structural cost of being big.
SKU sprawl. Public brands ship 200 to 2,000 SKUs across colors, sizes, accessories, seasons, and international variants. Private DTC brands often run 15 to 50 hero SKUs. Matt on a recent client call: "When you have thousands of SKUs, it increases safety stock and is somewhat inefficient. Yet people come to us because they can get everything they want." SKU breadth is not free. It costs you days of inventory.
International reach. Multi-currency, multi-warehouse, multi-customs equals longer pipelines, which equals more buffer. Every additional jurisdiction adds days to the inventory pipeline.
High gross margin subsidizes the carry. Beauty at 70 percent-plus gross margin can hold 200 days of inventory and still print operating income. Apparel at 50 percent gross margin cannot. The peers operating at 1.7 to 2.2 turns (Olaplex, Sally, e.l.f.) are all subsidized by gross-margin headroom no private DTC brand at $5M to $50M actually has.
How to close the gap: the 6-tactic private DTC playbook
The Parallel.ai deep-research returned a 6-tactic playbook for private DTC brands moving from single-digit to double-digit turnover, with quantified impacts from McKinsey, Sensible, and CSIMarket sources. We have run versions of each with Eightx clients.
1. Systematic SKU rationalization. Tier your assortment Keep / Watch / Fix / Cut on contribution margin. Cut SKUs at under 5 percent contribution margin. Per the Parallel.ai-cited benchmarks, this typically frees up $500K to $3M in working capital and lifts operating margin 4 to 7 percentage points for a $5M to $50M brand.
2. High-frequency purchasing (JIT-Lite). Buy monthly on Net-60 terms instead of quarterly on Net-30. Reduces average inventory by roughly 40 percent. Carrying-cost reduction near $95K per year on a $5M brand (assuming a ~20 percent carrying-cost rate on the inventory released), despite a 3 percent per-unit COGS increase from smaller order sizes.
3. Drop-ship the long tail. The bottom 50 percent of your catalog goes to supplier-held drop-ship. You never own the C-tier. Eliminates 20 to 30 percent of annual carrying cost on those SKUs.
4. Pre-order and made-to-order. New SKUs launch as pre-orders. Sell before you buy. Target a dead-stock rate under 5 percent of any cohort. Brand B uses this for its capsule drops.
5. Subscription or replenishment models. Automated triggers on core SKUs. Target 6 to 10 turnover on the subscription subset of your catalog. This is the single biggest lever for slow-turn verticals. HIMS at 9.54 public turnover is the dataset proof. Brand B in this dataset is at 8.60 turns largely because of it.
6. DPO extension. Push supplier payment terms to Net-60 plus. Does not change turnover directly, but it changes the cash conversion cycle (the metric you actually care about). Pair with the cash conversion cycle benchmark calculator to see where your DSO, DIO, and DPO sit versus peers.
Two operator-voice callouts from Matt's call data on slow-moving stock.
A team member, reviewing a supplements client at September month-end: "this almost million that I have on stock right now, pretty sure that you sold something and something came in this month."
That line is why period-end snapshots are noisy and why operators should track a 3-month rolling turnover instead.
On the right tail of the inventory distribution, where aged stock turns into dead stock: "We don't have a lot of stock that's dead, we have some that aged. We've been doing some warehouse sales and whatnot to kind of move through that." Warehouse sales beat write-downs every time. Aged stock is recoverable cash if you act before it becomes dead stock.
Sources and methodology
Primary data sources. SEC EDGAR annual report filings, accessed 2026-05-30. 26 public tickers, FY2024-FY2026 most-recently-filed annual report. Eightx QuickBooks Online accrual basis (Profit & Loss + Balance Sheet), FY2025 calendar year, for two anonymized DTC apparel clients. External triangulation: Perplexity (3 industry benchmark sources including getonecart.com, efulfillmentservice.com, onrampfunds.com) and Parallel.ai deep research (7-vertical band synthesis citing Sensible Forecasting, Finbox, McKinsey State of Fashion 2025, CSIMarket Food Processing Industry data).
Tickers included (n=26). OLPX, SBH, ELF, HNST, NUS, FIGS, LEVI, COLM, LULU, REAL, WRBY, HELE, YETI, PRPL, USNA, MED, BRBR, HIMS, SONO, GPRO, BARK, BYND, FRPT, CELH, SFM, VITL. Excluded: ONON (foreign filer, 20-F not 10-K), Allbirds (taken private 2025), Stitch Fix and Revolve and Chewy (logged for v2 refresh).
Formula. Turnover = COGS divided by period-end inventory, or equivalently 365 divided by days inventory outstanding (DIO). Inventory is the period-end balance from the 10-K balance sheet (or year-end QB balance sheet for private). COGS is full-year cost of revenue from the 10-K income statement. Where Cost of Revenue is not separately disclosed (YETI 2025), COGS is computed as Revenue minus Gross Profit. Brand B uses average inventory due to material beginning-of-period vs end-of-period swing; single period-end is footnoted.
Fiscal year alignment. Most peers use a calendar FY ending December 2024 or December 2025. Non-calendar ends include LULU (Feb), HELE (Feb), YETI (late-Dec / early-Jan), SONO (Sep), BRBR (Sep), SBH (Sep), ELF (Mar), BARK (Mar), LEVI (late-Nov). Each company uses its most-recently-filed FY balance sheet paired with same-period COGS. Brand A and Brand B both calendar FY ending December 2025.
Limitations. The sample is public-company biased except for the two anonymized private datapoints. The Perplexity and Parallel.ai healthy private DTC bands are triangulated estimates from 3 to 7 sources, not a direct private-company census. Wholesale-heavy public brands (LEVI, COLM, BRBR) sit on more inventory than pure-DTC peers and reduce apparent turnover. Subscription and consignment models (HIMS, BARK, TheRealReal, Brand B) report inventory differently than transactional DTC. Both anonymized private datapoints are apparel-segment; cross-vertical private claims are triangulated, not directly sampled. Q4 vs Q1 balance sheets sit at different points in the seasonal stock cycle; this dataset's FYs cluster at Dec / Jan / Feb ends so it is more apples-to-apples than typical lender benchmarks but not perfectly so.
Update cadence. Living index. Refreshed quarterly as new 10-Ks land. Last refresh 2026-05-30. Next planned refresh 2026-08-30 after Q2 10-Qs.
For more on how inventory ties into the broader cash conversion cycle, see our cash conversion cycle benchmark calculator and the inventory days companion post. For the broader benchmark stack across margin, MER, refund rate, and NPS, see the 2026 ecommerce KPI benchmark report.
Public DTC peers turn inventory 2 to 3 times a year. Private DTC brands should be doing 6 to 12, vertical-adjusted. The gap is not aspiration. It is the cost of being public-scale, wholesale-heavy, multi-geo, and SKU-broad. If you are a $5M to $50M private DTC operator benchmarking your inventory against Lululemon, you are benchmarking against the wrong number. Find the private healthy band for your vertical, find your model (transactional vs subscription), and target the gap.
Frequently asked questions
what is a healthy inventory turnover for a private dtc brand under $50m?
Roughly 6 turns a year for a $10M Shopify DTC brand, with a healthy range of 5 to 7 turns. Adjust by vertical: apparel and pet 6 to 10 turns, beauty 5 to 8, supplements 6 to 9, subscription consumables 8 to 12, perishable food 10 to 15 plus. The single biggest driver is whether you sell on subscription (faster) or one-off transactions (slower). If you are below 4 turns and not in beauty or home, you are likely sitting on too much SKU breadth or too much safety stock.
why does my dtc apparel brand turn inventory 3x faster than lululemon?
Five reasons. LULU sits on wholesale obligations, runs 200 plus SKUs across women's, men's, and accessories, ships to 25 plus countries, holds multi-week safety stock at scale, and lets a 55 percent gross margin subsidize the carry. A $10M private DTC apparel brand has none of those structural pressures. The right benchmark for you is not LULU. It is the private healthy band of 6.6 to 12.2 turns per year.
is high inventory turnover always good or can it mean i'm stocking out?
Not always good. Turnover above 12 in apparel or beauty paired with a stock-out rate over 5 to 8 percent usually means you are underbuying, not winning. The right number to track is the pair: turns plus stock-out rate. Healthy apparel runs 3 to 5 turns with 2 to 5 percent stock-out. Healthy supplements run 5 to 9 turns with the same stock-out band. If your turnover looks great but your stock-out rate is climbing, you are leaving revenue on the table, not improving working capital.
how do i calculate inventory turnover if my balance sheet is only month-end?
Use a 3-month rolling average inventory balance, divided into trailing 12-month COGS. Period-end snapshots are noisy because purchases land lumpily. The 3-month rolling smooths out the noise without hiding the trend. If you can pull 13 month-end snapshots from QuickBooks, average them and use the average in the denominator. That matches what fractional CFOs actually do on a board pack.
should i benchmark against the public median or the private healthy band?
The private healthy band. Public peer medians for slow-turn verticals (apparel 2.61, beauty 2.17, pet 2.24) reflect wholesale, multi-geo, and high-SKU pressures that do not apply to a $5M to $50M private DTC brand. The Perplexity-triangulated healthy band is sourced from operator-facing benchmarks (Sensible, Polar, Settle, Drivepoint), which actually segment by revenue stage. That is the band you want to land in. Use the public median only to anchor what the structural floor looks like, not as a target.
why is olaplex at 1.72 turns and vital farms at 15.9 turns, same data, different planet?
Two completely different forcing functions. Olaplex sells beauty at a 70 percent gross margin with multi-month Asian formulation lead times. The high margin subsidizes 200 plus days of inventory on the balance sheet, and the long lead time forces deep safety stock. Vital Farms sells pasture-raised eggs with a 21-day shelf life. The eggs literally cannot sit. Shelf life is the structural lever that pulls food and beverage into the 8 to 16 turns band. There is no comparable lever in beauty or apparel.
does subscription billing actually let me hit 8+ turns or is that survivorship bias?
It actually works, in the data. HIMS turns at 9.54 a year on a wellness subscription model. BARK at 2.24 looks like an exception until you recognize their inventory mix includes long-lead toy SKUs sourced from Asia, not consumables. An Eightx anonymized private apparel subscription brand turns at 8.60 a year on $48M revenue. The mechanism is predictable demand. When 60 percent of next month's revenue is locked in, you can hold a fraction of the safety stock a transactional DTC brand needs. Subscription is not magic, but it is the closest thing to a turnover cheat code in DTC.
is wholesale-heavy inventory turnover a fair comparison to pure-dtc?
No. Wholesale-heavy public brands (LEVI, COLM, BellRing) sit on more inventory than pure-DTC peers because they hold stock waiting for retail purchase orders to drop. That structurally lowers turnover by 1 to 2 turns versus a pure-DTC operator at the same revenue. If you are pure-DTC, compare yourself to pure-DTC peers (LULU, ELF, FIGS, Honest) or, better, to the private healthy band. If you sell partly into wholesale, blended turnover will sit naturally lower and that is not a problem.