
Insights
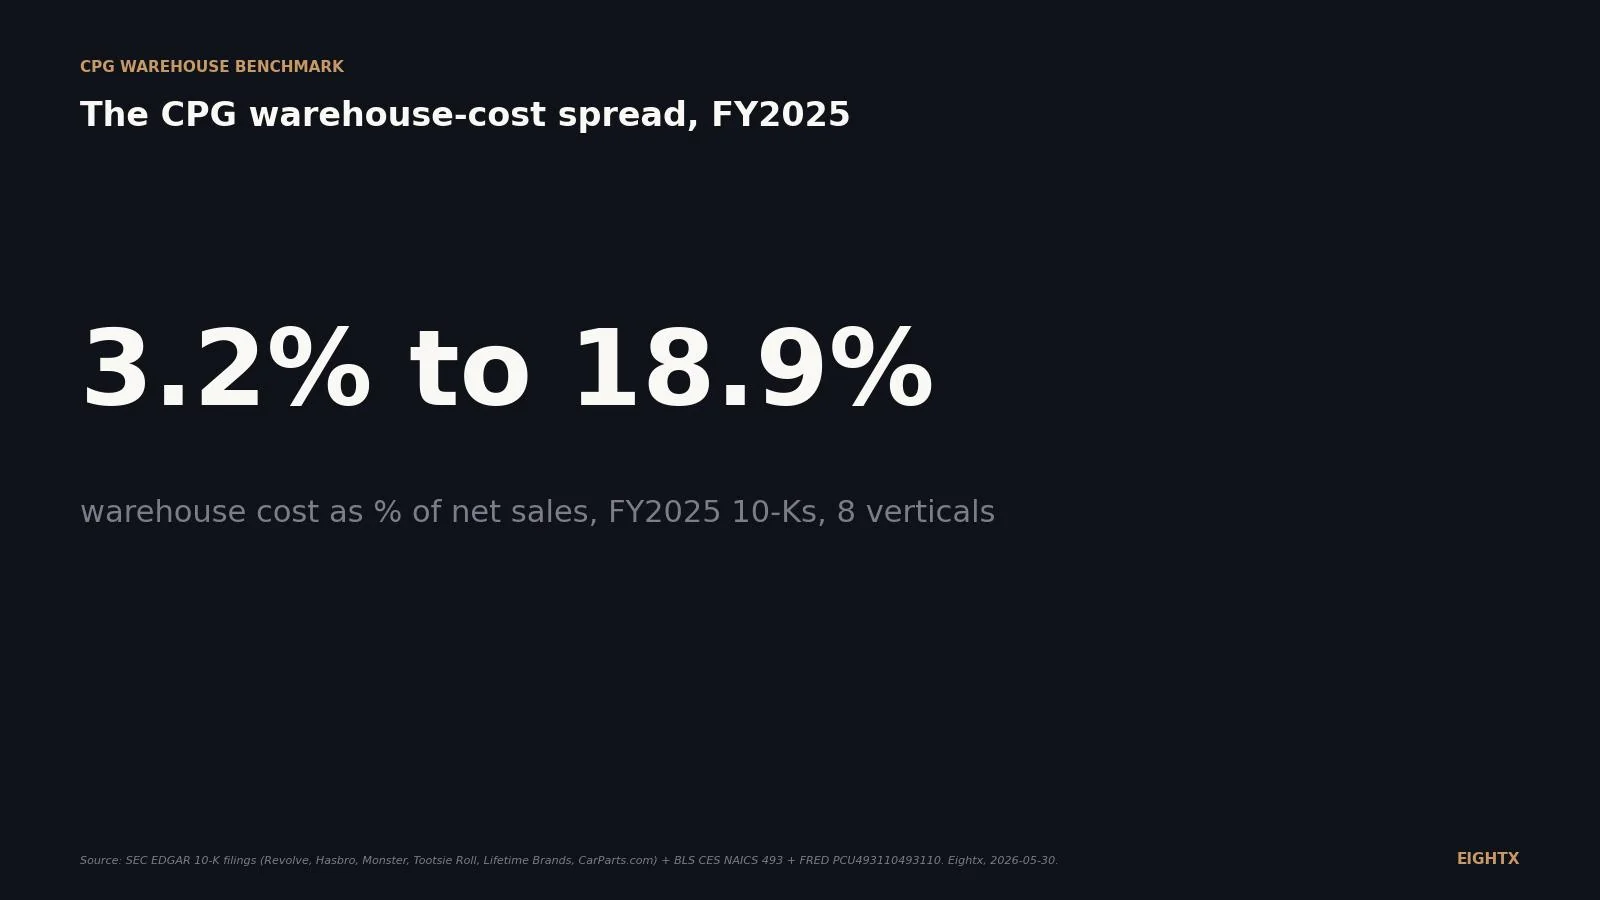
Average CPG warehouse cost as % of revenue by vertical, 2026: from 3.2% to 18.9%
CPG warehouse cost as a percent of revenue ranges from 3.2 percent (Revolve, apparel and DTC-heavy) to 18.9 percent (CarParts.com, bulky automotive) based on FY2025 10-K filings. Mid-range verticals cluster between 7 and 11 percent: Tootsie Roll at 7.8 percent and Lifetime Brands at 11.4 percent. Your vertical and order density, not size alone, determine where you land.
Key Takeaways
- Warehouse cost ratios span 3.2% to 18.9% of net sales across FY2025 public CPG and DTC 10-K disclosures. Revolve floor (apparel DTC), CarParts.com ceiling (heavy parcel-shipped auto parts).
- The spread is driven by three structural variables, not waste: product weight, channel mix (wholesale beats DTC parcel every time), and accounting placement (COGS vs distribution vs SG&A).
- Most tier-1 CPG bury warehousing inside COGS (Hershey, B&G Foods, Keurig Dr Pepper). That makes cross-vertical benchmarking from filings hard. Watch MD&A walks, not the income statement.
- Warehousing PPI is up 32.6% since January 2022 (FRED PCU493110493110) and wages are up 18.2% (BLS CES4348400003). If your ratio is flat over four years, you absorbed real cost inflation through productivity, price, or channel mix.
- International warehouse ratios run 2-3x domestic (Lifetime Brands US 10.0% vs international 26.3%). If you operate cross-border, benchmark each geography to its own peer set, not to your domestic number.
If you run finance for a CPG or DTC brand and someone asks you what your warehouse cost should be as a percent of revenue, the honest answer is: it depends on which vertical you're in by a factor of nearly six. We pulled the disclosed FY2025 warehouse, distribution, and fulfillment expense lines from 11 public CPG and DTC 10-Ks across 8 verticals, and the spread runs from 3.2% (Revolve, digitally-native apparel) at the floor to 18.9% (CarParts.com, DTC auto parts freight) at the ceiling. The driver isn't waste. It's three structural variables: product weight, channel mix, and accounting placement.
This post is a living benchmark we refresh quarterly when public 10-Ks file and when BLS and FRED publish their next monthly cuts. It gives operators (a) the actual disclosed ratio by vertical and (b) the diagnostic framework to know whether their number is good, average, or worth a 3PL renegotiation.
What public 10-K filings actually disclose, FY2025
The headline spread:
Revolve Group (RVLV) at 3.2%. Apparel DTC, digitally-native. Fulfillment expenses of $39.5M on $1,225.7M net sales (FY2025 10-K, accession 0001193125-26-071307). This is the cleanest "warehouse-only" line on the list: storage, pick-pack, receiving, inbound freight. Revolve separately discloses selling and distribution expenses of 17.1% of net sales, which captures outbound shipping plus customer service plus payment fees. The 3.2% does NOT include outbound. Don't compare your all-in number to Revolve's 3.2% and panic.
Monster Beverage (MNST) at 3.2%, freight-out only. Beverage CPG with concentrated wholesale distribution. $237.0M freight-out on roughly $7.5B net sales (FY2025 10-K, accession 0001104659-26-020831). The catch: Monster bundles warehousing inside operating expenses without a separate line item, so the disclosed 3.2% is freight-out only. The all-in is probably 4% to 5%, not directly readable from the filing.
Hasbro (HAS) at 4.4%. Toys and games CPG sold predominantly through retail. Shipping plus warehousing of $207.9M on $4,701.3M net revenues, all inside selling, distribution, and administration (FY2025 10-K, accession 0000046080-26-000011). The ratio dropped 40 basis points year-over-year from 4.8% in FY2024. Toys is asset-light from a warehousing standpoint because retail distribution does the last mile.
Tootsie Roll (TR) at 7.8%. Confectionery CPG. Freight plus delivery plus warehousing of $56.8M on $727.5M net product sales, inside SG&A (FY2025 10-K, accession 0001104659-26-021621). One of the cleanest cross-line disclosures in the dataset. Ratio improved 20 basis points year-over-year on price increases.
Lifetime Brands (LCUT) at 11.4% consolidated. Housewares and kitchen CPG. Distribution expenses of $74.1M on $647.9M net sales, broken out as its own line (FY2025 10-K, accession 0000874396-26-000008). The US segment ran 10.0%; the international segment ran 26.3%. Bulky low-AOV product category with import-heavy supply chain. Excluding warehouse-redesign costs and international, the US "distribution as % of sales-shipped-from-Company-warehouses" was 9.6%, basically flat from 9.7% in FY2024.
CarParts.com (PRTS) at 18.9%, freight + fuel alone. DTC auto-parts ecommerce. Freight plus fuel surcharge of $103.5M on $547.5M net sales (FY2025 10-K, accession 0001378950-26-000035). On top of that: rent and facilities of $13.6M (2.5%) plus fulfillment-related payroll of roughly $25M to $30M. All-in warehouse-including-freight lands at roughly 22% to 24% of net sales. Heavy, bulky, parcel-shipped to homes is the worst-case warehouse plus freight burden you can run.
The operator takeaway: your competitor's ratio is only useful if their accounting convention matches yours. Match the line-item label first, then divide by net sales, then compare. Otherwise you're comparing apples to crates.
The three structural variables behind the spread
Once you account for accounting convention, almost all of the cross-vertical spread is explained by three things.
Product weight and bulk. Heavy and bulky products cost more to ship per order (carriers charge dimensional weight), occupy more cubic feet per dollar of revenue (so storage costs more per revenue dollar), and often need LTL pallet moves rather than container parcel for inbound. CarParts.com's 18.9% freight ratio is a structural ceiling for the category, not a CarParts-specific failure. Auto parts, furniture, large appliances, and oversize home goods all live in the 10% to 18% band even with top-quartile operations.
Channel mix. Wholesale shipments to a small number of distributor warehouses cost dramatically less per dollar of revenue than DTC parcel shipments to many individual homes. Hasbro's 4.4% reflects retail distribution doing the last mile. Monster's 3.2% reflects a concentrated wholesale beverage network. A pure DTC brand in either category would run 8% to 12% on the same products. If your channel mix is shifting from wholesale to DTC, expect the ratio to rise even if nothing else changes.
Accounting placement. Some companies put warehouse cost inside COGS (Hershey, most tier-1 packaged food). Some break it out as distribution expense (Lifetime Brands). Some put it inside SG&A (Tootsie Roll). The same dollar of warehouse spend shows up as a different ratio depending on the denominator and placement. When you benchmark, pull the MD&A for each peer and confirm which buckets are inside their line.
A blunt 2x2 to keep in mind:
Product profile Wholesale-heavy DTC parcel-heavy Light, small, high AOV 2 to 4% of revenue 3 to 6% Heavy, bulky, low AOV 5 to 8% 12 to 22%
The macro picture: real cost is up 30% since 2022
If your warehouse-cost-as-percent-of-revenue is flat over the last four years, that does not mean nothing happened. The underlying cost stack moved hard. The brands holding the ratio steady absorbed inflation through price, productivity, or channel mix. None of them got a free pass.
Warehousing PPI (FRED PCU493110493110): 132.6 in April 2026, up 32.6% over four years. This is the price warehouses charge their customers. A direct read on 3PL pricing power. The series rose 5.7 points (from 126.9 to 132.6) in the four months to April 2026, continuing the upward trajectory that resumed in early 2025.
Warehouse wages (BLS CES4348400003): 118.2 in March 2026, up 18.2%. Average hourly earnings hit $33.25 in March 2026 (preliminary), still climbing 4%+ year-over-year. Wages have not rolled over.
Warehouse employment (BLS CES4348400001): 94.4 in April 2026, down 5.6% from the January 2022 baseline. The sector has been contracting since the December 2022 peak. 3PLs over-hired during peak shipping and have been right-sizing ever since.
The combination (output price up 33%, labor up 18%, headcount down 6%) tells you the warehouse sector has more pricing power than it did before 2022, and that pricing power is being passed through to operators. If your ratio is flat, you absorbed the move. If your ratio is up by 50 basis points or more per year, you passed it through partially. If your ratio is up by 100+ basis points per year, your 3PL or internal operation is the variable, not the macro.
Operator playbook: target band by vertical
This is editorial calibration from the FY2025 10-K data above plus our reads of operator P&Ls. No single industry association publishes a cross-vertical benchmark at this granularity (WERC, Establish Davis, and CSCMP all aggregate differently), so we built our own band off the public disclosures.
Vertical Target band (Eightx) What's average When to renegotiate DTC apparel (light, parcel-shipped) 3 to 5% 4 to 6% >6% sustained 2 quarters DTC beauty and supplements (light, small) 3 to 5% 4 to 6% >6% Beverage CPG (heavy via distributor) 3 to 5% 4 to 5% >5% with no channel mix change Toys and games CPG 4 to 6% 5 to 7% >7% Confectionery and packaged food CPG 5 to 8% 7 to 9% >9% Housewares and kitchen CPG (US) 7 to 10% 9 to 11% >11% DTC auto parts and bulky goods 10 to 14% (freight-heavy) 12 to 16% >16% on freight before negotiating fuel surcharge International CPG 1.5 to 2x your US ratio 2 to 2.5x >3x means geography itself is the problem
A few notes on how to use the table. The "target band" is what a well-run operation at scale should achieve in that vertical. "Average" is the realistic middle of the distribution we see. "When to renegotiate" is the threshold past which the 3PL or internal warehouse should be on the agenda. If you're International CPG and your ratio is more than 3x your US ratio, the answer isn't to renegotiate the 3PL contract. The answer is to revisit whether that geography belongs in your distribution footprint at all.
How to read your own warehouse line: 4-step diagnostic
This is the operator workflow we run with clients before any 3PL renegotiation.
Step 1: classify by weight, channel, and AOV. A light parcel-shipped DTC apparel brand at $80 AOV is in a different category from a heavy DTC auto-parts brand at $60 AOV. Both ship parcel; both have similar AOV. The weight delta drives an 8x spread in warehouse-cost ratio.
Step 2: identify your line-item label. Internal P&Ls and 3PL invoices use inconsistent terminology. Is the cost you're calling "warehouse" actually fulfillment (storage + pick-pack + receiving)? Distribution (warehouse + outbound freight)? Freight-out (outbound shipping only)? Pick a convention and apply it consistently. Tootsie Roll's 7.8% bundles freight, delivery, and warehousing into one line. Revolve's 3.2% is warehouse-only. If you don't know what's in your own line, you can't compare it to either.
Step 3: compare to the right peer set. Use the table above for the band. For sharper benchmarks, pull two or three public companies in your specific vertical and weight class from the FY2025 10-Ks above. Read their MD&A to confirm line-item composition, then run your ratio against theirs on the same definition.
Step 4: decide between renegotiate and accept. If you're above the renegotiation threshold and your volume is flat or growing, you have room to push a private 3PL because the sector cushion is gone (employment down 5.6%, wages up 18% since 2022). If you're above threshold but your ratio is flat year-over-year, the issue is structural (channel mix, product profile) and the 3PL conversation won't move the needle. Fix structure first; price second.
For a deeper read on the 3PL renewal conversation specifically (asking ranges for storage, pick-pack, fuel surcharge structure, when to re-bid versus renegotiate), see our 3PL Cost Index 2026, which complements this benchmark with the BLS plus FRED time-series view. For the broader macro labor read, the DTC layoff and hiring tracker covers what's happening to public-company workforces and what it means for fulfillment capacity.
Your competitor's ratio is only useful if their accounting convention matches yours. Match the line-item label first, then divide by net sales, then compare. Otherwise you're comparing apples to crates.
Sources and methodology
SEC EDGAR 10-K filings, FY2025. Every disclosed ratio above was extracted from FY2025 10-K filings filed between February and May 2026. We verified each line-item label, dollar value, and net-sales denominator against the actual MD&A or financial statements in the primary filing. Accession numbers are included in the data tables and isBasedOn schema. Pulled from SEC EDGAR full-text search 2026-05-29.
Vertical assignments. SIC codes used: 5961 (Catalog/Mail-Order Houses, applied to Revolve and CarParts.com), 3944 (Games and Toys, Hasbro), 2086 (Bottled and Canned Soft Drinks, Monster Beverage), 2060 (Sugar and Confectionery, Tootsie Roll), 3420 (Cutlery, Handtools and Hardware, Lifetime Brands). We grouped by operational profile (weight, channel, AOV) rather than strictly by SIC, since the SIC bucket sometimes obscures the warehouse-cost-relevant economics.
Why several tier-1 CPG names are missing. Hershey, General Mills, Kellanova, B&G Foods, Westrock Coffee, Lifeway Foods, and Keurig Dr Pepper all bundle warehousing inside COGS without separate disclosure or roll it into a broader transportation-and-warehousing walk in MD&A without a clean dollar figure. We pulled the ratios where they exist; for the others we noted the disclosure gap. This is a real limitation: tier-1 packaged-food CPG systematically obscure warehouse cost in their filings. Operators benchmarking against them have to estimate.
BLS CES warehousing and storage, NAICS 493. Series IDs CES4348400003 (average hourly earnings, all employees, seasonally adjusted) and CES4348400001 (all-employees employment, seasonally adjusted). Pulled via BLS public API on 2026-05-29 for the January 2022 through April 2026 window. Latest wage data point is March 2026 (preliminary). Latest employment data point is April 2026 (preliminary).
FRED PPI Warehousing and Storage. Series PCU493110493110, monthly, NSA. Pulled 2026-05-29. Latest observation April 2026. This is the producer price index for general warehousing and storage services. Methodologically it's the output price warehouses charge their customers, which is why it's the right macro proxy for "what your 3PL bill is doing."
Indexing methodology. Each macro series rebased to January 2022 = 100. For monthly series with January 2022 value V0, the indexed value at month t equals (Vt / V0) times 100. No additional seasonality adjustment beyond the source-provided seasonal adjustment (wages and employment are SA; PPI is NSA).
Limitations. Warehouse cost is not a single GAAP line. Companies vary in whether they include warehouse payroll, facility rent and depreciation, inbound receiving, inventory management, pick and pack labor, outbound freight, or reverse logistics. Each disclosed number means something slightly different. The cross-vertical benchmarking is only as good as the line-item labels you map onto. Lifetime Brands' international ratio (26.3%) reflects structural differences in distributor and logistics models abroad, not a clean apples-to-apples benchmark. CarParts.com's 18.9% is freight + fuel alone; the all-in including fulfillment payroll runs 22% to 24%. We've flagged each caveat at the data point above.
Update cadence. Annual (10-K disclosures) plus quarterly (BLS plus FRED macro). Next natural refresh: late August 2026 when Q2 BLS and FRED data land, then February through May 2027 for the next 10-K filing window.
Frequently asked questions
what should my warehouse cost be as a % of revenue if i'm a 7-figure dtc apparel brand?
3% to 5% of revenue is the realistic target band, with 4% to 6% being average. Revolve, the closest public peer (digitally-native apparel DTC), disclosed 3.2% in FY2025 on $1.23B in net sales. At 7-figure scale you'll likely run slightly higher because your storage and pick-pack lines don't enjoy Revolve's volume discounts. If you're north of 6% sustained for two quarters, the issue is usually packaging weight, zone mix, or a 3PL contract that hasn't been renegotiated since 2022.
should warehouse expense be in cogs or in opex on my p&l?
There's no single right answer and public CPG split both ways. Tootsie Roll puts freight, delivery, and warehousing inside SG&A. Lifetime Brands shows distribution as its own operating-expense line. Hershey and most tier-1 packaged food bury it inside COGS. The internal rule of thumb: if your warehouse cost moves directly with units shipped (pick-pack, outbound freight), it belongs in COGS or as a separate distribution line right under gross margin. If it's mostly fixed (rent, supervisor salaries, WMS license), opex is fine. Pick a convention and hold it for at least two years so your year-over-year ratio is comparable.
is 12% warehouse cost too high for a housewares brand?
It's at the high end but not necessarily a red flag. Lifetime Brands' consolidated FY2025 ratio was 11.4% (US segment 10.0%, International 26.3%). The US 9.6% figure excluding warehouse-redesign costs is roughly the floor for asset-heavy housewares with import-heavy supply chains. If you're at 12% and growing, you're inside the band. If you're at 12% and flat or shrinking, the line is creeping. Check whether inbound freight from Asia (the dominant cost driver for kitchen/housewares) is the variable that moved, or whether 3PL storage minimums have crept past your turnover.
how do i benchmark my 3pl bill against public-company disclosures?
Match the line-item label first. Public companies use different terms (fulfillment, distribution, freight-out, shipping and warehousing) and each captures different cost buckets. Pull the FY2025 10-K for your closest peer (Revolve for apparel DTC, Hasbro for toys, Tootsie Roll for confectionery, Lifetime Brands for housewares, CarParts.com for heavy DTC). Read their MD&A for what's actually inside the line, then map your own warehouse P&L to the same buckets. Only then divide by net sales. Comparing your gross warehouse spend to Revolve's clean fulfillment line without unbundling outbound shipping will overstate your ratio by 2 to 3 percentage points.
why is warehouse cost as a % of revenue higher for heavy products?
Three reasons compound. One, heavy products cost more to ship per order (parcel carriers charge dimensional weight). Two, they take more cubic feet per dollar of revenue, so storage cost per revenue dollar is higher. Three, they often need more inbound freight (LTL pallet moves instead of container parcel) which sits in or near the warehouse line on most P&Ls. CarParts.com's 18.9% freight + fuel ratio reflects all three, plus parcel-shipped-to-homes economics. If your category is bulky and DTC, plan for 10% to 16% as the realistic ceiling, not 5%.
what's the difference between fulfillment expense and distribution expense in 10-K filings?
There isn't a single GAAP standard, so the term means whatever the company defines. Revolve uses fulfillment expenses for warehouse-specific cost (storage, pick-pack, receiving). Lifetime Brands uses distribution expenses for the same thing. Hasbro lumps shipping and warehousing into one line inside selling, distribution, and administration. CarParts.com separates freight + fuel from fulfillment expense (warehouse payroll + facilities + depreciation + inventory management). When you compare two companies, read the MD&A to confirm which cost buckets are inside each line. The labels are not interchangeable.
has warehouse cost gotten more expensive over the last 4 years if my ratio is flat?
Yes, materially. The warehousing PPI (the output price warehouses charge customers) is up 32.6% since January 2022, and warehouse wages are up 18.2% over the same period. If your ratio is flat, you either passed cost through to customers (price increases), absorbed it via productivity (fewer warehouse FTEs per unit shipped), or shifted channel mix toward wholesale. The brands that look stable in their 10-Ks did some combination of all three. None of them got a free pass.
how do i know if my warehouse cost is good or just average?
Compare to the right peer set, then compare to your own historical band. The peer-set comparison: pull two or three public companies in your vertical and your weight class. The historical comparison: graph your warehouse-line-as-percent-of-revenue monthly for 24 months. If you're trending up by more than 50 basis points per year without volume falling, you're losing the productivity battle even if your absolute number looks fine. Good means below your vertical median AND flat or improving year-over-year. Either one alone isn't enough.