
Insights
Average ecommerce AOV by revenue band 2026: $60 at $1M, $150 at $100M+
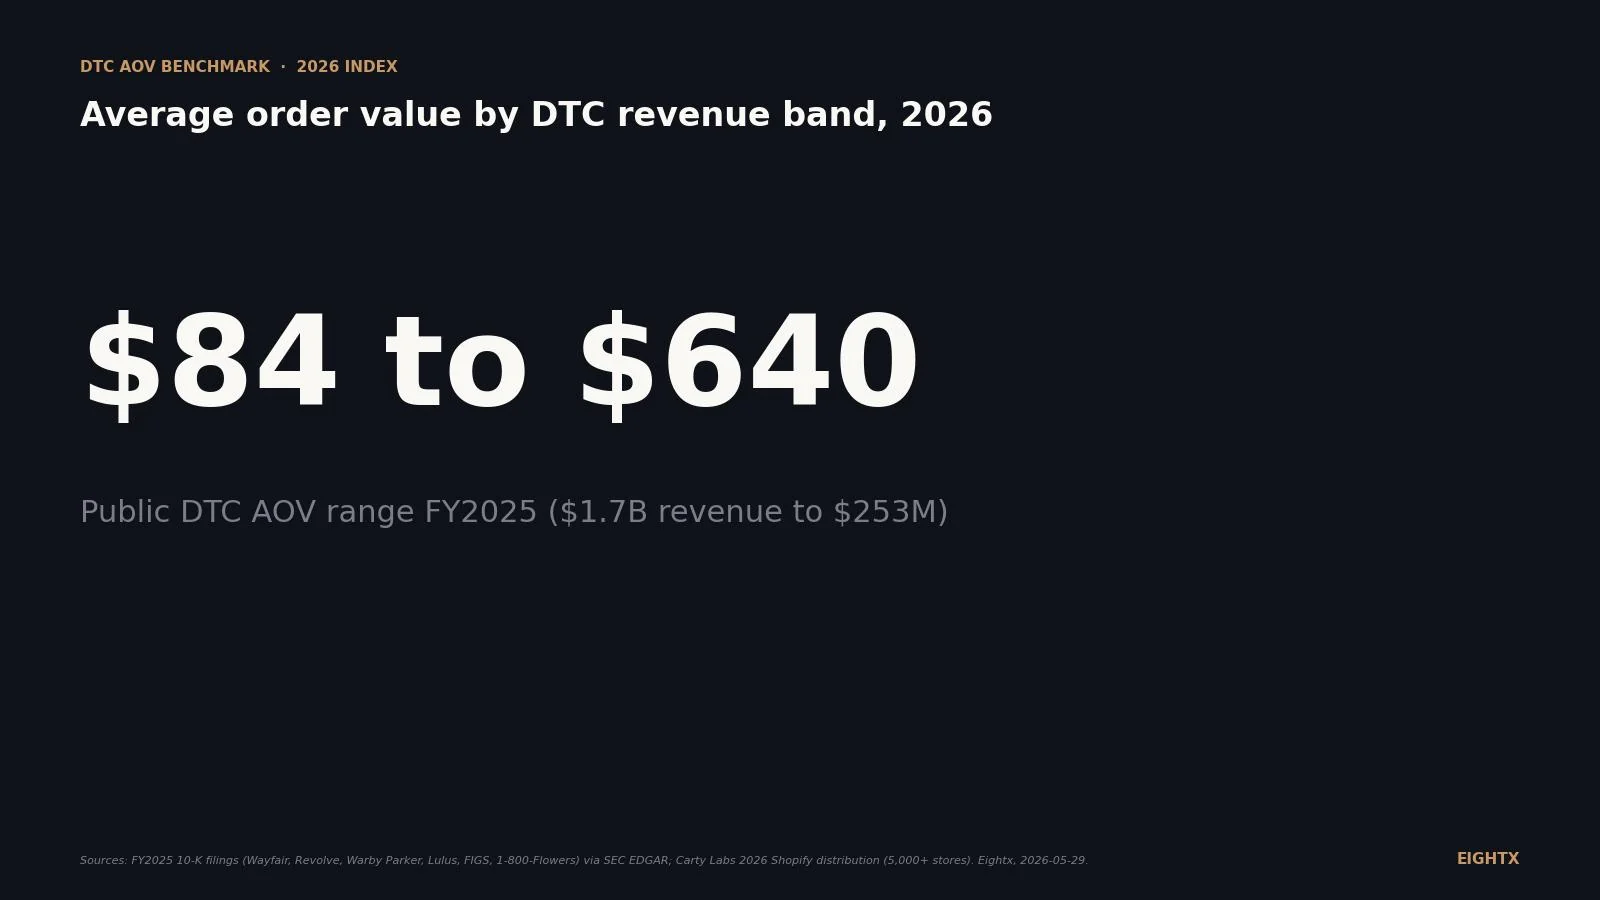
Average order value scales with revenue band, running roughly $60 at $1M and $150 at $100M or more for private Shopify brands. FY2025 public DTC AOVs range from $84 at 1-800-Flowers ($1.7B revenue) to $640 at Revolve FWRD ($253M revenue). AOV growth is a lever that compounds because it improves contribution margin on every order without requiring additional traffic spend.
Key Takeaways
- Public DTC AOV is set by brand positioning, not scale. FY2025 disclosures range from $84.72 at 1-800-Flowers (revenue $1.69B) to $640 at Revolves FWRD luxury segment (revenue $253M). A 7.5x AOV gap inside a 6.7x revenue gap, with the bigger brand sitting at the lower AOV.
- The typical Shopify median is $65 to $110. Across 5,000+ stores in the 2026 Carty Labs distribution, the bottom decile sits under $40, the top decile clears $180. Most $1M to $10M private brands sit at or below the platform median.
- Median AOV climbs from $60 at $1M revenue to $150 at $100M+. The lift is real but discontinuous: $40 to $80 typical at $1M, $60 to $110 at $5M, $80 to $150 at $25M, $100 to $220+ at $100M+. Top-quartile brands stack three levers (free-ship threshold, bundles, subscriptions) and hold above the band median at every stage.
- ARPC is not AOV. Warby Parker reports Average Revenue per Customer ($324 in FY2025), which is LTM revenue divided by active customers, closer to annual revenue per buyer including repeats. Operators routinely conflate the two and benchmark against the wrong number.
- There is no realistic path to $50M+ DTC revenue at sub-$50 AOV without extreme order velocity. Math says it: at Shopify benchmark CVR of 2.5 to 3%, $50M requires ~20M sessions per year if AOV stays at $50. That session volume is fast-fashion / print-on-demand territory, not most categories.
Most operator-facing AOV benchmarks segment by vertical (apparel vs. beauty vs. supplements), not by revenue band. That is the gap. The question every $1M to $50M DTC founder actually asks is "what should my AOV be at my stage?" This post fills the gap by triangulating three primary sources: public DTC AOVs disclosed in 2025 to 2026 10-K filings (Wayfair $312, Warby Parker $324 ARPC, Revolve $299, FWRD $640, Lulus $140, FIGS $120, 1-800-Flowers $84.72), the 2026 Carty Labs Shopify distribution (5,000+ stores: median $65 to $95, top decile $180+), and the unit-economics constraint that hitting $1M, $5M, $10M, $25M+ at typical Shopify CVR forces certain minimum AOV bands.
For the durable cross-vertical AOV cut (apparel, beauty, supplements, furniture) that pairs with this revenue-band view, see average AOV by ecommerce vertical. This post is the revenue-band cut.
The benchmark every operator wants doesn't exist (and what to use instead)
Vertical AOV benchmarks are everywhere. EasyApps, Carty Labs, Klaviyo, Shopify, Littledata, and Growth Suite all publish 2026 numbers for apparel, beauty, supplements, furniture, and the other big buckets. Revenue-band benchmarks are not. The reason is structural: the data providers run their benchmarks off platform telemetry (Shopify, Klaviyo, GA4) that doesn't carry a clean "annual revenue" tag per store. So the public datasets cut by vertical because that is what they can see.
The workaround is to triangulate. Three datasets together get you to a usable revenue-band view. Public DTC 10-Ks give you the $100M+ to $12B disclosures with hard numbers. The Shopify distribution gives you the $1M to $30M range as a percentile cut (you find your bucket by where your AOV sits, not by what your revenue is). And the unit-economics constraint (Revenue ≈ Sessions × CVR × AOV) gives you the minimum AOV math at each band.
Headline finding from the triangulation: public DTC AOV ranges from $84.72 at 1-800-Flowers (revenue $1.69B) to $640 at Revolves FWRD luxury segment (revenue $253M). That is a 7.5x AOV gap inside a 6.7x revenue gap, with the bigger brand at the lower AOV. Scale does not drive AOV. Brand positioning, category, and lever stack do.
What the 10-Ks actually disclose: AOV at $300M+ scale
Six public DTC and ecommerce brands disclosed AOV (or the closest proxy) in their FY2025 10-K filings. The numbers are below in a single reference table, then walked through one by one.
Brand (ticker) FY2025 revenue ($M) AOV ($) Orders / customers Note 1-800-Flowers (FLWS) 1,689 84.72 17.3M orders E-commerce AOV; down 1.1% YoY FIGS (FIGS) 560 120 LTM rev/customer $216 AOV up from $113 in 2024 Lulus (LVLU) 326 140 2.33M active customers AOV up from $137 in 2024 Revolve REVOLVE segment (RVLV) 968 279 9.48M total orders Premium full-price fashion Revolve FWRD segment (RVLV) 253 640 (blended in 9.48M) Luxury fashion Warby Parker (WRBY) 872 324 (ARPC) 2.7M active customers ARPC, not single-order AOV Wayfair (W) 12,457 312 40M orders delivered Three-year lift from $292 to $312
Walk through the spread and the pattern is clear. Wayfair at $312 has run three straight years of low-single-digit AOV growth at $12B+ scale (up from $292 in FY2023). The growth is product mix and category shift, not promotional. At the $100M+ band, AOV growth is brand and consumer-mix shifts, not levers.
Revolve at $299 blended ($279 / $640 by segment) is the cleanest natural experiment in this dataset. Same parent company, same checkout, same fulfillment, 2.3x AOV gap between segments. The only variable is positioning. REVOLVE is premium fashion, FWRD is luxury. If you have ever wondered whether positioning sets your AOV ceiling more than anything else, Revolve's 10-K answers the question.
Warby Parker's $324 ARPC is the most-misread number in DTC benchmarking. ARPC is annual revenue per active customer (LTM revenue divided by active customers, 2.7M of them). It is not single-order AOV. The single-order AOV is lower (likely $180 to $220 based on eyewear pricing) but Warby Parker has high repeat purchase rates so ARPC is the business metric that matters to them. Treat ARPC as a different metric and do not benchmark your AOV against it.
Lulus at $140 and FIGS at $120 sit in the apparel range. Both held or lifted AOV while broader business metrics moved around them (Lulus net revenue declined 17% over three years; FIGS held flat). AOV is a more durable metric than revenue because it is a product mix and pricing decision, not a demand decision.
1-800-Flowers at $84.72 on $1.69B revenue is the proof point that high revenue does not require high AOV. Gifting and perishables run high frequency and lower ticket. The trade-off is order volume: 17.3M orders a year is 47,000 orders a day, which is operational complexity most $1M to $10M brands cannot scale into.
Where your store sits on the 2026 Shopify distribution
The cleanest published distribution for sub-$30M Shopify stores comes from Carty Labs (2026 benchmark, 5,000+ Shopify and Shopify Plus storefronts cross-referenced with Klaviyo and Littledata). The buckets and bands sit below.
Find your bucket: if your AOV is under $40 you are in the bottom 10% of Shopify stores. $40 to $65 is bottom quartile. $65 to $110 is the median band (most stores cluster here). $110 to $180 is top quartile. Above $180 is top decile. The honest read is that most $1M to $10M private brands sit at or below the platform median, and only the brands that consciously stack the AOV levers break $120 at scale.
The vertical context matters. A $90 AOV is median if you sell apparel, low if you sell furniture, high if you sell beauty or supplements. A useful gut check is to read your AOV against both your vertical's median (from EasyApps or Carty Labs vertical tables) and the platform-wide percentile above. If you are below your vertical median AND at the platform median, your real problem is category-relative pricing and bundle structure. If you are at your vertical median but at the platform bottom quartile, your category just runs low-AOV and the lever to pull is order frequency and LTV, not AOV.
Working AOV ranges by DTC revenue band: a planning model
This is the synthesized view. Across the public 10-K disclosures (where revenue is known cleanly) and the Shopify distribution (where percentile is known cleanly), and constrained by the math that Revenue ≈ Sessions × CVR × AOV at typical Shopify CVRs (2.5% to 3%), the working AOV ranges by revenue band line up as below.
Revenue band Typical AOV range Position on Shopify distribution $1M $40 to $80 Bottom quartile to median $5M $60 to $110 Median to 75th percentile $10M $70 to $130 Median to top quartile $25M $80 to $150 Top quartile typical $50M $90 to $180 Top quartile to top decile $100M+ $100 to $220+ Top decile typical
The unit-economics constraint that builds the table: at $1M revenue you need either ~400K sessions per year at $83 AOV, or 250K sessions at $133 AOV. At $25M+ you can hold $80 to $150 AOV with 5M+ sessions per year. There is no realistic path to $50M+ DTC revenue at sub-$50 AOV without extreme order velocity (rare outside fast-fashion or print-on-demand). The math forces you up the AOV curve as you scale unless you have built an unusual category structure.
The three levers that actually move AOV
Three levers do most of the work. Set them in order.
Free-shipping threshold, 15% to 25% above current AOV. This is the cheapest, fastest AOV lift in DTC. The mechanic: when the threshold sits above your AOV, a meaningful share of buyers add product to clear it. Typical lift is 8% to 18% in the first 30 days with no other changes. The threshold is also the only AOV lever you can A/B test cleanly because the rest of the funnel is unchanged. Set, measure, move up another 10% if order count holds. Move down if order count drops more than 5%.
Bundles, 20% to 35% AOV lift. Pre-built bundles (curated SKU sets at a small discount) and dynamic bundles (build-your-own with quantity break) both work. The case-study range across EasyApps, Klaviyo, and Recharge published examples sits at 20% to 35% AOV lift on the bundle pageviews. The blended impact on storewide AOV depends on bundle traffic share. The implementation is heavier than threshold (you need product strategy, not just a setting) but the lift compounds.
Subscriptions, 10% to 21% AOV lift on subscriber cohort, plus LTV. The slowest lever to pull but the most durable. Public Orveon and Chaz Dean Recharge case studies show 10% to 21% AOV lift on the subscribed cohort, and the LTV multiplier (typically 2.5x to 4x at $20M+ scale) is the larger prize. The trade-off: subscription acquisition cost runs 1.3x to 1.6x AOV at scale (per Matt's call notes across 20+ subscription-anchored brands), so the unit economics need to support the front-loaded CAC.
The stack works because the levers are additive, not substitutive. A $5M brand at $65 AOV that ships threshold at $80, builds two bundle SKUs at $120 to $150, and adds a 30% subscriber base can move blended AOV to $90 to $110 inside 6 months. That is the move from Shopify median to top quartile inside one revenue band.
AOV climbs with revenue but the lift is discontinuous, not linear. The median $1M brand sits at $40 to $80. The median $100M+ brand sits at $100 to $220+. The 2.5x lift across two orders of magnitude in revenue happens because category, positioning, and lever stack are the actual variables. Scale is a side effect, not a driver.
How to use these benchmarks this quarter
Three reads to do this week.
Read your AOV against your vertical's top quartile (EasyApps or Carty Labs 2026 vertical table). If you are below the vertical top quartile, the lever is product mix, bundle structure, or threshold. If you are at or above, your category-relative pricing is doing its job.
Read your AOV against your revenue band (Table 2 above). If you are at the top quartile of your revenue band, you are positioned correctly for the next stage. If you are at the band median, you are positioned to stay where you are. If you are at the band low end, your next scale step will be expensive because traffic and CAC scale with order count, not revenue.
Read your free-shipping threshold against your current AOV. If the threshold is at or below AOV, you are giving margin without changing behavior. Move it 15% to 25% above. Measure for 30 days. This is the only AOV move that costs nothing to test.
For the apex pillar on DTC fractional CFO work that ties pricing, AOV, and unit economics together, see fractional CFO services for ecommerce brands. For the cross-vertical AOV cut, see average AOV by ecommerce vertical.
Sources and methodology
SEC EDGAR full-text search. AOV disclosures were pulled from public-company 10-K filings via EDGAR full-text search, query "average order value", forms=10-K, date range 2025-01-01 to 2026-05-29 (81 matches). The seven brands retained had directly-disclosed AOV (or, in Warby Parker's case, Average Revenue per Customer) for FY2025. Wayfair, Revolve, Warby Parker, Lulus, FIGS, and 1-800-Flowers are predominantly DTC. Wayfair is included as the high-AOV ceiling reference and is technically a marketplace and private-label hybrid. ELF Beauty, BARK, and Honest Co were excluded because they do not report a clean single-order AOV (BARK reports ARPU per box, Honest is private post-2024 take-private, ELF rolls AOV into aggregate metrics).
Carty Labs Shopify AOV benchmark (2026). The platform-wide percentile distribution comes from the 2026 Carty Labs benchmark, drawn from 5,000+ Shopify and Shopify Plus storefronts cross-referenced with Shopify, Klaviyo, and Littledata public benchmarks. The five-bucket percentile cut (bottom decile, bottom quartile, median, top quartile, top decile) is what they publish.
Eightx working model (revenue-band table). Table 2 is a synthesized model, not a single published dataset. Inputs: the Carty Labs distribution above, EasyApps 2026 vertical AOV tables, the FY2025 public DTC 10-K disclosures, and the Shopify benchmark CVR (2.5% to 3% blended) constraint. The math: at any given revenue band, AOV must support session and CVR realities (Revenue = Sessions × CVR × AOV), which sets a working minimum AOV per band. The top-quartile line is read off the FY2025 public disclosures for that revenue scale.
Storeleads spot checks. Allbirds, Olaplex, BARK, Honest, and Vita Coco were checked through Storeleads for average product price (Allbirds $83.95, Olaplex $13.06, BARK $13.03, Honest $25.83, Vita Coco $19.17). These are average product prices, not AOVs, and are useful only as directional reads on category positioning. Storeleads does not publish AOV per store.
Limitations. No single public dataset cleanly maps "DTC AOV by revenue band" because the benchmark providers cannot see annual revenue per store in their telemetry feeds. Table 2 is an analyst model, not a survey result. Warby Parker reports ARPC, not AOV, and we have flagged the distinction throughout. 10-K AOV figures are blended (e-commerce plus retail where applicable) and Warby Parker has 323 retail stores that dilute their channel-blended ARPC. Wayfair, Revolve, Lulus, and FIGS are predominantly DTC. The Storeleads revenue-band filter (min/max monthly sales) was non-functional in this run, so we could not produce a clean Storeleads-derived AOV median per band as a fourth triangulation leg. The spot checks above are average product prices, not AOVs.
Update cadence. This index is refreshed quarterly as new FY 10-Ks land and the Shopify distribution providers update their benchmarks. Next refresh target: August 2026 (Q2 earnings season close + Carty Labs / EasyApps mid-year refresh window).
Frequently asked questions
what's a good aov for a $1m shopify store in 2026?
Anywhere from $40 to $80 puts you in the typical band for a $1M brand in a cross-vertical read. $60 is the working median. If your vertical is apparel or beauty the band runs lower; furniture, jewelry, and supplements run higher. The honest answer is your AOV needs to support your unit economics at your CVR and your traffic cost, not match a benchmark. If your contribution margin works at $50 AOV, $50 is good.
does aov go up automatically as i scale from $1m to $10m?
No. The median lifts by $30 to $40 across that band ($60 at $1M, $95 at $10M in the working model), but the lift is from product mix, free-ship threshold engineering, and subscription stack, not from scale itself. Across our client base we have seen $10M brands sitting at $55 AOV because they never moved their threshold or built a bundle program. We have also worked with $1.5M brands at $140 AOV because they engineered it from day one.
is the right benchmark my revenue band or my vertical?
Both. Your vertical sets the floor and ceiling (apparel runs $80 to $120 typical, furniture $200+, supplements $60 to $90, beauty $40 to $80). Your revenue band tells you where you sit inside that vertical's distribution. A $5M apparel brand at $75 AOV is at the vertical median but in the bottom quartile for the revenue band. A $5M furniture brand at $180 AOV is below the vertical median but above the revenue band median. Read both, then act on the gap.
what's the fastest aov lever for a brand stuck at $50 to $70 aov?
Free-shipping threshold, set 15% to 25% above your current AOV. If your AOV is $65 today, set the threshold at $75 or $80. The 30-day lift is typically 8% to 18% with no other changes. Bundles are the next lever (cited 20% to 35% AOV lift in EasyApps and Klaviyo case studies). Subscriptions are the slowest lever to pull but the most durable, with public Orveon and Chaz Dean migrations showing 10% to 21% AOV lift over 6 months.
why is warby parker's average revenue per customer $324 but their aov isn't reported separately?
Warby Parker reports ARPC (LTM revenue divided by active customers, which includes repeat orders) instead of single-order AOV. They have 2.7M active customers and $871.9M net revenue, so ARPC is $324. The single-order AOV is lower (likely $180 to $220 range based on their pricing) but they choose to report the LTM number because the eyewear category drives high repeat purchase and ARPC is a better business indicator. Don't benchmark your AOV against their ARPC.
should i set my free shipping threshold above or below current aov?
Above. The whole point is to pull orders that would have landed below threshold up to and over the threshold. Setting it at or below current AOV gives away margin on every order without changing buyer behavior. The 2026 working rule is 15% to 25% above current AOV, then watch the next 30 days. If you see threshold-clearing rate climb past 60% with no order-count drop, move the threshold up another 10%. If order count drops more than 5%, back off.
what does 1-800-flowers' $84.72 aov tell me about scaling a low-aov dtc?
Mostly that you can scale a $1.7B business at sub-$90 AOV if your category supports it (gifting, perishables, high-frequency). The trade-off is order volume. 1-800-Flowers ran 17.3M orders in FY2025. That is the operational complexity of fulfilling 47,000 orders a day. Most $1M to $10M brands aren't built for that throughput, which is why low-AOV scaling paths tend to break around $20M to $30M unless the business is genuinely a high-frequency replenishment category. If you are at $4M today on $55 AOV, the path to $20M is either raising AOV to $90 or doubling order velocity, and the AOV path is almost always cheaper.