
Insights
Average organic traffic share for ecommerce, by vertical (2026)
Organic share varies from 18% in paid-heavy beauty to 54% in home goods. Knowing your vertical's baseline tells you whether you're underinvesting in SEO or already beating the benchmark before you spend another dollar on content or link acquisition.
Key Takeaways
- Etsy disclosed in its FY2024 10-K that 79% of its GMS came from organic and non-paid channels. Etsy's 79% is GMS share (a revenue measure), the closest public proxy to organic traffic share for a marketplace, not a sessions number. Etsy-owned Reverb is the actual traffic disclosure, at more than 80% unpaid traffic. These are the cleanest verbatim organic-share disclosures in any public ecom filing.
- REVOLVE drove 49% of traffic from free and low-cost sources in 2023. That is direct, email, branded paid search, and organic search combined. It bookends the upper bound for apparel DTC.
- The 2026 DTC organic share band by vertical is roughly: electronics 35-50%, supplements 30-45%, home/pet/sporting 30-40%, beauty 25-35%, apparel/food/mass jewelry 20-30%, premium jewelry 15-25%. Below the band you are paid-trapped. Above it, your direct and email are likely underbuilt.
- Organic click share fell 11-23 percentage points across measured verticals between January 2025 and January 2026, per ALM Corp using Similarweb clickstream data. Paid text ads picked up 7-13 of those points. Electronics and supplements got hit hardest.
- If you are an Amazon-native brand, your owned-site organic search is almost certainly below 5% of revenue. Aterian's 10-K shows 86% of revenue through Amazon in 2025, leaving 14% or less for everything else on the owned site (direct, email, paid, organic combined). Organic search is a fraction of that 14%. You never built the organic muscle because you never had to. That is your single biggest 2026 risk.
Every ecom operator asks the same question after the AI Overviews compression of 2025-2026: what should my organic traffic share actually be? Is mine too low, normal, or in deep trouble? There is no clean public answer because Similarweb mixes marketplaces with DTC, Shopify does not publish channel mix by vertical, and most 10-Ks bury the disclosure. So we built the table that does not exist anywhere else: a 10-vertical DTC organic-search-share band for 2026, triangulated from four verbatim SEC 10-K disclosures, the Similarweb and HypeAuditor 2024 benchmark, and the ALM Corp 2026 click-share data. The reason this matters: if you are below the band for your vertical, you are paid-trapped and AI Overviews will bleed you out through the rest of 2026. If you are above the band, your direct and email are underbuilt and one algorithm update can crater the business. Here is what to expect, what to watch, and where you actually sit.
Why nobody publishes a clean organic-share-by-vertical table
Three reasons. First, Similarweb's vertical channel-mix tables mix marketplaces (Amazon, Etsy, Walmart Marketplace) with DTC brands. The category-wide averages are dominated by the marketplace giants, which suppresses what a typical $20M DTC operator should actually expect. Second, Shopify does not publish channel-share benchmarks by vertical for its merchant base. The data exists in their merchant-success and channel-attribution dashboards, but it is not released. Third, public DTC 10-K disclosures of organic share are voluntary, and most brands skip them. Of roughly 90 ecom-relevant 10-Ks we searched, only four disclosed a quantitative organic-share number (Etsy, Reverb, Revolve, and Aterian by implication). Four more confirmed organic as a material acquisition channel without quantifying it (Stitch Fix, Owlet, Brilliant Earth, a.k.a. Brands).
That leaves operators with a gap. Generic ecom averages put organic at 40-50% globally, but DTC specifically runs 5-10 points lower because DTC overweights paid social and underweights brand-organic. The post-iOS-14.5 CAC environment pushed more spend into Meta, which compressed organic share of mix even when organic absolute traffic held steady. So the question is not "what is the average for ecom" (which is misleading), but "what is the typical band for a $5M to $150M DTC brand in my specific vertical."
That is the table we are building below. It is a synthesis, not a primary survey, and we flag the three verticals (supplements, food and beverage, sporting goods) where Similarweb does not break out a dedicated cell and we extrapolated from adjacent categories.
What public ecom companies actually disclose: Reverb 80% traffic, Etsy 79% GMS, REVOLVE 49% mix, Aterian 86% Amazon
Four public-company disclosures anchor the entire benchmark. Each is a verbatim quote from a filed SEC 10-K. One important caveat upfront: these four numbers do not all measure the same thing. Reverb is the cleanest traffic-share disclosure (sessions). Etsy is a GMS share (revenue), which is the closest public proxy to organic traffic for a marketplace but is technically a revenue measure. REVOLVE is a hybrid traffic bundle (direct + email + branded paid + organic combined). Aterian is a revenue-channel mix that lets us back into how small the owned-site organic share can possibly be. We label each one below so you can hold them on the right axis.
Etsy, FY2024 (GMS share, not traffic). "In 2024, the percentage of our GMS attributed to performance marketing (paid GMS) was 21%, meaning that the vast majority of our GMS comes to us organically through awareness of our brand, as well as from non-paid channels such as search, social, email, and push notifications." That is the cleanest verbatim public organic-GMS disclosure in ecom: 79% organic GMS. GMS is gross merchandise sold (a revenue measure), not sessions. For a marketplace like Etsy, GMS share is a reasonable downstream proxy for organic traffic share, but the two are not the same axis and operators should not treat them as interchangeable.
Reverb (Etsy subsidiary), FY2024 (traffic share). "Similar to Etsy, more than 80% of Reverb's traffic is unpaid, evidencing the strength of the Reverb brand." This one is an actual traffic disclosure (sessions), hidden inside the same Etsy 10-K. Reverb is a music-gear marketplace, which means the buyer side (musicians) has high brand recall and direct-search volume.
REVOLVE, FY2023 (hybrid traffic bundle). "In 2023, we drove 49% of traffic for REVOLVE from free and low-cost sources, as measured by the number of visitors who landed on the REVOLVE website or mobile application directly, via email marketing links, or through paid branded search terms and organic search results." That number bundles direct, email, branded paid search, and organic search together. Pure organic search is a fraction of that 49% (direct usually takes the largest slice in DTC apparel), and the company does not break the bundle down further.
Aterian, FY2025 (revenue-channel mix). "In 2025 and 2024, approximately 86% and 92% of our revenue was through the Amazon sales platform, respectively." That leaves 14% or less of revenue for everything else on the owned site combined (direct, email, paid, organic). Owned-site organic search is a fraction of that 14%, likely under 5% of total revenue. Aterian is the cautionary tale for any brand that built on Amazon and never invested in Google.
Four more public ecom companies confirmed organic as a material acquisition channel in their 2025 or 2026 10-Ks without quantifying the share. Stitch Fix flagged Google algorithm changes as a material risk. Owlet became the first DTC 10-K to explicitly name "zero-click searches" as a material risk factor. Brilliant Earth referenced "significant earned and organic traffic" as a brand asset. a.k.a. Brands cited "content-rich narrative and authentic brand messaging" driving organic traffic.
Brand Ticker Filing Disclosure Organic / non-paid share Etsy ETSY 10-K, FY2024 (filed 2025-02-19) "21% of GMS from performance marketing, vast majority comes organically" 79% organic GMS Reverb (Etsy) ETSY 10-K, FY2024 (filed 2025-02-19) "More than 80% of Reverb's traffic is unpaid" >80% unpaid REVOLVE RVLV 10-K, FY2023 (filed 2024-02-27) "49% of REVOLVE traffic from free and low-cost sources" 49% free + low-cost Aterian ATER 10-K, FY2025 (filed 2026-03-23) "86% of revenue through Amazon" ≤14% non-Amazon revenue total; organic search a fraction of that (likely <5%) Stitch Fix SFIX 10-K, FY2025 (FY ending August 2025; filed 2025-09-25) "Significant number of visits via organic search engine results" Material, not quantified Owlet OWLT 10-K, FY2025 (filed 2026-03-09) "Shift toward zero-click searches may reduce our organic traffic" Material, not quantified Brilliant Earth BRLT 10-K, FY2025 (filed 2026-03-17) "Significant earned and organic traffic" Material, not quantified a.k.a. Brands AKA 10-K, FY2025 (filed 2026-03-05) "Content-rich narrative drives organic traffic" Material, not quantified
The 2026 organic share by vertical: 10 categories
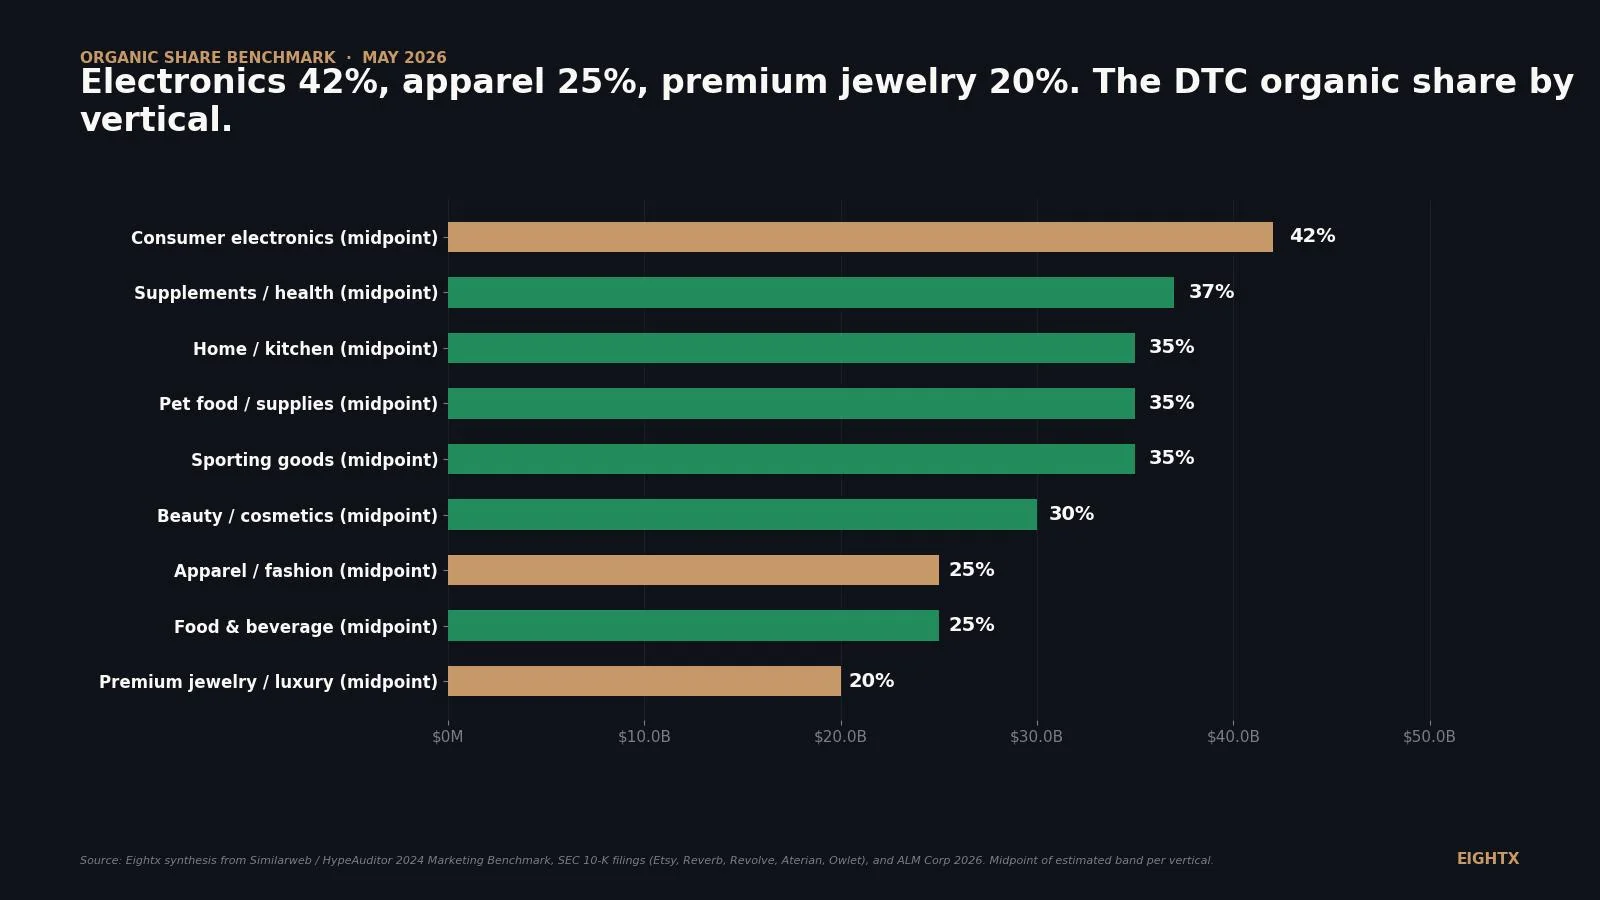
Using the four quantitative anchors above, the Similarweb 2024 benchmark methodology, and the DTC adjustment for paid-social weight, here is the band for 10 verticals. Range bars on the chart reflect uncertainty; the table breaks the band down by channel mix.
Consumer electronics tops the band at 35-50%. The category is search-driven (specs, comparisons, review queries) and conversion rates run lower (1.4-1.8% typical), which means more sessions per order and more of those sessions arrive via Google. Supplements and health sit close behind at 30-45%, partly because Meta and Google ad-policy restrictions push the category toward SEO and affiliate. Home, kitchen, pet food, and sporting goods cluster at 30-40%, all considered-purchase categories where buyers research before they buy.
Beauty sits at 25-35%. The Similarweb 2024 cell shows beauty mid-30s organic, but DTC beauty specifically (Glossier, ILIA, Saie tier) runs lower because the playbook is influencer and paid social heavy. Apparel and fashion sit at 20-30%, anchored by REVOLVE at 49% free and low-cost combined (which works back to roughly 25% pure organic). Food and beverage matches apparel at 20-30%, dragged down by subscription and impulse-driven paid social.
Premium jewelry and luxury sit at the bottom, 15-25%. Brand and PR carry the acquisition load, and offline retail or showroom traffic suppresses owned-site organic share.
Vertical (DTC focus) Organic % Direct % Paid % Email / Ref % Rationale Consumer electronics 35-50 20-30 20-30 5-10 Search-driven; specs and review queries; Similarweb 2024 Supplements / health 30-45 20-30 20-35 5-15 Ad-policy restrictions push to SEO + affiliate; Owlet 10-K Home / kitchen 30-40 20-30 20-35 5-15 Similarweb Home and Garden; content-driven considered purchase Pet food / supplies 30-40 25-35 20-30 5-15 Similarweb Pet Food and Supplies; subscription pushes direct higher over time Sporting goods / outdoor 30-40 20-30 25-35 5-15 Enthusiast branded search; considered purchase Beauty / cosmetics 25-35 25-35 25-40 5-15 Similarweb Beauty; DTC adjustment for influencer and paid social weight Jewelry (mass) 20-30 30-45 15-30 5-15 Similarweb Jewelry and Luxury (mass tier); brand and branded direct Food and beverage 20-30 30-40 25-40 5-15 Subscription and impulse-driven; high conversion; paid social heavy Apparel / fashion 20-30 25-35 30-45 5-15 Similarweb Fashion; REVOLVE 49% free and low-cost as anchor; Meta-heavy Premium jewelry / luxury 15-25 30-45 15-30 5-15 Brand and PR heavy; offline retail suppresses organic share
What AI Overviews did to those numbers between Jan 2025 and Jan 2026
The bands above are 2026 levels. The trend matters separately. Organic SERP click share fell across every measured vertical between January 2025 and January 2026, per ALM Corp using Similarweb clickstream. The range is 11-23 percentage points down. Paid text ads picked up 7-13 of those lost points; AI Overviews, featured snippets, and zero-click answers absorbed the rest.
Note: ALM Corp publishes the 11-23 point range across measured verticals but does not publish per-vertical exact numbers. The vertical bars in Chart 3 are illustrative midpoints within that band, not sourced per-vertical data. We will revise once exact per-vertical numbers are published.
Two observations from the illustrative per-vertical pattern. Consumer electronics and supplements likely got hit hardest within the band. Both verticals carry a high informational-query mix (spec comparisons, "is X safe," "what's the difference between"), and those are exactly the queries Google's AI Overview answers in-SERP without a click. Pet food and beauty likely got hit least because branded and navigational queries (a customer typing "Chewy" or "Glossier" directly) survive the AIO shift mostly intact.
The Graphite analysis published by Search Engine Land in April 2026 cross-checks the click-share data with absolute traffic. Across roughly 40,000 large US sites, organic search traffic was down 2.5% YoY. Overall search traffic was up 0.4% and Google specifically was up 0.8%, meaning Google sent more queries but fewer clicks per query made it to publishers. That is the "zero-click" pattern Owlet flagged in its 10-K risk factors.
The counterpoint worth holding: AI Overviews currently appear in only 3.2% of shopping queries per Ahrefs analysis (2026 snapshot). Transactional ecom queries ("buy X," "X review," "X coupon code") are still mostly a clean organic click. The bleed is in informational content adjacent to your category, not on product or category pages themselves.
Below the band for your vertical, you are paid-trapped and AI Overviews will keep bleeding you. Above the band, your direct and email are underbuilt and one algorithm update kills the business. The middle of the band is where you want to live. The work is figuring out which side of it you are actually on.
What this means for your business at $5M to $150M
Three decisions on your desk this quarter.
Decide if you are inside or outside the band. Pull 90 days of Google Analytics. Classify sessions by channel. Calculate your organic search percentage. Match it to your vertical row in the table above. If you are below the band, the problem is not paid budget. It is a structural acquisition problem and adding more paid spend makes it worse. If you are above the band, congratulations, you are organic-strong; the risk is concentration and you should be investing in direct (brand recall) and email (retention) before the next Google update.
Diagnose the gap before you spend on a fix. Below-band organic usually traces to one of three root causes. First, you never built content (no category pages, no blog, no schema), which is a 6-12 month rebuild. Second, you built content but it is not ranking because of a technical issue (slow LCP, no internal linking, no schema markup), which is a 90-day fix. Third, you ranked once and AI Overviews took the queries, which is a content-format pivot toward original data and product-led pages. Most operators assume root cause three when they are actually living with root cause one or two.
Rebalance toward direct and email if you are above-band organic. Aterian's 86% Amazon concentration is the cautionary tale on the paid side. The same pattern shows up on the organic side: brands at 50%+ organic search look like a strong business right up until Google changes the algorithm. The fix is not less SEO; it is more brand and email investment to dilute the concentration risk.
For the companion data on the paid side, see our DTC funding drought tracker for 2026 which puts the brutal-but-true context on why brands cannot easily pivot from paid to organic when they want to. For the email side, the Klaviyo 2026 benchmark synthesis in our ecommerce penetration tracker shows where email revenue contribution sits by vertical.
Sources and methodology
SEC EDGAR 10-K filings, fiscal 2023-2025. Etsy 10-K (CIK 0001370637, accession 0001370637-25-000017, filed 2025-02-19) for the 79% organic GMS and 80%+ Reverb unpaid traffic disclosures. Revolve Group 10-K (CIK 0001746618, accession 0000950170-24-021244, filed 2024-02-27) for the 49% REVOLVE free and low-cost disclosure. Aterian 10-K (CIK 0001757715, accession 0001437749-26-009285, filed 2026-03-23) for the 86% Amazon revenue concentration. Owlet 10-K (CIK 0001816708, accession 0001816708-26-000018, filed 2026-03-09) for the explicit zero-click risk factor. Plus Stitch Fix, Brilliant Earth, and a.k.a. Brands 10-Ks confirming material organic share qualitatively.
Similarweb and HypeAuditor 2024 Marketing Benchmark. Covers seven verticals (Beauty and Cosmetics, Fashion and Apparel, Home and Garden, Jewelry and Luxury, Pet Food and Supplies, Consumer Electronics, Hotels). Sample of roughly 1,000 most-visited domains per vertical, segmented into giants (top 10), challengers (11-100), and up-and-comers (101-1,000). DTC brands skew toward the challenger tier where paid share is structurally higher and organic share lower than the category-wide weighted average. Exact percentages by vertical are gated; the ranges in our table reflect the public methodology plus the four 10-K anchors plus the global ecom baseline (organic 40-50%, direct 20-30%, paid 15-25%, email and referral 5-15%).
Three verticals extrapolated. Similarweb does not break out dedicated cells for supplements, food and beverage, or sporting goods. Bands for those three are extrapolated from adjacent Similarweb categories (Beauty for supplements, Pet Food for food and beverage, Consumer Electronics for sporting goods) plus the global ecom baseline plus DTC adjustment for paid-social weight.
ALM Corp Organic Traffic Crisis Report 2026 Update. Uses Similarweb clickstream to measure SERP click-share change between January 2025 and January 2026. Reports the 11-23 percentage-point organic decline and 7-13 percentage-point paid text ad gain across measured verticals. Per-vertical splits in our Chart 3 are illustrative within that band; the ALM report cites the range without publishing per-vertical exact numbers.
Search Engine Land (Graphite analysis, April 2026). US organic search traffic down 2.5% YoY across approximately 40,000 large US sites between early 2025 and early 2026. Overall search traffic up 0.4%, Google traffic up 0.8%. Cross-checks the ALM click-share data with absolute traffic volume.
Limitations. Public DTC 10-K disclosures of organic share are rare (4 quantitative, 4 qualitative-only out of roughly 90 ecom 10-Ks searched). Similarweb's vertical tables mix marketplaces with DTC and are gated for exact channel percentages. We adjust DTC ranges down by 5-10 points from the broad ecom organic average based on our read that DTC overweights paid social relative to ecom as a whole; this adjustment is a judgment call, not a published number. The 2026 click-share compression numbers come from a single source (ALM Corp on Similarweb data) and should be refreshed quarterly given how fast Google AI Overviews are evolving.
Update cadence. This benchmark is refreshed quarterly as new 10-K filings land and the ALM Corp and Graphite data series update. Next refresh target: late August 2026 after Q2 earnings season closes.
Frequently asked questions
what percent of my ecom traffic should come from organic search in 2026?
For a typical DTC brand at $5M to $150M revenue, organic search lands somewhere between 20% and 50% of sessions depending on vertical. Electronics, supplements, and home goods sit higher (30-50%). Apparel, food and beverage, mass jewelry sit lower (20-30%). Premium jewelry and luxury sit lowest (15-25%). If you are below the band for your vertical, you are paid-trapped.
is 20% organic too low for a $10m dtc apparel brand?
Twenty percent is the floor of the apparel band, not the ceiling. It is acceptable but not strong. REVOLVE runs at 49% from free and low-cost combined (direct + email + branded paid + organic), and pure organic is a fraction of that. If you are at 20% organic and your direct plus email is also weak, you are over-reliant on Meta and any iOS or algorithm change hits you full force.
how do i tell if my organic share is broken or just normal for my vertical?
Pull your last 90 days of Google Analytics, classify sessions by channel (organic search, direct, paid search, paid social, email, referral, social), and compare your organic percentage to the band for your vertical in the table below. If you are inside the band but at the low end, you have headroom. If you are below the band, you have a structural acquisition problem, not a paid-budget problem.
how much did ai overviews actually drop organic traffic in 2026?
ALM Corp using Similarweb clickstream found organic SERP click share down 11-23 percentage points across verticals between January 2025 and January 2026. Graphite separately found US organic search traffic down 2.5% YoY across roughly 40,000 large US sites. The two numbers are different because click share is share of a fixed pie, while traffic is absolute volume. Both are real, both matter.
why do amazon-native brands have basically zero organic search on their own site?
Because they built the business on Amazon search, not Google. Aterian's 10-K shows 86% of revenue through Amazon in 2025. The owned-site exists as a brand page, not a conversion surface. If you are in this bucket, your single biggest 2026 risk is Amazon adjusting your category structure or your private-label competitor moving up the search results. You have no organic acquisition cushion to fall back on.
is it possible to get to 50% organic share like etsy without being a marketplace?
Rarely, and Etsy's 79% is GMS share not traffic share, which matters before you anchor on it. Etsy gets there because of two-sided marketplace dynamics (sellers + buyers both bring traffic). Single-brand DTC tops out closer to 50% organic traffic share. For a $5M to $150M brand, 35-45% organic is the realistic upper band, and you only get there with five-plus years of consistent content investment, strong brand recall driving direct, and a category that rewards search-driven research.
should i still invest in seo in 2026 with ai overviews and zero-click?
Yes, but the ROI calculation has changed. AI Overviews appear in only 3.2% of shopping queries per Ahrefs analysis, so transactional ecom keywords are still mostly a clean organic click. The bleed is in informational adjacent content (guides, comparisons, how-to). Lean SEO toward product, category, and bottom-funnel pages, and treat informational content as primarily an AI-citation play with traffic as a secondary outcome.
what organic traffic share would a buyer want to see in due diligence?
In our experience advising operators through diligence, strategic buyers and PE want to see organic search at 25% or more of sessions and direct at 25% or more of sessions, with paid social under 40%. That mix signals brand strength and reduces acquisition-channel concentration risk. Below 20% organic combined with above 50% paid social is the profile we have seen get discounted in a deal. Above 40% organic with strong direct is the pattern we have seen earn a premium multiple. Multiples themselves are deal-specific and depend on the rest of the financials.