
Insights
Mobile AOV is 70-80% of desktop AOV in 2026: what the device-split gap means for your DTC P&L
Mobile average order value runs at 70 to 80% of desktop AOV across every 2026 benchmark, a 25 to 50% desktop premium that widens with ticket size (electronics hit 48%). Mobile carries 70 to 78% of traffic but about 58% of orders, with 79 to 85% cart abandonment. Build CAC and LTV payback models per device, not blended.
Key Takeaways
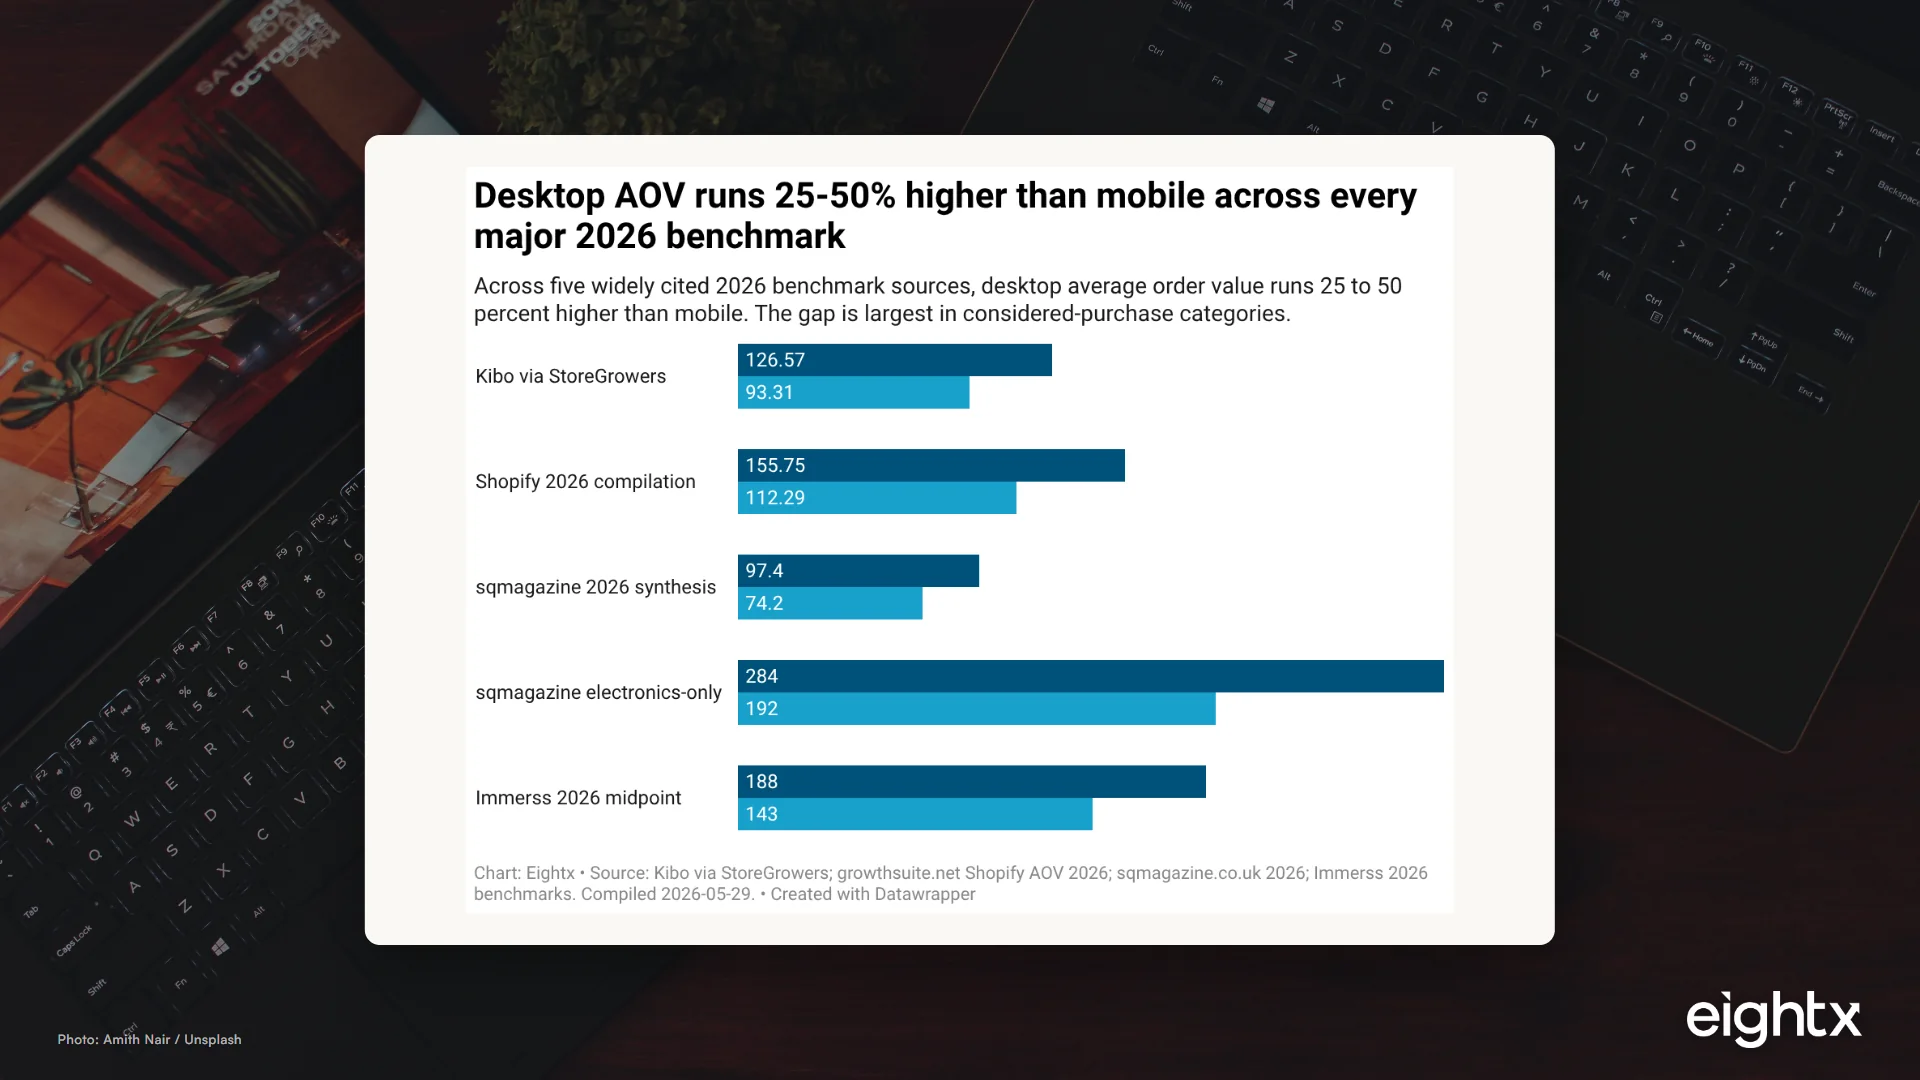
- Mobile AOV runs at 70 to 80 percent of desktop AOV across 2026 benchmarks. Kibo via StoreGrowers: desktop $126.57 vs mobile $93.31 (74 percent). Shopify 2026 compilation: $155.75 vs $112.29 (72 percent). sqmagazine 2026 synthesis: $97.40 vs $74.20 (76 percent).
- Desktop also converts 1.7 to 2.0 times more often than mobile. Desktop conversion sits at 3.9 to 4.3 percent vs mobile at 1.8 to 2.2 percent. Mobile cart abandonment runs 79 to 85 percent vs desktop at 67 to 70 percent.
- The gap widens with ticket size. Consumer electronics shows desktop $284 vs mobile $192 (48 percent premium). Apparel and beauty show a 25 to 35 percent gap. Meal kits and luxury sit at 50 percent plus.
- Mobile drives 70 to 78 percent of traffic but only about 58 percent of orders. The traffic-vs-revenue gap means your blended AOV overstates per-session value on mobile and understates it on desktop.
- Stop using one blended AOV in your CAC and LTV models. Split your unit economics by device. Your mobile-acquired customer and your desktop-acquired customer are running two different businesses on the same storefront.
Mobile drives the majority of ecommerce sessions and orders, but desktop still books a meaningfully larger basket on every checkout. Across the most widely cited 2026 benchmarks, mobile average order value (AOV) runs at 70 to 80 percent of desktop AOV, which matters because most DTC operators model new-channel ROI on a single blended AOV number. The implication: if you run a $5 to $50M Shopify brand, you are running two different unit-economic businesses on the same storefront and your blended math is hiding it. What to watch next is whether mobile share of orders breaks 60 percent in 2026 (currently 58 percent) and whether Shop Pay, Apple Pay, and Link close any more of the structural cart-abandonment gap.
The headline: mobile AOV runs at 70-80% of desktop AOV in 2026
Three independent 2026 benchmark sources, three different methodologies, the same finding.
Kibo's widely-cited dataset (republished by StoreGrowers in their 2026 benchmark roundup) puts desktop AOV at $126.57 and mobile AOV at $93.31. That is mobile at 74 percent of desktop, or a 36 percent desktop premium. A 2026 Shopify stats compilation from growthsuite.net reports desktop AOV at $155.75 and mobile at $112.29, which is mobile at 72 percent of desktop and a 39 percent desktop premium. sqmagazine.co.uk's 2026 synthesis lands at $97.40 desktop vs $74.20 mobile, mobile at 76 percent of desktop and a 31 percent desktop premium.
Three sources, range of 70 to 80 percent, midpoint around 74. That is the headline. Every 2026 benchmark we pulled, including Immerss's $146 to $230 desktop and $137 to $149 mobile range (we plot the midpoint at $188 / $143 in the chart below), lands in the same band.
The operator implication is straightforward. If you run a Shopify storefront at $5M to $50M GMV with 70 percent of sessions on mobile and roughly 58 percent of orders on mobile, your blended AOV is a weighted average of two different businesses. Mobile-skewed channels (TikTok organic, Meta Reels, paid social on iOS) are subsidising a lower-AOV channel mix. Desktop-skewed channels (paid search desktop, organic search desktop, email opened on laptop) are doing the heavy AOV lifting and getting credit for it in last-click attribution but not in your channel-allocation model. The fix is not "build a better mobile checkout." The fix is to stop using your blended AOV in CAC and LTV models, because the gap is large enough to flip the ROI sign on a new channel decision.
Why the gap exists and why it isn't closing
Three structural reasons the device-split AOV gap persists into 2026.
First, mobile sessions are higher-funnel. People browse on phones during downtime, work breaks, and TV-watching. They build wish lists, save for later, and return later (often on desktop) to actually buy the bigger basket. Desktop sessions, by contrast, are deliberate. Someone sits down with a credit card, a 27-inch monitor, and 20 minutes to spec out a product. That intent gap is hard to close with payment-method UX alone.
Second, mobile checkout friction is real but only explains part of the AOV gap. Form completion is harder on phones, payment-method input is harder, and reviewing a multi-line cart on a small screen surfaces sticker-shock earlier than it does on desktop. Mobile cart abandonment runs at 79 to 85 percent in 2026 vs desktop at 67 to 70 percent. Shop Pay, Apple Pay, and Link appear to have moved the needle modestly on mobile checkout completion, not collapsed the gap.
Third, basket composition behaves differently by device. Desktop users add accessories, build bundles, and stack subscription options more often. Mobile users tend to buy the one thing they came to buy. That is why categories with bundling potential (electronics, home, beauty kits) show the widest AOV gap. Categories with one-SKU buying patterns (a single replenishment coffee bag, a single supplement bottle) show a narrower gap.
The structural piece is what to plan around. Even if mobile share of orders climbs another 5 percentage points by 2028, the per-order AOV gap will not collapse. It might compress 1 to 2 points a year. That means the gap matters more, not less, as mobile takes more share, because the mix shift toward lower-AOV transactions structurally pressures your blended AOV downward.
Metric Desktop Mobile Tablet AOV (USD, blended) $126 to $156 $93 to $112 ~$108 to $154 Conversion rate 3.9 to 4.3% 1.8 to 2.2% ~2.5 to 3.0% Cart abandonment 67 to 70% 79 to 85% ~73% Share of ecom traffic 22 to 28% 70 to 78% 2 to 5% Share of ecom orders ~40% ~58% ~2%
By vertical: the gap widens with ticket size
Vertical matters more than platform when it comes to the size of the AOV gap.
In consumer electronics, where buyers comparison-shop and configurations matter, 2026 data shows desktop AOV at $284 vs mobile AOV at $192. That is a 48 percent desktop premium. Home goods sits at about $150 desktop vs $110 mobile (36 percent). Luxury (apparel, jewelry, watches) runs $950 mobile vs $1,450 desktop, a 53 percent premium and the widest gap we tracked. Apparel and beauty, both lower-ticket and more mobile-native categories, sit in the high-20s to mid-30s. Meal kits with subscription bundling can show 50 percent because the desktop user picks a 12-meal-a-week plan while the mobile user picks the 4-meal trial.
The operator frame: your category, not your platform, drives the size of your gap. A Shopify Plus electronics brand and a Shopify Plus apparel brand will have very different device-split economics and should not benchmark against each other. The fastest sanity check is the table below, which compares blended, mobile, and desktop AOV across the eight verticals we modelled.
Vertical Blended AOV Mobile AOV Desktop AOV Desktop premium Apparel / fashion $85 $70 $90 +29% Beauty / cosmetics $70 $55 $75 +36% Coffee / F&B DTC $74 $60 $80 +33% Health & supplements $80 $65 $85 +31% Home goods $135 $110 $150 +36% Consumer electronics $260 $192 $284 +48% Luxury $1,240 $950 $1,450 +53% Meal kits $40 $32 $48 +50%
The most important thing to note: every row except electronics is modelled, not reported. No primary-source dataset publishes mobile and desktop AOV broken out by vertical in 2026. The numbers above are useful as planning anchors, not as exact ground truth. Pull your own device-split from GA4 or Triple Whale before you commit to any channel-mix decision.
The Shopify lens: $155 desktop vs $112 mobile, and where Plus sits
Shopify-specific device-split numbers are harder to source than the cross-platform benchmarks because Shopify does not publish device AOV in its public benchmarks. The most-cited 2026 number comes from third-party compilations attributing to Shopify data: desktop AOV around $155.75, mobile AOV around $112.29. That is a 39 percent desktop premium, sitting almost exactly on the cross-source median.
Where does Shopify Plus sit? Top-20 percent Shopify stores generally report blended AOV above $120, and high-AOV verticals (electronics $120 to $180, jewelry $100 to $150, home goods $95 to $130) skew toward Plus. There is no published Plus-only device-split. The safest planning multiplier is to assume Plus operates with the same 25 to 40 percent desktop premium as the broader platform, which puts a typical Plus brand at roughly $135 to $180 mobile AOV and $190 to $260 desktop AOV. Validate against your own GA4 device split before you bet a channel-mix decision on the multiplier.
A note worth surfacing for operators running Klaviyo. Email and SMS flows tend to land mobile (most opens happen on phones) and operator-reported AOV from flow-driven traffic typically runs materially higher than broadcast-campaign AOV. That means well-built post-purchase, abandoned-cart, and browse-abandonment flows partially close the mobile AOV gap from below: a flow-attributed mobile order can land at AOV roughly equivalent to a cold-traffic desktop order. The implication for Klaviyo-heavy brands: your mobile economics are better than the platform-average benchmark suggests if a meaningful share of mobile orders are flow-driven. But that signal lives in your Klaviyo reporting, not the cross-platform benchmark.
What this changes about your CAC, LTV, and channel mix
Three operator decisions the device-split gap should change this quarter.
Split CAC and LTV by device when modelling new-channel ROI. A new TikTok campaign delivering 95 percent mobile traffic and a new Google Search campaign delivering 50/50 traffic are not comparable on a blended CAC target. The TikTok customer arrives with an AOV roughly 70 to 80 percent of the Search customer's AOV. Use a per-device payback model, not a blended one. The math gets ugly fast otherwise: a 6-month payback at blended AOV can be a 4-month payback on desktop traffic and a 9-month payback on mobile traffic, and only one of those is fundable at scale.
Audit checkout-completion rate by device before chasing more mobile traffic. Mobile share of traffic is rising, but the entire AOV and conversion advantage of desktop suggests your bottleneck is not "get more mobile sessions." It is "convert and increase basket on the mobile sessions you already have." Triple Whale, GA4, Shopify Analytics native device report, and Heap all break out funnel completion by device. The benchmark to anchor against is your own desktop number on the same store: if mobile cart-to-checkout is materially below your desktop rate, checkout UX is the lever, not more top-of-funnel paid traffic.
Stop conflating Shopify's "mobile sessions up" with "mobile revenue up." Mobile share of orders sits at roughly 58 percent in 2026 while mobile share of traffic is now 70 to 78 percent. That gap means traffic-share gains overstate revenue-share gains. If your traffic dashboards are showing 75 percent mobile and your CFO model assumes mobile is 75 percent of revenue, your revenue model is structurally overstated.
The macro context matters here too. US ecommerce is now a $326.7B per quarter business and 16.9 percent of total retail. Mobile is the channel doing most of the heavy lifting on that share gain, which is exactly why the device-split AOV gap is structurally important to track. The chart below shows the eight-year arc.
The headline benchmark numbers look like a small problem and a structural one. The small problem is checkout UX: mobile abandonment is 10 to 15 points worse than desktop and Shop Pay only closes some of it. The structural problem is that mobile and desktop are two different unit-economic businesses sharing one storefront, and most DTC operators are still running one blended CAC target and one blended LTV model across both. The fix is not a mobile-first redesign. The fix is splitting your unit economics by device before you size the next channel.
Sources and methodology
This post combines three layers of data. Macro context comes from US Census MRTS (Monthly Retail Trade Survey) for NAICS 4541 (Electronic shopping and mail-order houses), seasonally adjusted, pulled from January 2023 through March 2026 (39 monthly observations). FRED series ECOMSA and ECOMPCTSA provided the quarterly $B and percent-of-total-retail time series from Q1 2020 through Q1 2026 (25 observations). Both series confirm US ecommerce is now $326.7B per quarter at 16.9 percent of total retail.
Mobile vs desktop AOV benchmarks were synthesised across five 2026 sources: Kibo (republished by StoreGrowers in its 2026 ecommerce roundup), the 2026 Shopify AOV compilation at growthsuite.net, sqmagazine.co.uk's 2026 mobile vs desktop statistics page, Immerss's 2026 ecommerce benchmark report, and the Ecommerce Foundation's 2026 global statistics (via searchlab.nl). The median desktop premium across all five lands at 36 percent, mobile averaging 74 percent of desktop. We carried both the range (25 to 50 percent) and the midpoint into the post so operators can stress-test against either.
Vertical-level device splits were modelled, not reported. No 2026 primary source publishes mobile x desktop AOV by vertical. We took published blended-AOV-by-vertical numbers from Improvado's 2026 CRO benchmarks, StoreGrowers retention benchmarks, and the Ecommerce Foundation, then applied the 0.70 to 0.85 multiplier (mobile as share of desktop) from the cross-source benchmark. Consumer electronics is the exception: $284 desktop vs $192 mobile is reported in sqmagazine's 2026 page, not modelled. We surface luxury and meal kits in the inline table but exclude them from the vertical chart because the luxury row's scale dominates any non-log chart.
Conversion-rate and cart-abandonment benchmarks are 2026 figures from Statista's global CVR by device dataset, the Immerss 2026 ecommerce benchmark report, and sqmagazine's 2026 compilation. Tablet figures are included in the device table for completeness but excluded from charts because tablet sits at 2 to 5 percent of traffic and is rarely reported separately by primary sources.
Limitations the reader should know about. The Kibo dataset ($126.57 desktop / $93.31 mobile) is 2020-era, still cited in 2026 because it remains directionally consistent with newer sources. Shopify and Klaviyo do not publish device-split AOV in their public benchmark APIs, so any "Shopify desktop vs mobile AOV" number in this post comes from third-party compilations attributed to Shopify data, not from Shopify directly. The Ecommerce Foundation $92 global blended AOV is itself a roll-up of underlying per-country averages that vary 5 to 10 times by source.
This page is a living index. We refresh it quarterly when the next US Census MRTS quarterly release lands and when at least one new 2026 benchmark source updates. The next planned refresh is August 2026 after the Q2 2026 Census release. For related operator reading, see our average ecommerce AOV by revenue band post for how AOV scales with revenue and our average AOV by ecommerce vertical post for the matching vertical-level benchmark.
Frequently asked questions
what's the average mobile aov vs desktop aov in ecommerce in 2026?
Mobile AOV runs at 70 to 80 percent of desktop AOV across the 2026 benchmark sources we tracked. Kibo via StoreGrowers shows desktop $126.57 vs mobile $93.31 (74 percent). A 2026 Shopify stats compilation shows $155.75 vs $112.29 (72 percent). sqmagazine's 2026 synthesis shows $97.40 vs $74.20 (76 percent). The desktop premium sits between 25 and 50 percent depending on vertical and source.
is the mobile vs desktop aov gap the same across every vertical?
No. The gap widens with ticket size. Consumer electronics shows a 48 percent desktop premium ($284 vs $192). Home goods and luxury sit at 35 to 50 percent. Apparel and beauty are in the 25 to 35 percent range. Low-ticket replenishment categories like meal kits and coffee DTC are closer to 20 to 30 percent on a unit basis but can blow out if the desktop user buys a multi-month bundle and the mobile user buys a single SKU.
how much higher is desktop aov on shopify in 2026?
Third-party compilations attributing to Shopify data put desktop AOV at $155.75 and mobile AOV at $112.29 in 2026. That is a 39 percent desktop premium. Shopify itself does not publish device-split AOV in its public benchmarks, so this is a synthesised number. Apply a 1.25 to 1.45 multiplier to your blended mobile AOV as a rough desktop estimate if you do not have your own GA4 or Triple Whale split handy.
does mobile cart abandonment really run that high or is that just bad ux?
Both. Mobile cart abandonment legitimately runs at 79 to 85 percent in 2026 (vs desktop at 67 to 70 percent). Some of that is form friction, payment-method input, and small screens. But a big chunk is intent: mobile sessions skew higher-funnel and more discovery-driven, so cart adds on mobile are often save-for-later behaviour rather than buy-now intent. Shop Pay, Apple Pay, and Link have closed maybe 3 to 5 points of the gap. They have not collapsed it.
how do i calculate my own mobile vs desktop aov ratio?
In GA4 go to Reports, Tech, Device category, and break the conversions report by Default channel grouping or by Session source. Pull AOV (Total revenue divided by Purchases) for mobile vs desktop over the last 90 days. If you run Triple Whale, the Device Split view in My Metrics does the same in one click. Compare your number to the 70 to 80 percent benchmark. If your mobile AOV is below 60 percent of desktop, you have a checkout-friction problem on top of the structural gap.
should i bid separately for mobile and desktop in google ads given the aov gap?
Yes, on Performance Max and Standard Shopping if your spend is over about $30k a month. Set device-level bid adjustments so your desktop CPCs can stretch to match the higher AOV and contribution. On Meta you cannot directly device-bid, but you can break out mobile and desktop placements at the ad-set level and let CAPI feed device dimensions back. The point is not to suppress mobile. Mobile is most of your traffic. The point is to stop forcing one CPA target across two unit-economic profiles.
is the aov gap closing as more consumers shop on phones?
Slowly, but the structural piece is not going away. Mobile share of orders has climbed from about 50 percent in 2021 to about 58 percent in 2026, so the volume mix is shifting. But desktop AOV has stayed structurally higher every year because the underlying behaviour (deliberate basket-building on a larger screen) does not change with device penetration. Expect the gap to compress 1 to 2 percentage points a year, not disappear.
how should mobile vs desktop aov change my cac and ltv model?
Three changes. First, split LTV by device for the same cohort: a mobile-acquired customer and a desktop-acquired customer will show different first-order AOV and often different repeat behaviour. Second, when modelling a new paid channel, weight CAC by the device mix that channel actually delivers (TikTok is 90 percent plus mobile; Google Search is 50/50). Third, build a payback model per device, not blended. A 6-month payback at blended AOV can be a 4-month payback on desktop and a 9-month payback on mobile, and only one of those is fundable at scale.