
Insights
Average ecommerce paid traffic share by vertical 2026: what the proxy data actually shows
No public source publishes a clean paid-traffic share by ecommerce vertical for 2026. The best proxy is pixel install rates across 750,000 US Shopify stores: Meta Pixel runs 15.9% to 40% by vertical, TikTok Pixel is near parity with Meta in apparel and beauty. Public DTC 10-Ks show marketing spend at 7 to 15% of revenue at scale. Your own GA4 source breakdown is the only number that matters for your decisions.
Key Takeaways
- Zero public sources publish a clean ecom traffic-source by vertical benchmark for 2025-2026. Similarweb, Adobe DEI, Klaviyo, Shopify, Bloomreach, Wunderkind Pulse 2025, BigCommerce, eMarketer, Statista, and SparkToro were all checked. Every paid-share-by-vertical chart in market is fabricated or extrapolated.
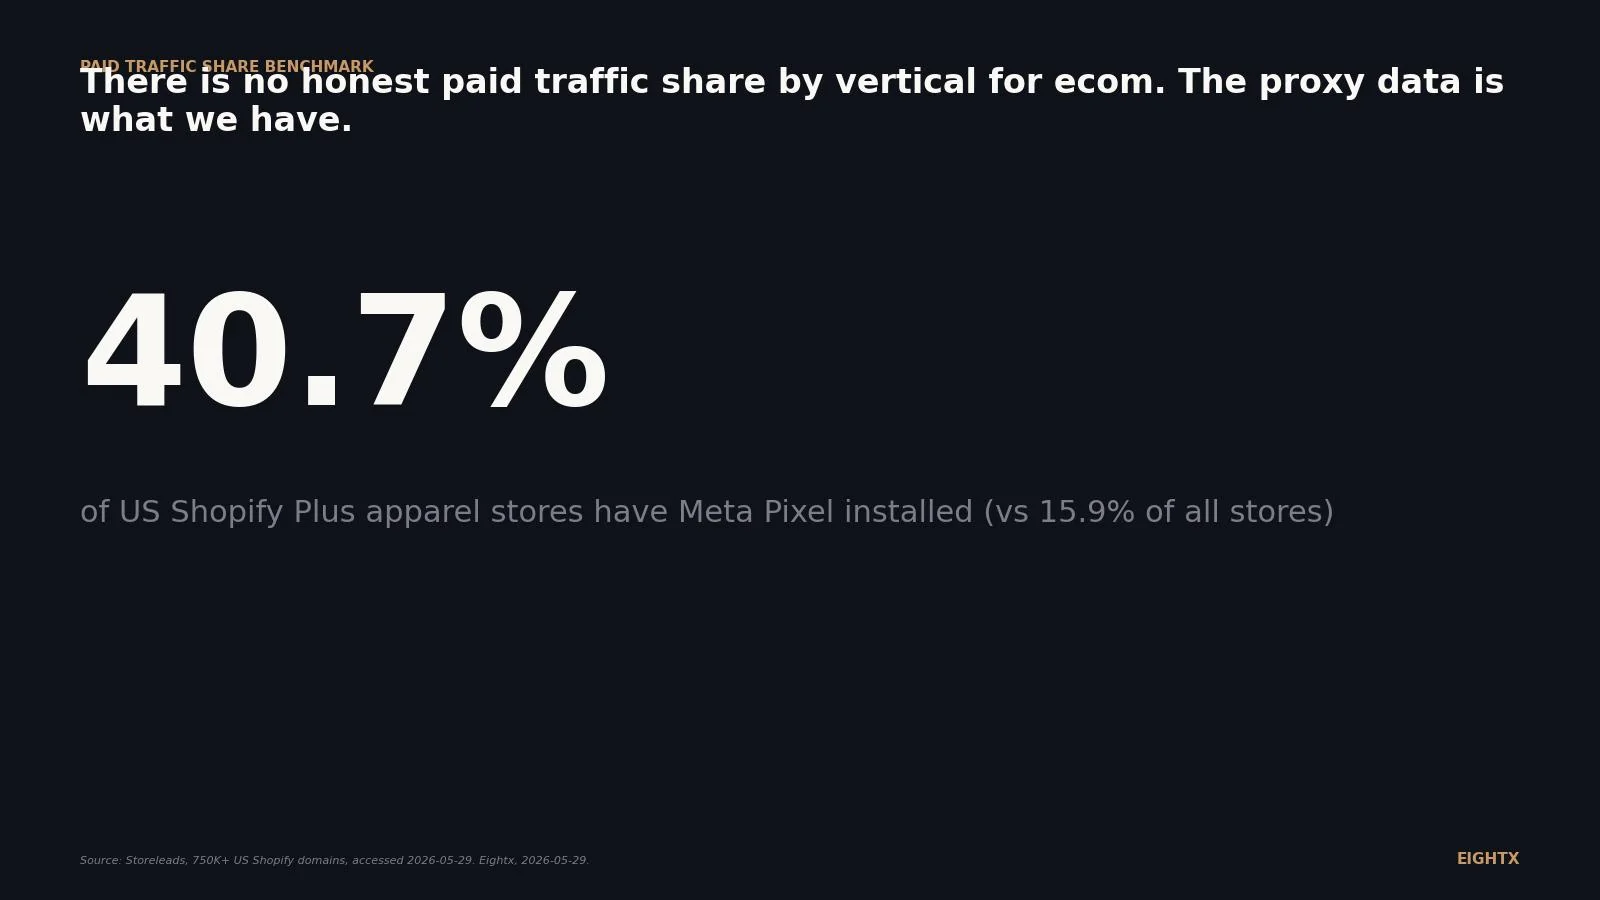
- Meta Pixel adoption among US Shopify Plus apparel stores is 40.7%, versus 15.9% across all US Shopify apparel. The 2.6x gap is the cleanest single-source signal of paid-channel dependency. Source: Storeleads, 6,952 Plus stores and 341,886 all-tier apparel stores.
- TikTok Pixel tracks Meta Pixel almost 1:1 in apparel and beauty (14.6% / 19.3% vs 15.9% / 18.3%), but lags 7-10 points in food, home, sports, and pets. TikTok caught up to Meta in fashion at scale, not in CPG-style categories.
- Public DTC marketing-to-revenue ratios FY2025: Wayfair 11.4%, Revolve 14.3%, Chewy ~6.9%. That 7-15% band is the realistic ceiling for paid intensity at scale. Source: SEC EDGAR 10-K XBRL.
- Klaviyo runs the inverse curve to Meta Pixel. 15.4% of all US apparel stores, 56.4% of Shopify Plus apparel. Email infrastructure scales faster than paid pixels as brands grow.
Every operator wants the answer to "what percent of my traffic should come from paid?" Every vendor benchmark dataset that claims to answer it is reporting spend, revenue, or all-industry aggregates. None publish traffic-share by vertical. We checked ten of them.
This post is the living index of what we can actually verify. Paid-pixel adoption across 750,000+ US Shopify stores by vertical (Storeleads). Marketing-to-revenue ratios from FY2025 public DTC 10-Ks (Wayfair, Revolve, Chewy). The US Census MRTS pure-play ecommerce baseline. We refresh it quarterly because the underlying data refreshes monthly, and because anyone claiming to know your "ideal" paid share without your contribution profit is selling you a benchmark, not a number.
The honest answer: no public dataset gives you average paid traffic share by vertical
A targeted Perplexity Sonar Pro deep research run in May 2026 checked Similarweb, Adobe Digital Economy Index, Klaviyo benchmarks 2025-2026, Shopify Plus, Bloomreach Loop54, Wunderkind Pulse, BigCommerce, eMarketer, Statista, and SparkToro. None publish a comprehensive percentage breakdown of paid vs organic vs direct vs email by vertical for US ecommerce in 2025-2026.
What each actually publishes:
- Similarweb. Industry-channel breakdowns exist inside the platform's Market Research view, but the public 2025 Marketing Benchmark Report excerpts only show all-industry directional numbers (paid traffic up, direct +2.3%) and one-off stats like "banking giants keep 60% of traffic as direct." The vertical-level table is not free.
- Adobe DEI. Focuses on ecommerce sales volume, category growth, and AI traffic. Public PDFs rarely include traffic channel share by vertical.
- Klaviyo benchmarks. Email and SMS performance by industry. Not total-traffic share.
- Shopify. Conversion rate benchmarks by industry, qualitative notes on discovery. No public traffic-mix-by-vertical table.
- Bloomreach. On-site search and personalization metrics for their customer base. Not cross-industry traffic share.
- Wunderkind. Email/SMS and onsite identity-resolution lift for retail/DTC. Not total-traffic share.
- BigCommerce, eMarketer, Statista, SparkToro. Either older (2018-2021 baselines), paywalled, or aggregated above the vertical level.
The 2018-2019 Wolfgang KPI Report (130M sessions, EUR 330M revenue) is the most-cited public global benchmark: paid search 33%, organic 32%, direct 12%, email 9%, social 8%, display 2%. That's all-vertical and pre-COVID. Every "paid traffic share by vertical" chart we've seen citing newer sources extrapolates from that baseline plus qualitative platform commentary. None of them is a primary measurement.
Translation: if a deck or post quotes "apparel runs 45% paid traffic in 2026," the source is either Similarweb behind a login (legitimate, not in the public domain), or an extrapolation dressed up as a measurement (not legitimate). Ask which one.
What we use instead: paid-pixel adoption on 750,000 US Shopify stores
The cleanest publicly-verifiable proxy for paid-channel dependency is whether a storefront has the pixel installed. Storeleads detects Facebook Pixel, TikTok Pixel, Klaviyo, and similar technologies via storefront JavaScript across 750,000+ active US Shopify domains. We queried seven verticals on 2026-05-29.
Vertical US Shopify stores Meta Pixel Meta % TikTok Pixel TikTok % Klaviyo Klaviyo % Apparel 341,886 54,532 15.9% 49,958 14.6% 52,759 15.4% Beauty & Fitness 124,814 22,809 18.3% 24,071 19.3% 15,310 12.3% Food & Drink 81,577 17,732 21.7% 10,157 12.4% 15,310 18.8% Home & Garden 128,615 28,056 21.8% 15,520 12.1% 18,603 14.5% Health 49,889 13,551 27.2% 8,598 17.2% 12,771 25.6% Sports 51,175 10,983 21.5% 5,980 11.7% 8,146 15.9% Pets & Animals 27,273 5,439 19.9% 3,916 14.4% 4,243 15.6%
Three reads jump out. First, paid-pixel adoption sits between roughly 16% and 27% across verticals. Health is the highest at 27.2% for Meta, which tracks the supplements pattern of heavy paid search plus affiliate dependency. Apparel is the lowest at 15.9%, which reflects the long tail of micro-stores that don't run real paid programs.
Second, TikTok closes the gap with Meta in apparel (14.6 vs 15.9) and beauty (19.3 vs 18.3), but trails by 7-10 points in food, home, sports, and pets. Fashion and beauty operators take TikTok as a default channel in 2026. CPG-style operators still treat it as experimental. Both reads are defensible, and the data confirms which one fits your vertical.
Third, Klaviyo adoption broadly tracks paid-pixel adoption with a peak in health (25.6%) and a trough in beauty (12.3%). Email infrastructure tells you whether the brand is investing in retention. Paid pixels tell you whether they're investing in acquisition. The relationship between the two is the most useful operator diagnostic in the table.
Pixel installed is not active spend. A store can carry a Meta Pixel without running campaigns. We're using it as the directional proxy for paid-channel dependency, not a literal "share of stores running ads right now."
Scale rewrites the answer: Plus stores install paid pixels at 2.6x the rate
The Shopify Plus tier (typically $1M+ GMV per store) installs paid pixels at materially higher rates than the all-tier average. We pulled the comparison cleanly for apparel.
Segment US Shopify apparel stores Meta Pixel Meta % TikTok Pixel TikTok % Klaviyo Klaviyo % All stores 341,886 54,532 15.9% 49,958 14.6% 52,759 15.4% Shopify Plus 6,952 2,830 40.7% 2,193 31.5% 3,921 56.4%
Meta Pixel adoption jumps from 15.9% across all US Shopify apparel to 40.7% in the Plus tier. TikTok Pixel goes from 14.6% to 31.5%. Klaviyo from 15.4% to 56.4%.
The Klaviyo gap is the most striking. Email infrastructure scales faster than paid pixels as brands grow. By the time a brand is on Plus, the email program is roughly twice as likely to be on Klaviyo as the paid program is to be on Meta. That confirms what operators already suspect: as you scale, channel diversification kicks in, with email running ahead of the paid expansion curve.
The takeaway: "average paid traffic share by vertical" means a different thing at $0-1M GMV than it does at $10M+ GMV. At the small end, half the stores in the dataset don't have any paid infrastructure at all. At the Plus end, 40%+ do. If you're comparing yourself to an aggregate benchmark, you're comparing yourself to a mixture distribution that says more about Shopify's long tail than it does about scaled DTC. Find your tier first, then benchmark.
We were rate-limited on the Plus pull for the other six verticals in this research pass. We expect the Plus-vs-all gap to repeat in other verticals, but the Q3 refresh will confirm. We'll close the full Plus-vs-all breakdown out in the next update.
What the public 10-Ks reveal about marketing intensity at scale
The other end of the proxy stack is what public DTC pure-plays actually disclose in FY2025 filings. We pulled three: Wayfair (W), Revolve (RVLV), and Chewy (CHWY).
Company Ticker Vertical Marketing / advertising FY2025 Revenue FY2025 % of revenue Accession Wayfair W Home + furniture $1,425M $12,457M 11.4% 0001616707-26-000027 Revolve RVLV Premium apparel $175.4M $1,225.7M 14.3% 0001193125-26-071307 Chewy (est.) CHWY Pet ~$870M (MD&A narrative) $12,601.5M ~6.9% 0001766502-26-000034
Based on these three public DTC pure-plays, the 7-15% band is the realistic ceiling for paid intensity at scale. Premium apparel (Revolve) sits at the top. Home and furniture (Wayfair) sits in the middle. Pet (Chewy, where the ~6.9% figure is an MD&A-narrative estimate, not a clean XBRL pull) sits at the bottom, consistent with subscription auto-ship economics shifting the brand toward retention rather than acquisition spend. Neither Wayfair nor Revolve discloses a performance-vs-brand mix split in XBRL, so we're not assigning one. On Holding, Stitch Fix, and FIGS could be added to the panel with the same methodology in a future refresh.
These ratios are paid-spend intensity, not paid-traffic share. The two correlate but aren't the same. A brand running 14% of revenue through Meta and TikTok will see a higher paid-traffic-share than a brand running 14% through brand-building TV and out-of-home. Without the source/medium breakdown disclosed, you can't translate one to the other cleanly.
What the ratios do tell you: if your DTC business is running paid-marketing intensity north of 15-17% of revenue, you're spending more than scaled public DTCs do. Either your unit economics support it (you're earlier in the LTV curve and need to over-spend on cohort acquisition), or they don't and you're funding a growth illusion. Public DTC ratios bound the question. Your contribution margin answers it.
The pure-play ecommerce baseline matters here too. US Electronic Shopping and Mail-Order Houses (Census MRTS NAICS 4541, seasonally adjusted) hit $128.4B in March 2026, up 10.8% year-over-year from $116.0B. The underlying category is growing. But channel-mix-tightening pressure (rising CPMs, attribution decay post-iOS, fewer cheap clicks) is independent of category growth. Riding a tailwind doesn't fix a broken paid mix.
What this means for your 2026 mix decision
Three diagnostics to run on your own GA4 data this week. They're more useful than any benchmark you'd otherwise reach for.
1. Paid traffic percent, computed your way. In GA4, sum sessions where source/medium contains google/cpc, fb/cpc, tt/cpc, snap/cpc, or your specific paid taggings. Divide by total sessions. That's your paid share. Compare it to your peer set inside your own head, not to the synthetic benchmarks in this post. If your paid share is over 50% and your contribution margin is under 40%, you're running a paid-funded business and you're one CPM spike away from cash trouble.
2. Paid CAC vs blended LTV, 60-day rolling. Most brands measure CAC against blended LTV (paid plus organic plus repeat). The honest measure is paid CAC against paid LTV: take only paid-acquired customers, follow them out 12 months, compute their net contribution. Compare it to your paid CAC. If paid CAC is 1.2x paid LTV, you're financing the brand with cash, not earning it.
3. Paid share of new customers vs paid share of revenue gap. GA4 will show you both. If paid is 60% of new customers but 35% of revenue, paid customers are LTV-dilutive relative to your other channels. That's the inverse of the assumption most operators make. If you can shrink paid spend by 20% without losing new-customer count, the dilutive cohort is funding spend the rest of the business doesn't need.
The point is not to chase a vertical average. There isn't a credible one. The point is to know whether your paid mix is funded by contribution margin or by hope, and the diagnostics above tell you which.
For more on how to size the paid floor against your unit economics, see the True Interest Cost calculator (useful when the paid floor is bridged by RBF or factoring) and the working capital drag calculator (paid spend timing is the second-biggest drag on most DTC working capital after inventory).
How we'll update this index
Quarterly. The Storeleads queries refresh as their crawler does. SEC 10-Ks for FY2026 will land between January and April 2027. Census MRTS publishes monthly with a six-week lag. Next refresh target: 2026-08-29 (Q3 close, including the apparel-only Shopify Plus gap closed out across the other six verticals).
What would flip the read: a real public benchmark dropping (Similarweb shipping the State of Retail 2026 traffic-channel tables outside the paywall is the most likely candidate). The Shopify Plus pixel gap closing materially (TikTok catching Meta in food or home would be the cleanest signal of TikTok crossing into CPG dominance). FY2026 public-DTC marketing intensity dropping below 7% at any scaled brand (a sign the paid-traffic-share-by-revenue ratio is breaking down structurally).
Stop benchmarking against industry-average traffic-mix charts that don't exist as primary data. Start benchmarking against your own contribution-margin-funded paid floor. The most-true number you can run is your own, not someone else's average.
Sources and methodology
Storeleads queries. All queries executed 2026-05-29 via the Storeleads MCP search_stores endpoint. Common filters: platform=shopify, country=US. Category filter used Storeleads' leading-slash labels: /Apparel, /Beauty & Fitness, /Food & Drink, /Home & Garden, /Health, /Sports, /Pets & Animals. Technology filters: Facebook Pixel (Meta), TikTok Pixel, Snap Pixel, Klaviyo. The Shopify Plus subset used plan="Shopify Plus". Pixel installed is detected from storefront JavaScript and does not confirm active campaigns. This is a directional proxy for paid-channel dependency, not a literal "% of stores running ads" measurement.
SEC EDGAR XBRL pulls. Wayfair (CIK 1616707, accession 0001616707-26-000027, 10-K filed 2026-02-19): AdvertisingExpense $1,425M, RevenueFromContractWithCustomerExcludingAssessedTax $12,457M. Revolve (CIK 1746618, accession 0001193125-26-071307, 10-K filed 2026-02-25): MarketingExpense $175.397M, revenue $1,225.682M. Chewy (CIK 1766502, accession 0001766502-26-000034, 10-K filed 2026-03-25, fiscal year 2025-02-03 to 2026-02-01): XBRL does not expose a clean Advertising or Marketing line for FY2025. The ~6.9% figure is an editorial estimate derived from MD&A narrative.
US Census MRTS. census_retail_trade_query, category_code 4541 (Electronic Shopping and Mail-Order Houses, the closest pure-ecom proxy), data_type_code SM (sales in $M), seasonally_adj yes. Pulled monthly Jan 2024 through Mar 2026. March 2026 print: $128,366M. March 2025 baseline: $116,016M. Year-over-year: +10.8%.
Perplexity Sonar Pro deep research. Run 2026-05-29 with search_depth=high, recency=year. Query summarized: "For 2025-2026, what is the breakdown of US ecommerce website traffic by source, by industry vertical, pulling specific percentage data from Similarweb, Adobe Digital Economy Index, Klaviyo benchmarks 2025, Shopify Plus, Bloomreach Loop54, Wunderkind Pulse, BigCommerce, eMarketer, Statista, and SparkToro." Result: no source publishes traffic-share by vertical in the format requested. This is the basis for the "no public benchmark exists" finding.
Limitations. Storeleads detects pixel JavaScript, not active spend. The all-tier Shopify universe includes the long tail of micro-stores that depress the all-store rate; Plus stores are a more accurate proxy for what scaled DTC actually does. Public DTC marketing-to-revenue ratios are paid-intensity, not paid-traffic-share. The Chewy ratio is an editorial estimate from MD&A narrative rather than a clean XBRL tag. Pinterest tag and Google Ads conversion tag are not directly tracked as named Storeleads technologies. The data behind this post is the strongest publicly-verifiable approximation available in May 2026; it is not a primary measurement.
Update cadence. Quarterly, with the next refresh target 2026-08-29. The full triangulation research bundle for this post lives at new-blogs/published/average-ecommerce-paid-traffic-share-by-vertical-2026/research.md.
Frequently asked questions
what percent of ecommerce traffic actually comes from paid in 2026?
Honest answer: nobody publishes a clean cross-vendor benchmark for it. The closest proxy is paid-pixel install rates on Shopify storefronts (15.9-27.2% Meta Pixel across seven US verticals, with Health the outlier at 27.2%; 40%+ at Shopify Plus apparel) plus public DTC marketing-to-revenue ratios (7-15% of revenue at scale, based on three pure-plays: Wayfair, Revolve, Chewy). Anything more precise than that is extrapolation. Your own GA4 source/medium breakdown is the only number that matters for your business.
is there a real public benchmark for paid traffic share by vertical or is everyone making it up?
It's mostly extrapolation. We checked Similarweb, Adobe DEI, Klaviyo, Shopify, Bloomreach, Wunderkind, BigCommerce, eMarketer, Statista, and SparkToro in May 2026. None publish a free, comprehensive paid-vs-organic-vs-direct-vs-email-vs-social breakdown by vertical for 2025-2026. Similarweb's industry view exists inside the platform but not in any public PDF. If a blog post is citing exact percentages from those sources, ask where the underlying table is.
what marketing-to-revenue ratio do public dtc brands actually run at?
FY2025 data: Wayfair 11.4% (home and furniture, $1.43B advertising on $12.46B revenue), Revolve 14.3% (premium apparel, $175M marketing on $1.23B revenue), Chewy approximately 6.9% (pet, $870M estimated on $12.6B revenue, MD&A narrative). Scaled DTC sits in the 7-15% band. Sub-scale and growth-stage DTC often runs above that band because efficiency scales with size.
if 40 percent of shopify plus apparel stores have meta pixel installed what does that mean for my own paid mix?
It means at the Shopify Plus tier (typically $1M+ GMV), Meta paid is table stakes, not differentiation. The right read: don't ask whether to run Meta. Ask what share of revenue your paid spend has to drive and whether your contribution margin funds it. Pixel installed does not mean active spend. It means the infrastructure is there. The 40.7 percent number is a ceiling on operator intent, not a floor on operator outcomes.
is tiktok ads actually catching up to meta for apparel and beauty dtc?
In apparel and beauty, yes. TikTok Pixel adoption is 14.6% in apparel vs 15.9% Meta. In beauty it's 19.3% vs 18.3% (TikTok narrowly ahead). In food, home, sports, and pets, TikTok still trails Meta by 7-10 points. The implication: if you're in fashion or beauty and your team thinks TikTok is experimental, your peer set already runs it. If you're in CPG-style verticals, you're earlier in the curve.
should i still run snap and pinterest pixels in 2026 or are they dead?
For most US Shopify operators, yes effectively. Snap Pixel sits at 1.4% adoption in apparel (4,858 of 341,886 stores). Pinterest tag and Google Ads conversion tag are not directly tracked as named Storeleads technologies, so this duopoly framing applies to paid social only, not to paid search. Paid social on Shopify storefronts is empirically a Meta plus TikTok duopoly. Snap and Pinterest can still work for specific creator-driven niches but are not the default infrastructure choice in 2026.
what's a sustainable paid floor as percent of revenue for a 5m to 50m dtc brand?
Not derivable from this dataset alone. Public-DTC marketing intensity (7-15% at scale) is your ceiling, not your floor. Your floor is whatever your contribution margin funds after returns, fulfillment, payment processing, and customer service. The right framing: contribution margin times target paid-driven gross profit minus everything else equals your paid floor. If your contribution margin is 50 percent and your blended target is to recover paid spend at 1.5x in 90 days, your paid floor is bounded by the math, not by an industry average.
how do public dtc 10-k disclosures help me benchmark my own ad spend?
Two ways. First, they bound the realistic intensity range (7-15% at scale). Second, MD and A narrative around marketing investment tells you what mature DTC brands prioritize once paid becomes structural rather than experimental. Wayfair's FY2025 advertising disclosure is $1.43B total. Revolve's is $175.4M total. Neither breaks out a performance-vs-brand split in XBRL. Use the headline ratios as anchors, not as targets, and read the MD and A directly if you want the mix narrative.