
Insights
Average ecommerce customer service cost per order by vertical, 2026: $0.15 to $0.55 across six categories
Customer service cost per order in US ecommerce ranges from $0.15 to $0.55 across six verticals in 2026, based on BLS wage data combined with Gorgias and Zendesk benchmarks. Apparel sits at a $0.42 median because return-driven contacts are high. Food and CPG lands at $0.22 because repeat purchasers ask fewer questions. Every $0.10 improvement at 100,000 orders per year saves $10,000.
Key Takeaways
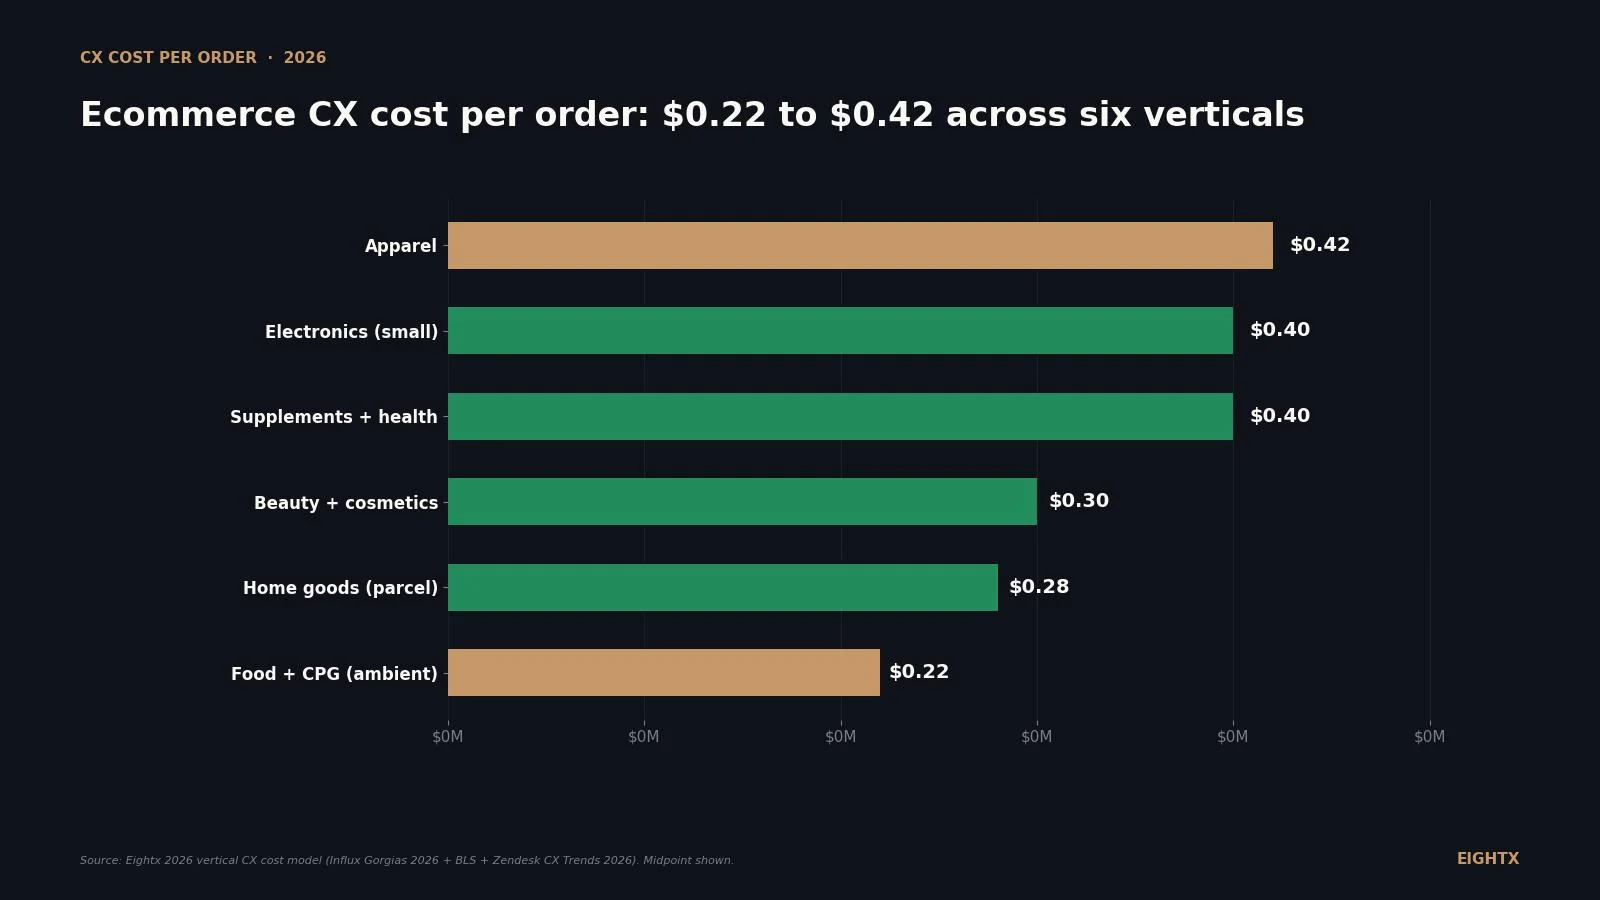
- All-in 2026 ecommerce CX cost per order (CX = customer service, the helpdesk + labor + AI bill) lands between $0.15 and $0.55 across six verticals. Apparel midpoint $0.42, electronics $0.40, supplements $0.40, beauty $0.30, home goods $0.28, food and CPG $0.22. The gap between median and top quartile is real money at $20M+ GMV.
- US telephone call-center employment (NAICS 561422) fell to 278,900 in March 2026, down 7.4% year-over-year and ~42% from the 2018 peak of ~485,000 (BLS CES6056142201). The labor pool you used to staff against is permanently smaller. AI is doing the displacing.
- Median cost per inbound message across Gorgias ecommerce accounts in 2026 is $2.30 (range $0.89 to $7.35; top teams at $1.00 to $1.50). At 2-3 messages per ticket, that back-solves to $2.70 to $5.60 per ticket: well below the $6 to $12 cross-industry human-handled benchmark.
- AI is doing two jobs that operators confuse: deflection and resolution. Zendesk CX Trends 2026 puts median tier-1 AI deflection at 41.2% (top quartile 58.7%). Influx puts median AI resolution on tickets that do enter the queue at 10% (target band 10 to 20%). They're not the same number and they multiply.
- Customer service representative median weekly earnings hit $934 in 2025, up 7.6% year-over-year (FRED LEU0254553800A). Your BPO renewal in 2026 will price differently than your 2024 renewal did. Push for AI-credit blending, not headcount discounts.
If you run a US ecommerce brand and someone on your team asked "what should customer service actually cost us per order," most of the public benchmarks you'll find are either cross-industry ($6 to $12 per ticket) or vendor-flavored (Gorgias's $2.30 per message median is real but not framed per order). The number an operator actually needs is the all-in CX (customer service) cost per order, broken by vertical, with the contact rate and cost per ticket that get you there. That's what this post is. Across six US ecommerce verticals in 2026 our model puts the all-in CX cost per order at $0.15 to $0.55, with apparel and supplements at the top end and food and CPG at the bottom. The number sits well below fulfillment and payment processing on the contribution-margin line (CX at $0.22-$0.42 versus fulfillment at $6-$12 and payment processing at ~$3.50 on a $120 AOV), but the gap between median and top quartile is real money once you cross $20M GMV.
What "customer service cost per order" actually includes in 2026
Four components, in order of size on most P&Ls.
Human labor. In-house CX team salaries plus offshore BPO contracts plus benefits. For a $5M-$50M US DTC brand, based on Eightx's call library of 5,400+ founder conversations, the realistic mix is 30-60% in-house (escalations, VIP, brand voice), 30-60% offshore Tier 1 (Philippines or India), and 5-15% AI agent. This is the line that moves the most when you renegotiate.
Helpdesk software. Gorgias, Zendesk, Front, Kustomer, Re:amaze. Gorgias public pricing 2026 puts Advanced at $900 per month for 5,000 tickets (~$0.18 per ticket software-only) with overages at $0.36-$0.40 per ticket. Helpdesk software is usually 5-15% of total CX cost. Don't optimize this line, it's not where the savings are.
AI agent fees. Gorgias Automate, Zendesk AI, Fin.ai, Ada, Intercom Fin. Pricing is typically per-resolution ($0.30 to $1.00) or seat-based. Plan for AI to handle 10-20% of tickets that enter the queue plus a bigger share of pre-purchase chat (which deflects before becoming a ticket).
Payment-dispute and chargeback handling, plus QA overhead. Usually folded into the in-house team or outsourced to a chargeback specialist. We exclude this from the per-order benchmark below because it varies wildly by payment processor and fraud profile. Treat it as an additional 5-15% on top of the numbers in this post if your dispute volume is meaningful.
The formula. There are two versions and operators routinely confuse them.
``` Base handling cost per order = (tickets / orders) x cost per ticket = contact rate x cost per ticket
Fully-loaded CX cost per order = base handling x loading factor (1.0x to 1.9x) ```
The base handling number is the one Influx and Gorgias publish, and it's what you get if you take inbound message volume times average cost per message and divide by orders. The fully-loaded number is what actually lands on your P&L. The loading factor is the wrapper of costs that are real but don't price per-ticket: CX leadership and manager salaries, QA and training, escalation handling, returns-driven repeat contacts that share a ticket ID but cost more to resolve, helpdesk subscription overage, and AI/automation platform fees billed as flat retainers rather than per-resolution. On the verticals we see in our call book it runs 1.0x to 1.9x, lowest on supplements and electronics (where the raw ticket already includes the complex handling) and highest on food/CPG and apparel (where simple per-message economics hide a real overhead and escalation load).
That's the line item to re-cost. Everything else (CSAT, response time, first-contact resolution) is an input or output but not the dollar number that lands on your P&L.
This post excludes returns-processing logistics (driven by average ecommerce return rate, which we cover separately), inbound logistics escalations, and CX-led retention work.
The 2026 numbers, by vertical
The headline visual. Apparel and supplements at the top of the range, food and CPG at the bottom. Midpoints clustered around $0.22 to $0.42.
The detail underneath the chart.
Vertical Contact rate (tickets/order) Cost per ticket ($) Fully-loaded CX cost per order ($) Primary cost drivers Apparel 6-8% $3.00-$4.50 $0.30-$0.55 Size/fit + returns + exchanges Beauty and cosmetics 5-7% $3.00-$4.00 $0.20-$0.40 Product questions + replenishment Supplements and health 8-10% $3.50-$5.00 $0.30-$0.50 Subscription + dosage + regulatory Electronics (small) 7-9% $3.50-$5.60 $0.30-$0.50 Setup + troubleshooting + warranty Food and CPG (ambient) 3-5% $2.70-$3.50 $0.15-$0.30 Order status + delivery windows Home goods (parcel) 4-6% $3.00-$4.50 $0.20-$0.35 Delivery + damage claims + returns
How we built this matters. No public Gorgias, Zendesk, Influx, or Lorikeet dataset publishes a cost-per-order matrix by vertical. The numbers above are an Eightx synthesis in two layers. Layer one is base handling = vertical contact rate x cost per ticket: contact rates from Influx, Lorikeet, and Zendesk 2026 benchmarks (cross-checked against return-rate data from our average ecommerce return rate post, where apparel return rate ~25% drives more contacts and food/CPG ~12% drives fewer); cost per ticket from Influx 2026 median cost per message ($2.30) x typical 2-3 messages per ticket. Layer two is the 1.0x-1.9x fully-loaded multiplier, calibrated from the Eightx founder-call library, which wraps in the overhead, escalation handling, and flat-fee AI/platform charges that don't price per ticket but show up on the P&L. Treat the midpoints as planning anchors, not measured medians. A $20M apparel brand running base handling at $0.33 and fully loaded at $0.42 per order is at the model midpoint; the same brand fully loaded at $0.55 is at the high end (either heavy US in-house mix or carrying too much CX overhead) and has room to compress.
The vertical pecking order tracks two things: how often a customer needs to contact you (driven by return rate and product complexity) and how long the contact takes (driven by ticket type). Apparel customers contact you for size and fit which is a longer ticket. Food and CPG customers contact you for "where is my order" which is a 30-second deflectable. The cost-per-order spread is mostly structural.
The AI displacement signal: why your cost line should reflect it
The labor pool you used to staff against is permanently smaller. US telephone call-center employment (NAICS 561422) was 278,900 in March 2026 per the BLS Current Employment Statistics survey: down 7.4% year-over-year and roughly 42% below the 2018 peak of ~485,000 jobs.
The steepest leg of the decline came after early 2023 as generative AI hit production. From January 2023 to March 2026 the series dropped from 383,800 to 278,900, a 27% fall in 38 months. That is not a recession dip. That is structural displacement, and it is the reason ecommerce cost per ticket ($2.70 to $5.60) now sits cleanly below the cross-industry human-handled benchmark of $6 to $12 per ticket. AI deflection (handles inbound before it becomes a ticket) plus offshore labor (handles the long tail at a lower hourly rate) plus AI resolution (closes the ticket without a human) have re-baselined the floor.
Three operator implications.
Your floor is lower than it was in 2024. If your 2024 CX cost per order was $0.55 and you have not touched the stack since, you are probably overpaying by $0.10 to $0.20 per order. At 200,000 orders per year that is $20,000 to $40,000.
Your BPO partner's cost base is up, not down. The CSR median weekly earnings figure climbed 7.6% in 2025 (FRED LEU0254553800A). Wage inflation on the people who remain is real. Don't expect headcount-driven cost reductions on renewal. Expect AI-blending to be the lever.
The hardest tickets are getting harder. The tickets that survive AI deflection and AI resolution are by definition the complex, unhappy, or VIP ones. Average handle time on the human-handled queue appears to be stretching on the founder calls we've heard this year, though we don't have a clean industry-wide stat yet. Your in-house Tier 2/3 team is more expensive per ticket than it was, even if your blended cost per order is down.
The Gorgias and Influx benchmarks every operator should be comparing to
Influx published its 2026 Gorgias AI performance benchmarks in early 2026. Five numbers from that report belong on every CX operator's wall.
Cost per inbound message: $2.30 median. Full range $0.89 to $7.35. Top teams operate at $1.00 to $1.50 per message. If your number is above $5 you are either paying US in-house rates exclusively or carrying significant unproductive headcount.
AI resolution: 10% median, 10-20% target band. Influx is explicit that pushing above 20% AI resolution starts to erode experience. The top 3-5 ticket types to automate are order status, shipping, returns, and basic product questions. Below 10% means you are leaving efficiency on the table. Above 20% means you may be choking off the path to a human for tickets that need one.
CSAT 4.40 median, 4.6+ "good" benchmark. Range 2.96 to 4.90 on the 5-point scale. If you are running CSAT below 4.0 and AI resolution above 15%, the AI is hurting more than helping.
Shoppers who chat convert 154% higher. From Gorgias 2026 conversational commerce data. The reason AI deflection on pre-purchase chat is a net-positive lever is conversion, not cost savings. The cost savings come from post-purchase deflection.
Software-only floor: $0.18 per ticket. Gorgias Advanced is $900 per month for 5,000 tickets in 2026 public pricing. Below that, you are paying overage rates of $0.36 to $0.40 per ticket which add up fast on a brand doing 8,000+ tickets per month. Right-size your Gorgias tier to your actual ticket volume.
If you want to find these numbers in your own helpdesk:
- Cost per message: total monthly CX spend (labor + tools + AI) divided by total inbound messages. Gorgias surfaces this as a "ticket cost" estimate in the Performance tab if you've configured cost inputs.
- AI resolution: Gorgias Automate reports this as the share of tickets fully closed by Auto-Respond without human intervention. Track over a rolling 30 days.
- CSAT: post-resolution survey. Gorgias and Zendesk both deliver this natively.
The wage and headcount squeeze on your BPO
Two trends moving in opposite directions explain why your 2026 BPO contract will price differently than your 2024 contract did.
Customer service representative median weekly earnings climbed from $683 in 2018 to $934 in 2025, a 37% increase, per the BLS Current Population Survey (FRED LEU0254553800A). The 2025 reading of +7.6% year-over-year is the fastest single-year increase since 2021's 8.2% post-pandemic spike. Meanwhile US call-center employment fell from ~485,000 in early 2018 to 278,900 in March 2026, a 42% headcount contraction.
Translation: your BPO partner is paying more for fewer people. Their margin has been compressed for three years and they have already cut what they can on headcount. The lever your 2026 renewal conversation should focus on is not "give me a 10% rate cut" (they can't), it is "give me an AI-blended SLA where X% of tickets route to bot at $Y per resolution and the rest get human handling at the current rate." The economics work for both sides: they keep their hourly rate, you get blended cost down, and the bot does the tickets nobody wanted to staff anyway.
Three offshore reference points for 2026:
- Philippines: $2.50 to $4.00 per hour with benefits via established BPO; $3.00 per hour remote-direct (HireTalent.ph 2026 guide). Manila CSR averages ₱85 per hour (~$1.50 USD per hour) at the worker level, which is why the BPO markup is most of the bill.
- India: $7 to $17.50 per hour range (Ever-help.com 2026 outsourcing cost guide). Higher than Philippines but with stronger English and technical depth, which matters for electronics and SaaS-adjacent brands.
- Eastern Europe (Ukraine, Poland): $13 to $35 per hour. Use when you need overlap with EU business hours and a higher tier of technical handling.
US in-house benchmarks for comparison: BLS OEWS May 2024 data puts the customer service representative median hourly wage at $20.59 (lowest 10% < $14.75, highest 10% > $30.16). Fully loaded with benefits and overhead that's typically $28 to $35 per hour, or roughly $5 to $8 per ticket at 4-7 tickets per hour throughput.
How to use these benchmarks on your own P&L
Three moves this week.
Compute your contact rate. Last 90 days of helpdesk inbound divided by last 90 days of Shopify orders shipped. If you are above 8% in any vertical that is not supplements or electronics, the gap is almost always top-funnel: shipping page, return policy, sizing chart, FAQ coverage. Half the answer to "lower CX cost" is "create fewer reasons to contact us."
Benchmark your cost per ticket against the $2.70 to $5.60 ecommerce band. Total per-ticket variable spend (in-house labor + BPO + helpdesk + per-resolution AI fees) divided by total tickets resolved. If you are above $5.60, decide whether the gap is mix (too much US in-house on tickets that could be offshore), productivity (low tickets-per-hour throughput), or loading (CX overhead leaking into your per-ticket calculation, which means your real base handling is lower and the loading factor is higher than you think).
Decide whether your gap is contact rate or cost per ticket. This matters because the fixes are different. A high contact rate fix is content and product work (sizing pages, proactive shipping comms, FAQ depth). A high cost-per-ticket fix is staffing mix and automation (more AI on order-status, more offshore on Tier 1, US in-house only on escalations). Most $5M-$50M DTC brands have a gap on both. Pick the larger one to attack first.
The 2026 number to remember: ecommerce CX costs $0.15 to $0.55 per order, depending on your vertical. The gap between top quartile and median is roughly $0.10 to $0.15 per order. At 200,000 orders that's $20,000 to $30,000 a year. It compounds when the same lever (AI deflection on order-status) also lifts conversion by 154% on pre-purchase chat. Re-cost your CX line before you finalize 2026 H2 staffing or sign your next BPO renewal.
What we're watching next
Four data points will move the numbers in this post over the next two quarters.
The next BLS Current Employment Statistics release covering April 2026 data drops in early June. We will be watching whether telephone call-center employment turns positive year-over-year for the first time since June 2022 (unlikely) or stabilizes around 280,000 (more likely).
Gorgias's 2026 H2 State of Conversational Commerce report typically lands in October. The Influx benchmark refresh historically tracks two months behind. Both should update the cost-per-message and AI-resolution medians.
Zendesk CX Trends 2027 publishes in February 2027. The tier-1 deflection number (41.2% median in 2026) is the biggest single variable in our model: if it climbs to 50%+ at the median, the cost-per-order ranges in this post all compress 15-20%.
Fin.ai's AI agent containment data updates monthly. The 67% Fin-platform resolution rate is not directly comparable to the Influx 10% Gorgias number (different scope) but Fin's trajectory is the leading indicator for where the rest of the market goes in 12-18 months.
For related per-order cost benchmarks, see what is fulfillment cost per order (sister cost line on the CM2 stack) and average ecommerce return rate (return rate drives a meaningful share of contact rate). For the strategic read on how CX cost interacts with the rest of your contribution margin, see fractional CFO services for ecommerce.
Sources and methodology
BLS Current Employment Statistics, NAICS 561422 Telephone Call Centers (CES6056142201). Monthly seasonally-adjusted employment in thousands. March 2026 preliminary reading of 278.9 versus March 2025 of 301.1 produces a -7.37% year-over-year change. The 2018 January peak of 489.3 versus the March 2026 reading produces a -43.0% peak-to-trough drop (we round to ~42% in the body for narrative simplicity). Window pulled: 2018-01 to 2026-03.
BLS Current Employment Statistics, NAICS 5614 Business Support Services (CES6056140001). Parent industry to 561422. April 2026 preliminary reading of 628.1 versus April 2025 of 662.1, -5.14% year-over-year. Confirms the 561422 directional trend at the parent NAICS level.
FRED LEU0254553800A. Median usual weekly nominal earnings, customer service representative occupations, annual, from BLS Current Population Survey. 2025 = $934 (+7.6% year-over-year); 2024 = $868; 2018 = $683. The 2018-to-2025 cumulative wage growth of +36.7% is the data point that tells the operator story: AI is cutting headcount, not wage cost.
Influx 2026 Gorgias AI performance benchmarks. Median cost per inbound message $2.30 (range $0.89 to $7.35); top-team target $1.00 to $1.75; AI resolution median 10% with recommended band 10-20%; CSAT median 4.40 (range 2.96 to 4.90, "good" 4.6+). This is the strongest secondary source for ecommerce-specific CX economics in 2026.
Zendesk CX Trends 2026. Median tier-1 AI deflection 41.2% (top quartile 58.7%; bottom quartile 22.4%); 76% of businesses adopting AI / contextual intelligence trends; 98% of high-maturity CX organizations have AI reasoning controls versus 40% of low-maturity. Tier-1 deflection is a different metric from AI resolution: deflection is before-ticket, resolution is after-ticket-enters-queue.
Lorikeet 2026 Contact Center Benchmarks. Cross-industry cost per contact: $1.84 self-service, $13.50 human-assisted; ecommerce cost per ticket band $2.70 to $5.60. Confirms the gap between ecommerce CX economics and cross-industry generic baselines.
Fin.ai 2026 ROI of AI Customer Service. Human-handled ticket cost $6 to $12 cross-industry; Fin AI agent platform-resolution 67% median (top performers 80-84%, max 93%); 40-60% initial, 60%+ at 6-12 months. Fin's "AI resolution" definition is broader than Gorgias's, which is why the gap between Fin's 67% and Influx's 10% is definitional rather than contradictory.
The vertical cost-per-order matrix in this post is an Eightx synthesis, not a published industry dataset. No public Gorgias, Zendesk, Influx, or Lorikeet release publishes a cost-per-order by vertical table. We constructed it in two steps. (1) Base handling cost = vertical contact rate x cost per ticket. Contact-rate ranges synthesized from Influx contact-rate methodology, Lorikeet 2026 enterprise CX benchmarks, and return-rate data from our companion /blog/average-ecommerce-return-rate post. Cost-per-ticket ranges from Influx 2026 median cost per message x typical 2-3 messages per ticket, cross-checked against Lorikeet 2026 ecommerce ranges. (2) Fully-loaded cost per order = base handling x 1.0x-1.9x loading factor. The loading factor captures CX leadership/manager salaries, QA and training overhead, escalation handling, returns-driven repeat contacts, helpdesk subscription overage, and AI/automation platform fees billed as flat retainers (not per-resolution). The factor is calibrated from the Eightx call library of 5,400+ founder conversations and is lowest on supplements/electronics (where complex handling is already priced into the raw ticket) and highest on food/CPG/apparel/home goods (where simple per-message economics hide real overhead and escalation load). Ranges intentionally bracket the median DTC merchant. Pure-offshore programs with light overhead land at the bottom of the ranges; pure-US in-house programs with heavy overhead land at the top.
Limitations the operator should know. First, vertical numbers are planning benchmarks, not measured medians. Second, the numbers exclude returns-processing logistics (covered separately), payment disputes, and CX-led retention work. Third, AI deflection and AI resolution definitions vary materially across vendors (Gorgias "AI resolution" is not the same scope as Fin.ai "AI resolution" or Zendesk "tier-1 deflection"); we use each in the post with its source's definition attached. Fourth, the Influx blog is an Influx-Gorgias partnership perspective and the numbers should be read as Gorgias-ecommerce specific, not platform-neutral DTC industry data.
Update cadence. This is a living index, refreshed quarterly when BLS data, Influx benchmarks, and Zendesk CX Trends releases land together. Next planned refresh: August 2026 after the Q2 BLS update.
Frequently asked questions
what is the average customer service cost per order for ecommerce in 2026?
Across six verticals our 2026 model puts the all-in CX cost per order between $0.15 and $0.55. Midpoint by vertical: apparel $0.42, electronics $0.40, supplements $0.40, beauty $0.30, home goods $0.28, food and CPG $0.22. That includes helpdesk software, blended human labor (in-house plus offshore), and AI agent fees. It excludes returns-processing logistics, payment disputes, and CX-led retention work.
how many tickets per order should i expect for a dtc apparel brand?
Apparel typically sits at 6-8% contact rate in 2026, meaning 6 to 8 tickets per 100 orders. Drivers are size and fit questions, exchanges, and returns. Mature apparel programs with strong sizing pages, photo-on-model coverage, and proactive shipping updates can pull this below 5%. Brands without those pieces drift to 8-10%.
what is a normal cost per ticket for ecommerce in 2026?
Influx 2026 puts median cost per inbound message at $2.30 across Gorgias ecommerce accounts (range $0.89 to $7.35). At 2-3 messages per ticket, that back-solves to roughly $2.70 to $5.60 per ticket for ecommerce. The cross-industry human-handled benchmark sits at $6 to $12 per ticket, so ecommerce already runs below the generic baseline thanks to AI deflection and offshore labor.
what's a healthy ai deflection rate for a dtc brand in 2026?
Zendesk CX Trends 2026 puts median tier-1 AI deflection at 41.2%, top quartile at 58.7%, bottom quartile at 22.4%. Tier-1 deflection is the share of inbound queries that resolve before becoming a ticket (self-service plus knowledge base plus bot containment). If you are below 30% your top-of-funnel CX experience needs work before you spend on more AI.
what's the difference between ai deflection and ai resolution?
Deflection happens before a ticket enters the queue (a shopper self-serves on your shipping page, a bot answers a pre-purchase question, the order-tracking page kills a 'where is my order' message). Resolution happens after a ticket is in the queue (the AI agent fully closes the ticket without a human). Influx puts ecommerce AI resolution at 10% median, recommended 10-20%. Zendesk puts tier-1 deflection at 41.2% median. They multiply, not substitute. About 41% never become tickets, then 10-20% of the remainder close without a human, leaving 40-50% for your team.
should i offshore my cx team in 2026 or use ai instead?
Run both. Philippines BPO standard pricing in 2026 is $2.50 to $4.00 per hour with benefits via established BPO ($3.00 per hour remote-direct), India $7 to $17.50 per hour, Eastern Europe $13 to $35 per hour. AI agents resolve roughly 10-20% of ecommerce tickets at $0.30 to $1.00 per resolution. The right mix is AI on the top 3-5 ticket types (order status, shipping, returns, basic product questions) plus offshore Tier 1 for the long tail plus US in-house for escalations and VIP. Going pure-AI breaks at low-confidence edge cases. Going pure-offshore leaves money on the table.
how do i calculate my contact rate?
Pull total inbound tickets from your helpdesk for the last 90 days. Pull total orders shipped from Shopify for the same period. Divide tickets by orders. That's your contact rate as a percentage. If you get 5,000 tickets on 80,000 orders, your contact rate is 6.25%. Pair it with your cost per ticket (per-ticket variable spend divided by total tickets resolved) and you have base handling cost per order = contact rate x cost per ticket. Multiply by your loading factor (1.0x-1.9x for the overhead, escalation, and platform fees that don't price per ticket) to get the fully-loaded cost per order that matches the table above.
what cx cost should i model for a $50m dtc brand at 8% contact rate?
At $50M GMV and ~$120 AOV that's roughly 417,000 orders per year. At 8% contact rate that's 33,300 tickets. At the median ecommerce cost per ticket of $4.15 (midpoint of the $2.70-$5.60 band), base handling runs $138,000 per year or $0.33 per order. Add the 1.25x fully-loaded multiplier (CX leadership, QA, training, escalations, platform AI/tool fees) and you land at roughly $173,000 per year or $0.42 per order, which is the apparel-vertical midpoint in the table above. A top-quartile program at $2.70 per ticket and a tighter 1.1x loading runs about $99,000 fully loaded. A bottom-quartile program at $5.60 per ticket and a heavier 1.5x loading runs about $279,000. The $180,000 gap between best and worst on a $50M brand is what re-costing your CX line buys you.