
Insights
DTC wage inflation by function 2026: where your payroll is actually getting more expensive (BLS CES + OEWS)
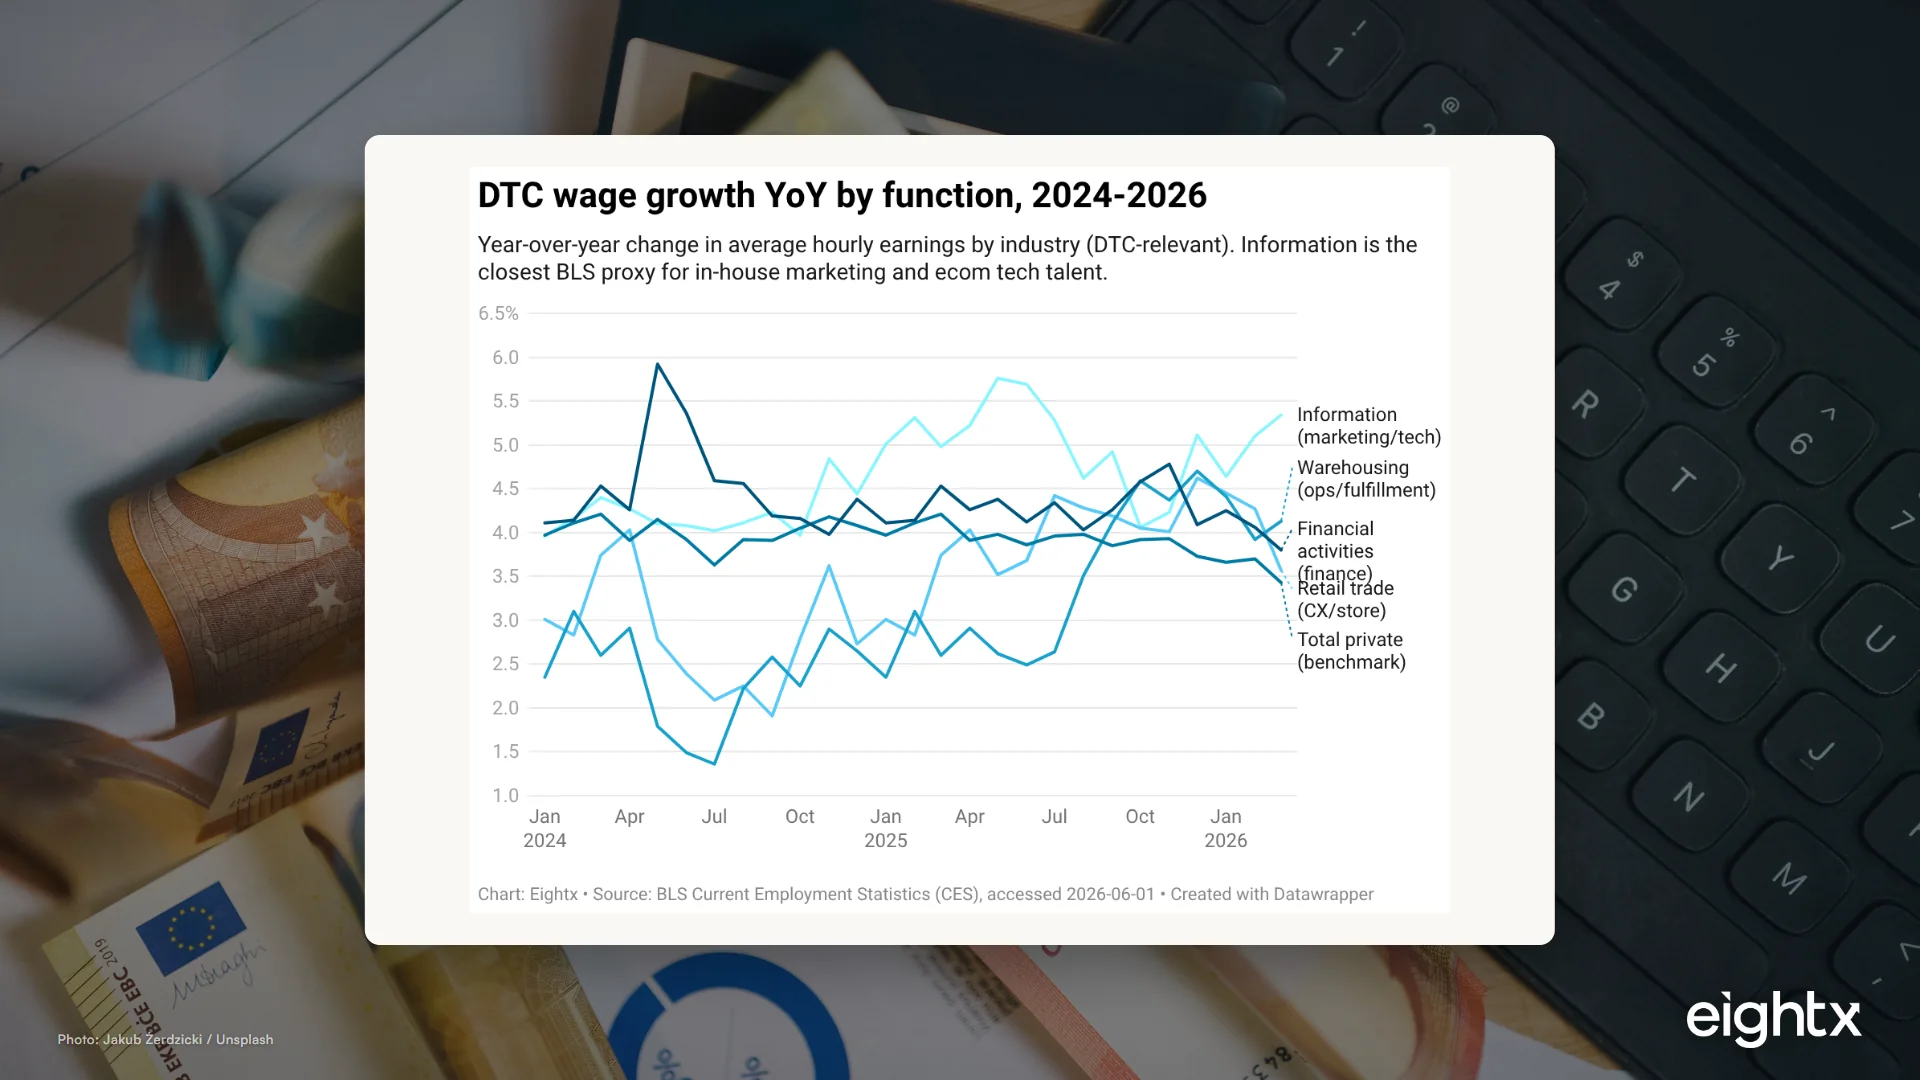
For DTC brands in 2026, wage inflation is highest in information roles (e.g., marketing, tech) at +5.3% year-over-year, warehousing at +4.1%, and financial activities at +3.8%. This functional increase, reported by BLS CES data, significantly exceeds the total private sector average wage growth of +3.4%.
Key Takeaways
- Information-sector wages (the closest BLS proxy for in-house marketing and ecom tech roles) rose 5.3% year-over-year in March 2026 to $54.60/hr. That is roughly 1.9 percentage points hotter than the +3.4% total-private benchmark every operator is quoting.
- Warehousing wages are up 4.1% YoY even as warehousing employment shed 1.4% YoY. Fewer bodies, more expensive per body. Your 3PL has lost margin and will pass it on at renewal.
- Financial activities (+3.8%) and Retail trade (+3.3%) are tracking near the total-private benchmark. Hold finance and CX merit budgets near 3.5% unless you're hiring DTC-fluent (subscription cohorts, NetSuite, lifecycle CX).
- The job-stayer vs job-changer gap is still about 2 points (stayers +4.4%, changers +6.4% per ADP Pay Insights). If you don't move your top 20% up 5%, the market will move them out at 6% or more.
- A flat org-wide 3.5% merit pool is malpractice in 2026. The BLS data says you need 5-8% for marketing/ecom leadership, 4-5% for fulfillment, 3.5% for finance and CX. Function-tier the pool or watch attrition do it for you.
Most DTC operators read one headline (wage growth is cooling to about 3.4%) and budget a flat merit pool across the whole company. The BLS data says that is wrong. Wage inflation has fanned out by function in 2026. Information-sector wages (the closest Bureau of Labor Statistics proxy for in-house marketing, growth, and ecom tech roles) are running +5.3% year-over-year. Warehousing is +4.1%. Financial activities is +3.8%. Retail trade is +3.3%. Total private is +3.4%. If you budget the headline, you underpay the roles where wages are still climbing and overpay the ones the market has already calmed down on.
This post is the function-by-function payroll picture for a $5M to $50M DTC brand: where wages are actually accelerating, where they're flat, and what merit and retention budgets the BLS data supports for the rest of 2026. We pulled the BLS Current Employment Statistics (CES) and Employment Cost Index (ECI) series direct from the BLS API on 2026-06-01, anchored the occupation numbers to the May 2025 OEWS release, and layered in ADP Pay Insights for the job-stayer vs job-changer gap.
The headline is wrong: wage inflation has fanned out by function in 2026
Every WorldatWork survey, every Payscale forecast, every CNBC labor segment quotes the same number right now: the Employment Cost Index for private wages and salaries grew +3.3% YoY in Q1 2026 (FRED series ECIWAG), the slowest pace since Q3 2021. Most 2026 salary-budget surveys land at 3.5%, very close to that ECI number.
That is true at the org-wide level. It is misleading at the function level. The chart below tracks five DTC-relevant industry slices on the same axis from January 2024 through March 2026. Information has run +5% or more for most of the last 18 months. Warehousing has accelerated steadily from +2.6% in May 2025 to +4.1% by March 2026. Retail trade has decelerated from +4%+ in early 2025 to +3.6% by March 2026. The fan-out is not subtle.
The takeaway for an operator setting a 2026 budget: a flat 3.5% merit pool is not neutral. It underpays your marketing and growth roles by close to 2 points and overpays your retail and CX hourly by close to half a point. Function-tier the pool, or your best growth marketer leaves at 6.4% (the ADP job-changer rate) and your CX agent stays for 3.5% because their outside option is the same flat market. That marketing-leadership premium only pays off if the team it leads can actually move acquisition efficiency, so pair this payroll read with a hard look at your blended versus paid CAC gap by vertical before you green-light the bigger growth budget.
Marketing and ecom-channel roles: where the wage pressure actually lives
The Information sector (NAICS supersector 50, BLS series CES5000000003) is the closest industry-level proxy for in-house marketing, growth, ecom tech, and analytics roles. It includes publishing, broadcasting, telecoms, and tech, so it is not a clean DTC slice, but it tracks the broader white-collar growth labor market that competes for your marketing hires.
Information hit $54.60/hr in March 2026, up +5.34% year-over-year. That is roughly 1.9 percentage points hotter than the +3.43% total-private benchmark in the same month and roughly 2 percentage points hotter than the headline ECI. The trend has been remarkably consistent: 10 of the last 17 monthly observations show Information at +5% YoY or higher.
Layer in the BLS Occupational Employment and Wage Statistics (OEWS) for occupation-level numbers. May 2025 OEWS puts Marketing Managers (SOC 11-2021) at a national median of $150,623 and a mean of $183,254. Specialist DTC recruiters publish 2026 ranges for Director of eCommerce at $130-185K and VP of eCommerce at $175-260K total comp. Both anchors say the same thing: marketing and ecom-channel leadership pay has not cooled.
What to do this week if you're a $10-50M DTC brand:
- Budget 5-7% merit for marketing managers, growth leads, and ecom directors.
- Add a 2-3 point retention bump for your top 20%, putting the best performers at 8-10%.
- Budget a 10-15% premium for the next external hire vs your current internal pay band. The lateral hire who said yes at $145K twelve months ago wants $160-170K today.
Fulfillment and ops: rising wages on shrinking headcount equals your 3PL margin gone
The warehousing and storage industry (NAICS 493, BLS series CES4348400003) is the proxy for the labor side of fulfillment. Warehousing employment was down 1.4% YoY per BLS CES (see our DTC layoff and hiring tracker for the rolling headcount picture). At the same time, warehousing wages reached $33.25/hr in March 2026, up +4.13% YoY.
That combination, falling headcount plus rising wages, is exactly what you'd expect after the peak-shipping over-hiring of 2021-2022 unwound. 3PLs staffed up for a demand level that didn't materialize and have been right-sizing since. The right-sizing is now done. What's left is a labor market where the workers are scarcer and more expensive per hour.
For private DTC operators, the read is simple: your 3PL is under margin pressure. They lost the headcount cushion they built during peak shipping. They're still paying 4%+ more per warehouse worker than they were a year ago. Their volume from existing brands is flat at best. The math says rates have to come up.
Expect 6-12% rate increases on your 2026 3PL renewal, or capacity pressure (worse on-time, longer lead times) if you push back without giving the 3PL margin somewhere. Bring volume forecasts and peer-rate intel to the renewal conversation and aim for a 3-5% increase with multi-year price-lock clauses rather than the 8-10% open-ended ask they'll start with. Where that fulfillment cost lands hardest depends on your channel mix, which is why it is worth knowing how contribution margin differs between Amazon and Shopify before you decide how much of this increase you can actually absorb.
Finance and CX: closer to baseline, but don't get cute
Financial activities (NAICS supersector 55, CES5500000003) and Retail trade (NAICS 44-45, CES4200000003) are the closest BLS industry proxies for finance/FP&A roles and customer-service/store hourly roles, respectively. April 2026: Financial activities at $48.99/hr, +3.81% YoY; Retail trade at $26.11/hr, +3.28% YoY. Both sit essentially at the total-private benchmark.
On the occupation side, BLS OEWS Financial and Investment Analysts (SOC 13-2051) median sits around $116-117K nationally (estimated; the latest fully published OEWS detail tables are May 2023, extrapolated forward by industry-level CES wage growth). Customer Service Representatives (SOC 43-4051) sit in the $40-60K range depending on metro. Neither has fanned out from the headline.
The operator call: hold finance and CX merit budgets at 3.5-4% baseline. Reserve the premium for individuals tied directly to revenue. A lifecycle manager owning a retention KPI, an FP&A lead who can run cohort and LTV scenarios, a controller who has actually closed a NetSuite implementation - those people are worth the marketing-tier premium. Generic finance and CX is not. The transactional bookkeeping layer underneath that team is the part you should be pushing to software or a specialist provider rather than a full-time hire, which is the whole reason to compare ecommerce bookkeeping services like Bench, Pilot, and Finaloop before you backfill a clerk.
The chart below shows the wage-level ranking across all seven DTC-relevant functions. Information at $54.60/hr is more than 2x Retail trade at $26.11/hr. Warehousing ($33.25) and Nonstore retailers ($33.58) are nearly tied in the middle. That ratio is your relative-cost-per-hour map.
What CES + ECI + OEWS together tell you to budget for 2026
The three BLS series each answer a different question. CES tells you what an hour of labor costs right now and how that has moved YoY (industry-level). ECI tells you whether the same set of jobs is getting raises (composition-controlled, lagged). OEWS tells you what a specific occupation pays at the median and mean (annual, lagged one year). For a 2026 budget, you use all three: CES for direction, ECI for the "are raises actually happening" check, OEWS for the absolute pay anchor on a specific role.
The table below is the planning heuristic we use for $5-50M DTC brands. Baseline merit follows ECI plus a function delta from CES. Top-20% retention bump assumes the job-changer market pays 2 points more than the job-stayer market (per ADP Pay Insights). External-hire premium captures the gap between your internal pay band and the next lateral hire. How aggressively you can fund these premiums tracks closely with your starting margin and capital posture, and the spread we see between bootstrapped and VC-backed DTC gross margin is usually why two brands of the same size end up with very different merit pools.
| Function | Baseline 2026 merit | Top-20% retention | External-hire premium |
|---|---|---|---|
| Marketing / growth | 5.0% | 7-8% | 10-15% |
| Ecom channel leadership | 5.0% | 6-8% | 10%+ |
| Finance / FP&A | 3.5% | 5% | 5-8% |
| Customer service / CX | 3.5% | 5% | 5% |
| Ops / fulfillment (internal) | 4.0% | 5-6% | 5-8% |
| Org-wide baseline (benchmark) | 3.4-3.5% | n/a | n/a |
The CES wage levels for context. Below is the latest six-month trajectory by function so you can see the trend, not just the month-end number.
| Period | Information (marketing) | Warehousing (ops) | Financial (finance) | Retail (CX/store) | Total private |
|---|---|---|---|---|---|
| 2026-Mar | +5.34% | +4.13% | +3.80% | +3.57% | +3.43% |
| 2026-Feb | +5.10% | +3.92% | +4.06% | +4.27% | +3.70% |
| 2026-Jan | +4.64% | +4.41% | +4.25% | +4.45% | +3.66% |
| 2025-Dec | +5.11% | +4.70% | +4.09% | +4.62% | +3.73% |
| 2025-Nov | +4.23% | +4.37% | +4.78% | +4.01% | +3.93% |
| 2025-Oct | +4.06% | +4.59% | +4.58% | +4.05% | +3.92% |
If your single org-wide merit pool is 3.5% you're underpaying marketing by 2 points and overpaying retail by half a point. That's how you lose your best growth hire to a competitor and over-invest in a CX agent who would have stayed for less. Function-tier the budget or watch attrition do it for you.
What we're watching next
The next BLS CES release covering May 2026 data drops in early June. ECI Q2 2026 lands in late July. We'll be watching for whether Information stays above +5% (it has for most of the last 18 months) and whether warehousing wages keep accelerating while employment keeps shrinking. The May 2026 OEWS occupational release won't drop until April 2027, so the OEWS Marketing Manager median of $150,623 (May 2025 release) is the latest grounded number through this calendar year.
This is a Group A living index. We refresh it quarterly when fresh ECI and a new month of CES are both on the table. Next scheduled refresh: late July 2026 after ECI Q2 lands.
For more on how labor and operating-expense decisions interact in DTC unit economics right now, see our DTC layoff and hiring tracker, our interim CFO services overview, and the DTC 3PL cost index for 2026. On the revenue side of the same P&L, the gap between mobile and desktop AOV is the kind of structural detail that decides whether your payroll plan is affordable in the first place.
Sources and methodology
Bureau of Labor Statistics, CES (Current Employment Statistics). Average hourly earnings of all employees, seasonally adjusted, monthly. Pulled 2026-06-01 via the BLS public API. Series: CES0500000003 (total private), CES4200000003 (retail trade), CES5500000003 (financial activities), CES5000000003 (information), CES6000000003 (professional and business services), CES4244100003 (nonstore retailers), CES4348400003 (warehousing and storage). Window January 2024 through April 2026. Warehousing latest observation is March 2026 in this pull; the other industry series go through April 2026.
Bureau of Labor Statistics, Employment Cost Index (ECI). Private wages and salaries, seasonally adjusted, quarterly, indexed December 2005 = 100. Accessed via FRED series ECIWAG with the year-over-year transformation pc1. Latest observation 2026-01-01 represents Q1 2026 and prints at +3.32% YoY. The Q1 2026 release was dated 2026-04-30.
Bureau of Labor Statistics, OEWS (May 2025 release). Occupational Employment and Wage Statistics. Marketing Managers (SOC 11-2021) national median $150,623 and mean $183,254. Financial and Investment Analysts (SOC 13-2051) median estimated at $116-117K. Laborers and Material Movers (SOC 53-7065) median estimated at $38-39K. The Marketing Manager figure is the published May 2025 OEWS value; the Financial Analyst and Material Mover figures are estimates anchored to BLS May 2023 detailed tables (the latest fully published HTML page) extrapolated forward by industry-level CES wage growth.
ADP Pay Insights. Job-stayer pay growth +4.4-4.5% annualized through early 2026. Job-changer pay growth +6.4% annualized through early 2026. Source: ADP Research Institute, Main Street Macro.
WorldatWork and Payscale 2026 Salary Budget Surveys. US employers planning average 3.5% salary increases for 2026, in line with the ECI.
Limitations. The NAICS Information sector is not a clean marketing proxy. It bundles publishing, telecoms, broadcasting, and software. We use it as the closest available BLS industry-level proxy for in-house marketing and ecom tech, not as a direct quote. NAICS Financial activities bundles finance, insurance, and real estate. NAICS Nonstore retailers (CES4244100003) is the closest BLS industry to DTC ecom but includes catalog and vending. Industry CES is a directional wage-pressure signal, not an occupation pay quote. OEWS is the right source for occupation pay quotes and it publishes annually, so May 2025 is the most recent reference period available. ECI is the right source for composition-adjusted "are people getting raises" answers; CES is the right source for "what does an hour of labor cost right now" answers.
Update cadence. This is a living index, refreshed quarterly after each ECI release. Next scheduled refresh: late July 2026 after the BLS Q2 2026 ECI release.
Frequently asked questions
is wage inflation cooling or not in 2026 for a dtc brand?
Both, depending on the function. The headline Employment Cost Index is +3.3% YoY in Q1 2026, the slowest since Q3 2021. But Information-sector wages (the BLS proxy for marketing and ecom tech) are still +5.3% and warehousing is +4.1%. The org-wide cooling story is real. The function-level reality is that marketing and fulfillment pay are still running 50-80% hotter than the headline.
what should i budget for a 2026 merit pool for my ecom team?
Tier it by function, do not flat-line it. Roughly: 5% for marketing and ecom-channel leadership, 4-5% for fulfillment, 3.5% for finance, FP&A, and CX. Add a top-20% retention bump of 2-3 points on top for your best people. A single org-wide 3.5% number will underpay marketing by 2 points and overpay retail by half a point.
are marketing manager salaries actually still going up or is that hiring market finally calming down?
Going up. BLS OEWS May 2025 puts Marketing Managers (SOC 11-2021) at a national median of $150,623 with a mean of $183,254, and Information-sector wages have run +5% or more YoY for 10 of the last 17 months. The 'cooling' headline is the Employment Cost Index, which is a broader, lagged measure. Marketing comp is not what's cooling.
why is my 3pl raising rates if warehouse hiring is supposedly slowing?
Because hiring is slowing but wages are not. Warehousing employment is down 1.4% YoY and warehousing wages are up 4.1%. Your 3PL is paying more per worker on flat or shrinking volume. Margin is gone, and they will recover it in your renewal. Expect 6-12% rate increases or capacity pressure at renewal time.
how much do i need to pay to keep my best growth marketer from leaving in 2026?
ADP Pay Insights shows job-changers earning 6.4% YoY pay growth vs job-stayers at 4.4-4.5%. The retention gap is about 2 points. If your top growth marketer is on $140K, a flat 3.5% raise puts them at $144,900, while a job-change offer in the market is likely $148-150K plus equity. Budget 5-7% for retention and 10-15% premium for the lateral hire.
should i hire a finance person remote in the philippines or in-house in north america?
Depends on the role. A bookkeeper or AP/AR clerk is great offshore (BLS Retail trade at $26/hr is the rough proxy for the role in NA, vs a fraction of that on a recruiter-reported Manila rate). A controller or FP&A lead who needs to sit in your weekly cash call, model scenarios, and push back on the founder is hard to do well remote. Financial activities sits at $48.99/hr in NA. The gap is real but the loss of context is often what kills the hire.
what's the difference between bls ces wage growth and the employment cost index?
CES (Current Employment Statistics) measures average hourly earnings monthly by industry, which moves with composition (more high-wage hires lift the average even without raises). ECI (Employment Cost Index) measures compensation cost for the same set of jobs quarterly, controlling for composition. ECI is the cleaner 'are people getting raises' number. CES is the cleaner 'what does an hour of labor cost right now' number. Both belong in a 2026 budget.
what's a defensible 2026 salary range for a director of ecommerce at a $20m dtc brand?
Specialist ecommerce-recruiter guides put Director of eCommerce at $130-185K total compensation for 2026, with VPs at $175-260K. BLS OEWS Marketing Managers median of $150,623 anchors the same range from the government side. For a $20M brand specifically, expect base of $135-160K plus 10-20% bonus, with the top end reserved for someone bringing measurable LTV or new-channel work in their last role.