
Financial Strategy
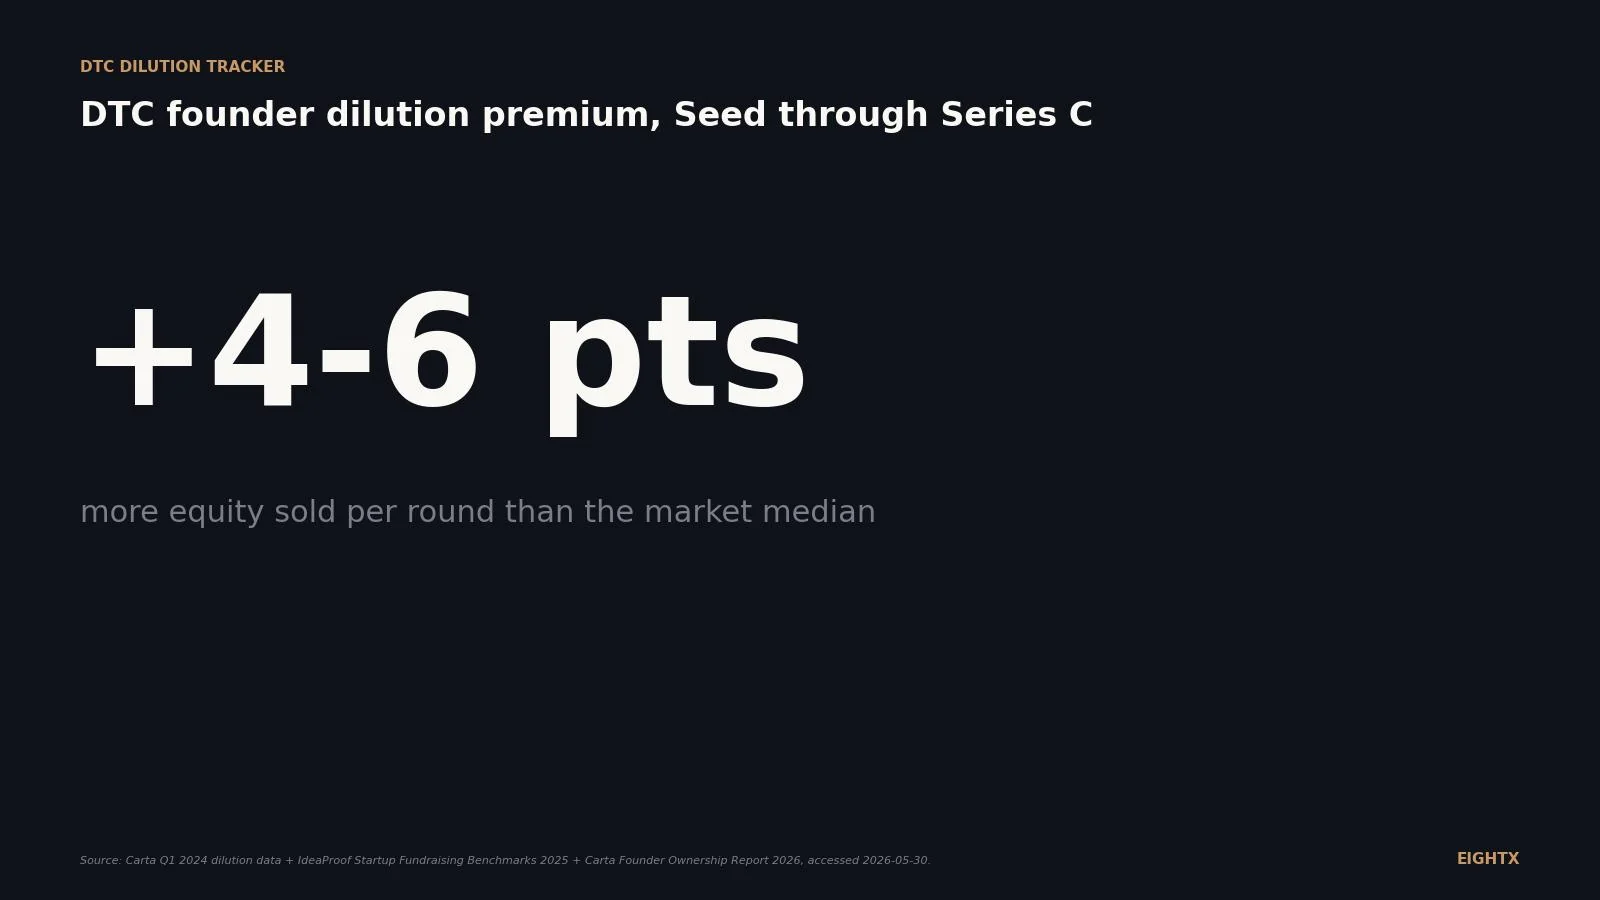
Average ecommerce dilution by round 2026: DTC founders sell 4-6 points more per round than the market median
DTC founders give up 4 to 6 percentage points more equity per round than the broad venture market: Carta pegs Seed at 20% and Series A at 20.5%, while IdeaProof puts DTC Seed at 24% and Series A at 26%. The gap is not random. Inventory cycles, lower gross margins, and smaller addressable markets compress DTC valuations before you ever sit across from a term sheet.
Key Takeaways
- Carta's market median per-round dilution as of Q1 2024: Seed 20.1%, Series A 20.5%, Series B 16.7%, Series C 14.6%, Series D 10.0%. In 2025 those medians dropped roughly 2 points at every stage.
- DTC and ecommerce founders sell more equity per round than the market median. IdeaProof 2025 puts DTC Seed at 24.2% ($3.2M at $10M pre-money) and DTC Series A at 26.2% ($11M at $31M pre-money). The premium is 4 to 6 points at Seed and Series A.
- By Series C, founders cross BELOW the employee option pool for the first time. Carta's Founder Ownership Report 2026 puts post-Series A founders at roughly 36% market-wide and 30.5% for physical/consumer (DTC, CPG) brands.
- In a 2025-2026 down or flat round, founders can lose 30-50% of pre-round ownership even when the headline equity sold looks like a normal 20-25%. The damage comes from option-pool refresh, anti-dilution adjustments, and 1.5-2x liquidation preferences stacking on top.
- Only one of the four dilution levers is the headline %. Headline equity sold, option-pool refresh, anti-dilution mechanic, and preference stack each move founder ownership independently. Founders who only optimize on headline % underestimate real dilution by 3 to 10 points per round.
Most founders raise their first round having read one number: "give up 20% per round." That rule is built on Carta's market-wide medians and it is not wrong, it is just incomplete. As of May 2026, the consumer and DTC reality is that founders consistently sell more equity per round than the headline number suggests, and the gap matters because it compounds. Here's what we mean by that, why it matters for your business in 2026, and what to watch for at each stage of your cap table.
This post tracks per-round dilution medians for DTC, ecommerce, and physical-consumer brands against the broader venture market. We refresh it quarterly as Carta, PitchBook-NVCA, and IdeaProof publish updated stage benchmarks.
The 20% rule is wrong for DTC: the 4-6 point premium nobody benchmarks
Carta's most widely-cited dilution dataset (Q1 2024 anchor) shows market-median per-round dilution at Seed 20.1%, Series A 20.5%, Series B 16.7%, Series C 14.6%, and Series D 10.0%. Carta's 2025-in-review data shows those medians dropped another 2 points or so over 2024: Seed roughly 19%, Series A 17.9%, Series B around 13%.
IdeaProof's 2025 Startup Fundraising Benchmarks, which break out by vertical, tell a different story for DTC. The median DTC Seed round was $3.2M raised at a $10M pre-money valuation, which is 24.2% dilution. The median DTC Series A was $11M at $31M pre-money, or 26.2% dilution. That is 4 points above the broader market at Seed and almost 6 points above at Series A.
Why? Three structural forces. First, DTC revenue multiples sit at 1 to 3 times revenue versus 5 to 10 times for SaaS (per IdeaProof's 2025 vertical benchmarks and PitchBook-NVCA sector valuations), so the same investor check buys 15 to 20% more equity on a pre-money basis. Second, consumer businesses are working-capital-heavy: you need to fund inventory, paid acquisition, and returns, which forces larger raises than a software company hitting the same ARR. Third, consumer venture investment dropped roughly 97% from the 2021 peak to the 2023 trough (per PitchBook-NVCA Q1 2026 Venture Monitor consumer sector data) and the median consumer Seed check dropped below $1M in Q1 2025, putting investors in the negotiating seat on valuation and terms.
The table below has the full per-round detail, including the 2024 vs 2025 market shift and the typical valuation multiples that drive the gap.
Round Market median dilution DTC median dilution DTC premium Revenue multiple Capital-intensity note Pre-Seed (SAFE) ~12% ~15% +3 pp Pre-revenue Mostly SAFEs; effective dilution at conversion Seed 20.1% (Q1 2024); ~19% (2025) ~24% ($3.2M at $10M pre) +4 to 5 pp 1-3x DTC vs 5-10x SaaS Median consumer Seed under $1M in Q1 2025 Series A 20.5% (Q1 2024); 17.9% (2025) ~26% ($11M at $31M pre) +6 to 8 pp 1-3x DTC vs 5-10x SaaS Inventory plus paid-acq raises capital need Series B 16.7% (Q1 2024); ~13% (2025) ~20 to 22% +4 to 7 pp 2-4x DTC revenue Profitability and repeat-rate scrutiny intensifies Series C 14.6% (Q1 2024); ~12% (2025) ~15 to 18% +1 to 3 pp 3-5x DTC revenue Stronger brands converge toward market Series D ~10% (Q1 2024); ~8% (2025) ~10 to 12% +1 to 2 pp Wide range Capital-efficient survivors dominate
The cumulative ownership curve: where you actually end up by Series D
Per-round numbers compound. Carta's Founder Ownership Report 2026 (published 2026-03-12) is the cleanest "where am I on the curve" benchmark publicly available. It aggregates 2021 through 2025 activity across roughly 45,000 companies on the platform.
For the broader market, founders sit at roughly 56% combined ownership post-Seed, 36% post-Series A, 23% post-Series B, and 15% post-Series C. Series C is the first stage where founders, on average, own less of the company than the employee option pool. Carta directly publishes a physical/consumer vs digital/SaaS split at post-Series A only (30.5% vs 37.5%); for Series B, C, and D we extrapolate the gap forward by compounding the per-round dilution premium. On that basis, DTC and physical-consumer founders sit about 5 to 7 points lower at every stage: roughly 50% post-Seed, 30.5% post-Series A, 18% post-Series B, 11% post-Series C (B and C extrapolated). By Series D the market-median founder owns about 12% of the company; the extrapolated DTC line lands near 8%.
The table version below shows the per-stage breakdown including the typical option-pool size at each round (which is doing most of the silent damage between Series A and Series C).
Stage Market median founder ownership DTC/physical-consumer founder ownership Gap (pp) Typical option pool Incorporation 100% 100% 0 0-5% Post-Pre-seed (SAFE) 85-90% 82-87% -3 5-10% Post-Seed ~56% ~50% -6 10% Post-Series A ~36% ~30.5% -5.5 15-18% (after refresh) Post-Series B ~23% ~18% -5 15-18% Post-Series C ~15% ~11% -4 16-18% (founders cross BELOW) Post-Series D ~12% ~8% -4 15-18%
The four levers that actually drive your dilution (and only one is the headline %)
Founders who only optimize on the headline equity-sold number routinely underestimate real dilution by 3 to 10 points per round. There are four levers in any priced round, and the headline % is just one of them.
Headline equity sold. The percentage of post-money the new investor owns. This is the number that gets debated for hours on a term sheet and the one that founders track.
Option pool refresh. The new investor almost always requires the option pool to be topped up to a target size (typically 10% at Seed, 15-18% after Series A refresh). The catch: the top-up is usually taken pre-money, which means the new shares created to fill the pool dilute founders and existing investors, not the new investor. Negotiating the refresh post-money (rare but possible) can save 3 to 5 percentage points of founder ownership in a single round.
Anti-dilution mechanic. If the next round prices below your current preferred share price, existing preferred holders are protected by anti-dilution adjustments. Broad-based weighted-average is the founder-friendly version. Full-ratchet (rare but devastating) effectively reprices the entire prior round to the new lower price. Down rounds with full-ratchet anti-dilution can compress founder ownership by an additional 5 to 15 points overnight.
Preference stack. Liquidation preferences (1x, 1.5x, 2x), participation rights (non-participating vs participating), and seniority (pari passu vs senior) determine what comes off the top in an exit. A 2x participating preference effectively means the first dollars at exit pay preferred holders twice their investment plus a share of the remainder, before founders see anything. That doesn't affect your cap-table percentage but it can wipe out the dollar value of your equity in a soft exit.
The four levers compound. A "normal" 20% headline Series A with a 5-point pool refresh, a 2x non-participating preference, and senior seniority looks like a 20% deal on paper and behaves like a 30 to 35% deal in any exit short of a clean up-round. Read every clause, not just the cover term.
This is the operator-level conversation we have with founders on cap-table calls. The shares aren't the only thing that gets allocated. There are rights that come with those shares (dilution protection, board seats, information rights, drag-along) that materially change the founder's outcome. Build the cap table to model all four levers, not just the headline number.
What changes in a 2025-2026 down or flat round
The macro setup matters because it determines which lever is most likely to fire on your next round. As of May 2026, three signals point to elevated down-round and flat-round risk for DTC brands.
The US is 31 months without a DTC IPO, the longest drought of the modern DTC era. Without exit liquidity, late-stage DTC valuations have to come down or capital stays parked. PitchBook-NVCA's Q1 2026 Venture Monitor flags elevated down-round rates particularly in later stages, with gradual recovery into 2026. Consumer venture investment dropped roughly 97% from the 2021 peak to the 2023 trough, and the recovery has been slow and selective. Less exit liquidity also means less competition for deals, which puts investors in the negotiating seat on dilution and terms.
When a flat or down round prints, the dilution math gets ugly fast. A typical mild down round (20 to 40% valuation cut from the prior round) layers three extra forces on founders: anti-dilution share issuance to prior preferred (broad-based weighted-average is the friendly outcome), an 8 to 12% pool top-up taken pre-money, and a step-up in liquidation preferences to 1.5 or 2x. Net effect: founders who collectively owned 40% of the company pre-round can emerge with 24 to 28% post-round (at the mid-band of the 30 to 40% effective dilution range in the table below), while the headline equity sold to the new investor still looks like a "normal" 20 to 25%.
Scenario Headline equity sold Pool refresh Anti-dilution impact Preference stack typical Effective dilution to founders Up round (normal) 18-22% 5-10% pre-money None triggered 1x non-participating 20-28% of pre-round ownership Flat round 18-22% 7-10% pre-money Usually none 1.5-2x non-participating + senior 25-35% of pre-round ownership Down round (mild, 20-40% cut) 20-25% 8-12% pre-money Broad-based weighted avg shares to prior preferred 1.5-2x non-participating 30-40% of pre-round ownership Down round (steep, 50-80% cut) 20-25% 10-15% pre-money Full ratchet possible 2x participating + senior 40-50% of pre-round ownership
What to negotiate at each round for your business
Per-stage practical levers, written in the order they show up.
Pre-seed. Cap your SAFEs tightly. Uncapped SAFEs at favorable Seed valuations can save 5 to 10 points of founder ownership at conversion. Avoid stacking too many SAFEs at different caps because the conversion math compresses founder ownership 10 to 15 points below the "clean Seed" expectation.
Seed. Push for 18% headline, accept 20%, walk at 25% unless you have a strategic reason to take the higher number. Insist on broad-based weighted-average anti-dilution. Size the pool to actual hiring needs through the next 18 months (often 7 to 10%) rather than the lazy 10% default.
Series A. Negotiate the pool top-up post-money if you can (this alone saves 3 to 5 points). Ask for founder re-up grants if you're tracking to plan. Read the preference stack carefully: 1x non-participating is the founder-friendly outcome; 2x participating in this market is a red flag about how the investor is pricing the deal.
Series B and C. This is where preference stacks get sneaky because lead investors are protecting against downside in a softer DTC exit environment. Read every clause on participation, seniority (pari passu vs senior), and pay-to-play. The headline dilution at these stages converges with the market, but the term complexity goes up.
Series D and beyond. Secondary sales become the realistic founder liquidity tool. Headline equity preservation matters less than getting some money off the table at a fair valuation. If you're at Series D and still 100% paper rich, you're carrying personal-financial risk that the next round won't fix.
If you want a CFO read on your specific cap table and term sheet before you sign, our interim CFO services overview walks through how we model these scenarios. Sister benchmarks to read alongside this one: our DTC funding drought index for 2026 and the average ecommerce funding round size by stage 2026 breakdown.
Sources and methodology
Carta: Dilution is on the decline (Q1 2024 data). The cleanest publicly-available stage-by-stage median table. Per-round medians: Seed 20.1%, Series A 20.5%, Series B 16.7%, Series C 14.6%, Series D 10.0%. Methodology: Carta's platform data across roughly 45,000 companies and 2.4 million security holders. Defines primary rounds as the first equity round in a series (not bridges). Limitation: not broken out by vertical. Accessed 2026-05-30 at carta.com/data/dilution-q1-2024/.
Carta Founder Ownership Report 2026 (published 2026-03-12). Aggregates 2021 through 2025 activity. Provides cumulative ownership by stage with a physical/consumer vs digital/SaaS split (physical post-A roughly 30.5%, digital roughly 37.5%). This is the most important primary source for the DTC versus SaaS gap. Accessed 2026-05-30 at carta.com/data/founder-ownership-2026/.
Carta State of Private Markets: 2025 in Review (Q4 2025). Notes that median dilution Seed-through-C dropped from approximately 18% to 16% over 2024 and continued declining into 2025. Used for the year-over-year shift in the market column. Accessed 2026-05-30 at carta.com/data/state-of-private-markets-q4-2025/.
IdeaProof: Startup Fundraising Benchmarks 2025 by Vertical and Stage. The only public benchmark with explicit DTC and ecommerce per-stage round size and valuation data. DTC Seed: $3.2M at $10M pre (24.2% dilution). DTC Series A: $11M at $31M pre (26.2% dilution). Primary source for the DTC dilution premium thesis at Seed and Series A. Series B through D dilution for the DTC line are extrapolations using Qubit Capital ecommerce benchmarks and PitchBook-NVCA sector valuations rather than direct vertical-segmented data. Accessed 2026-05-30 at ideaproof.io/fundraising-benchmarks.
Q1 2026 PitchBook-NVCA Venture Monitor. Flags elevated down-round rates particularly in later stages, with gradual recovery into 2026. Provides the macro context for the down-round mechanics in section four. Accessed 2026-05-30 at nvca.org/wp-content/uploads/2026/04/Q1-2026-PitchBook-NVCA-Venture-Monitor.pdf.
CRV Startup Equity Structure 2026, Causo Hub Dilution at Seed 2026, Rebel Fund Founder Dilution Benchmarks Seed 2025. Synthesized for the four-lever framework in section three and the per-stage negotiation guidance in section five. These provide operator-level guidance on pool sizing, anti-dilution mechanics, and preference-stack norms.
Limitations to flag. Carta does not publish a public table of per-round dilution by vertical (DTC vs SaaS vs AI). The "DTC premium" thesis relies on IdeaProof's direct Seed and Series A tables, the Carta Founder Ownership Report 2026 physical/consumer split, and sector-valuation gaps from PitchBook-NVCA. Series B, C, and D DTC dilution figures are extrapolated, not directly sourced. Effective dilution including pool refresh, anti-dilution, and preference stack requires deal-specific modeling; the 30 to 50% pre-round dilution range for down and flat rounds is a planning band, not a forecast.
Update cadence. This tracker is refreshed quarterly when Carta and PitchBook-NVCA publish updated stage benchmarks. Next update target: August 2026 (Q2 Venture Monitor and Carta Q2 State of Private Markets).
Frequently asked questions
what is the average founder dilution per round for a dtc brand in 2026?
Plan for 22 to 26% at Seed, 22 to 26% at Series A, 18 to 22% at Series B, and 15 to 18% at Series C. That sits 4 to 6 points above the broader market median because DTC pre-money valuations trail SaaS by 15 to 20% on lower revenue multiples (1 to 3 times revenue for DTC vs 5 to 10 times for SaaS), so the same investor check buys more of your company.
how much equity does a typical seed round sell in a dtc company?
IdeaProof's 2025 DTC Seed median is $3.2M raised at a $10M pre-money valuation, which is 24.2% dilution. That compares to Carta's broader Seed median of about 20%. If your Seed terms land above 28%, your pre-money is being marked down or the round is oversized for your stage.
why do dtc founders give up more equity per round than saas founders?
Three structural reasons. Lower revenue multiples (1 to 3 times for DTC vs 5 to 10 times for SaaS) compress your pre-money. Higher capital intensity (inventory, paid acquisition, returns) forces larger raises. And the DTC funding drought (31 months without a US DTC IPO as of May 2026) puts investors in the negotiating seat on terms.
what's the cumulative founder ownership after seed, series a, b, and c?
Market median: roughly 56% post-Seed, 36% post-Series A, 23% post-Series B, 15% post-Series C, per Carta's Founder Ownership Report 2026. Carta's physical/consumer split is published at post-Series A only (30.5% vs 37.5% digital/SaaS); extrapolating the per-round dilution premium forward puts DTC and physical-consumer founders 5 to 7 points lower at every stage: roughly 50% post-Seed, 30.5% post-Series A, 18% post-Series B, 11% post-Series C.
at what round do founders typically end up with less than the option pool?
Series C. That's the first stage where Carta's data shows founders, on average, owning less of the company than the employee option pool. For DTC brands the crossover often happens earlier, between Series B and Series C, because per-round dilution runs higher.
how does an option pool refresh dilute me as a founder?
When a new investor requires a pool top-up taken pre-money (the standard), the dilution from creating those new option shares hits founders and existing investors, not the new investor. A 10% Seed pool plus a 5-point Series A refresh can quietly cost founders 5 to 8 points of ownership that never appears on the term-sheet headline.
how bad is dilution in a down round vs a flat round for founders?
In an up round you typically lose 20 to 28% of pre-round ownership across new shares plus refresh. In a flat round, 25 to 35%. In a mild down round (20 to 40% valuation cut), 30 to 40% once anti-dilution adjustments kick in. In a steep down round with full-ratchet anti-dilution and 2x participating preferences, 40 to 50%.
what's the difference between headline dilution and effective dilution for founders?
Headline dilution is the new investor's ownership of the post-money cap table, usually 18 to 25% at Seed and Series A. Effective dilution to founders adds the option-pool refresh (pre-money, so it hits you), any anti-dilution share issuance from prior preferred, and the seniority and participation rights on the preference stack. Effective is typically 3 to 10 points worse than headline per round.