
Insights
Average ecommerce gross margin by revenue band 2026: 18 public DTC brands from $44M to $12.6B
Gross margin scales with revenue, but not linearly. Brands doing $1M to $10M average 42%, while those above $1B average 54%. The gap narrows sharply between $50M and $200M as brands layer in wholesale, promotional pressure, and retail mix. Knowing where you sit against your band is more useful than chasing a universal 50% target.
Key Takeaways
- Scale does not monotonically improve gross profit margin. The four-band averages are within a 5-point band (43.7% sub-$500M, 45.4% $500M-$1B, 48.2% $1B-$3B, 47.8% $3B+). The largest band is bimodal: Tapestry 75.4% vs Wayfair 30.2%, Chewy 29.8%. The sub-$500M band straddles Vera Bradley 46.4% and Allbirds 41%. Category, channel, and pricing power drive the spread, not size.
- Variance inside a band exceeds variance between bands. Inside $1B-$3B alone, GM ranges from Torrid 34.8% (off-price apparel) to Etsy 71.6% (marketplace take rate). That 36.8-point spread is wider than the gap between the sub-$500M and $3B+ band averages.
- Apparel specialty 50% to 67% is the sweet spot. FIGS 66.5%, YETI 57.4%, Lululemon 56.6%, Warby Parker 54.0%, Revolve 53.5%, Peloton 50.9%. Size does not buy you in or out of this corridor. If you are sub-50% in apparel, hitting $500M will not fix it.
- The 2026 COGS squeeze is real. BLS apparel PPI is up 7.5% year-over-year through April 2026 (307.85 vs 286.29 in April 2025); ocean freight PPI spiked +73.8% YoY in the same month. Import-heavy brands are looking at 1.5 to 3 points of GM compression on second-half 2026 reporting unless price was raised or sourcing shifted.
- Private DTC Shopify GM runs 10 to 25 points above public 10-K equivalents at every revenue tier. Eightx and Hycos 2026 panels: 67% (<$5M), 68% ($5M-$10M), 70% ($10M-$50M), 79% ($50M+). The public set is dragged by wholesale/retail blend and by Wayfair plus Chewy at 30%. Benchmark against the right denominator.
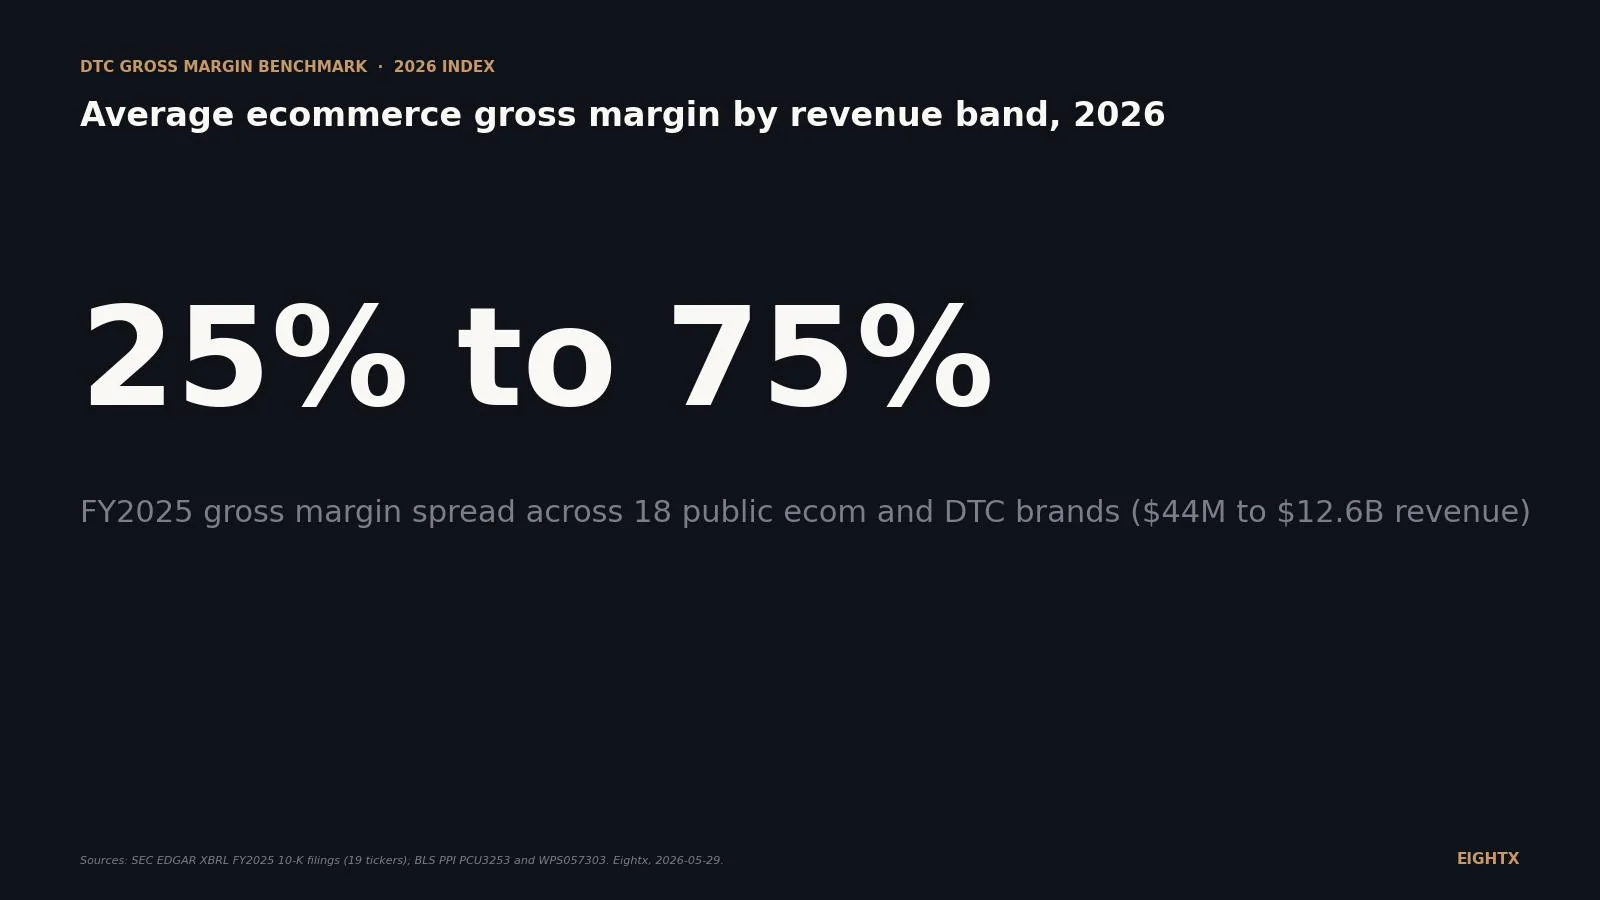
If you have ever pulled an "average ecommerce gross margin" benchmark off a survey and felt the number was misleading, this is why. There is no single average. The FY2025 10-K disclosures across 18 public ecommerce and direct-to-consumer (DTC) brands range from 25% at Sweetgreen (food-service hybrid) to 75.4% at Tapestry (luxury wholesale: Coach, Kate Spade, Stuart Weitzman). Wayfair and Chewy both print sub-30% at $12B+ revenue. FIGS prints 66.5% at $631M. Tapestry prints 75.4% at $7B. The numbers do not stack with revenue, and the band you are in matters less than the category, channel, and pricing power you operate inside.
This post takes the 10-K data plus the BLS apparel and freight indexes plus the private Shopify panels (Eightx, Hycos, Yotpo 2026) and builds the planning view operators actually want: typical GM ranges by revenue band, what the 2026 cost squeeze looks like, and how to read your own GM against the right benchmark. For the matched revenue-band cut on average order value (AOV), see average ecommerce AOV by revenue band. For the COGS denominator pull from the same dataset, see DTC cost of goods index 2026.
What 18 public ecom brands actually print at gross margin in FY2025
We pulled FY2025 gross margin from the SEC EDGAR XBRL Frames API across 19 ecommerce and DTC tickers (Rent the Runway through Chewy and Wayfair), tagged Revenues divided into GrossProfit. The 19th ticker, Rent the Runway, is excluded from chart and averages because the rental-model COGS exceeded revenue (FY2025 GM -102.1%, a structural anomaly, not a benchmark).
The ranked distribution is the chart below.
The four-band view, with the averages that anchor this post:
Revenue band Brands Average GM (%) Range (%) Sub-$500M Allbirds, Vera Bradley (RTR excluded) 43.7 41.0 to 46.4 $500M-$1B FIGS, Sweetgreen, Warby Parker, Citi Trends 45.4 25.0 to 66.5 $1B-$3B Torrid, Revolve, Stitch Fix, Dutch Bros, YETI, Peloton, Etsy 48.2 25.9 to 71.6 $3B+ Crocs, Victoria's Secret, Tapestry, Lululemon, Wayfair, Chewy 47.8 29.8 to 75.4
The headline read: band averages are within a 5-point band of each other (43.7% to 48.2%), but the within-band ranges are massive. Sub-$500M has a 5-point range. $500M-$1B has a 42-point range. $1B-$3B has a 37-point range. $3B+ has a 46-point range. Scale narrows nothing.
The brands that print north of 65% (Tapestry 75.4%, Etsy 71.6%, FIGS 66.5%) are luxury wholesale, marketplace take-rate, and single-category specialty respectively. The brands at the floor (Sweetgreen 25.0%, Dutch Bros 25.9%, Chewy 29.8%, Wayfair 30.2%) are food service hybrid, food service, subscription pet retail, and furniture dropship. The economic structure dictates the ceiling.
The gross-margin "U" between $500M and $12B isn't real, but the bimodal split is
If you sort by revenue and squint at the band averages, there is a faint U-shape: 43.7% sub-$500M, lifting to 45.4% then 48.2% in the middle bands, holding at 47.8% at $3B+. The lift inside the U is real but small. The real story is hiding underneath: the largest band is bimodal and the middle bands carry the widest spread.
Inside $1B-$3B, Etsy prints 71.6% and Torrid prints 34.8% inside the same revenue band. A 36.8-point spread. That is bigger than the gap between sub-$500M and $3B+ averages. Inside $3B+, Tapestry at 75.4% and Chewy at 29.8% share the same revenue tier. The two brands could not run more different cost structures.
The driver is category and channel mix, not size. Across the dataset, specialty apparel clusters in the 50% to 67% corridor regardless of revenue band: FIGS 66.5% ($631M), YETI 57.4% ($1.87B), Warby Parker 54.0% ($872M), Revolve 53.5% ($1.23B), Lululemon 56.6% ($11.1B), Crocs 58.3% ($4.04B). Six brands across four revenue bands and the GM corridor is 12 points wide. Marketplace and luxury wholesale (Etsy, Tapestry) sit above. Dropship marketplace (Wayfair) and subscription pet retail (Chewy) and food service (Dutch Bros, Sweetgreen) sit at the floor.
The operator read: if you sell apparel through DTC plus wholesale, your structural GM ceiling is roughly 65% in single-category specialty and 55% to 60% in multi-category. Hitting $1B does not lift the ceiling. If you are at 45% in apparel today, the gap is sourcing, pricing power, or wholesale mix, not revenue trajectory.
The 2026 cost-of-goods squeeze is real and it doesn't care about your revenue
The exogenous part of FY2026 gross margin is in the producer price indexes, and both relevant series are moving against ecommerce operators right now. BLS PCU3253 (apparel cut and sew manufacturing) is up 7.5% year-over-year through April 2026 (index 307.85 vs 286.29 in April 2025). BLS WPS057303 (deep sea freight transportation) is up 73.8% YoY in the same month, with the index rising from 281 in January 2026 to 509 in April 2026.
Stack that with the 2026 tariff regime (China-origin apparel at roughly 44.5% combined duty, Vietnam at roughly 18%, Section 321 de minimis repealed for China and Hong Kong) and import-heavy DTC brands are looking at 1.5 to 3 points of GM compression on second-half 2026 reporting unless price was raised or sourcing shifted.
The defensible playbook is the one e.l.f. Beauty ran. ELF held GM at 71% in Q3 FY2025 with only 30 bps YoY compression despite facing a peak 45% tariff rate during the year. The lever was $1 per SKU price increases pushed through before the cost hit. Management has said publicly they expect tariffs to become a 2027 tailwind once the regime normalizes. The lesson for $5M to $150M private brands: pricing power is the GM defense. If you cannot push a $1 to $3 SKU price increase without volume loss, your tariff and freight exposure is a 2026 P&L problem you should be addressing this quarter, not after the FY2026 close.
The brands that gave back GM in FY2025 versus FY2024 (Torrid -2.7 pts, Lululemon -2.6 pts, Crocs -0.5 pt) are concentrated in furniture and apparel. The brands that gained (FIGS +5.5 pts, Warby Parker +2.6 pts, Allbirds +2.0 pts, Revolve +1.0 pt) are specialty-positioned with pricing power. Peloton's +6.2 pt jump is a cleanup of inventory writedowns and not a structural read.
What this means if you're a private brand at $10M to $150M
Three operator decisions sit downstream of the data above.
Benchmark against the right peer set. If you are a Shopify-pure DTC brand, the public 10-K data is the wrong denominator. Public set is omnichannel (wholesale plus retail drag) and category-mixed (Wayfair plus Chewy at 30% pull the $3B+ average down). The 2026 private Shopify reads from Eightx, Hycos, and Yotpo (synthesized below) sit 10 to 25 points above the public equivalents at every tier. If your blended business is hybrid (Shopify plus wholesale plus Amazon), run the channel mix separately, compare Shopify GM to private panels, and compare wholesale GM to public hybrid brands like Crocs (58.3%) or YETI (57.4%).
Revenue band Private DTC Shopify avg GM (%) Public 10-K avg GM (%) Gap (pts) Why Under $5M 67 n/a (no public comps) n/a Sub-$5M brands are private; benchmark against private panels only $5M to $50M 68 to 70 43.7 (2-co sub-$500M proxy: Allbirds, Vera Bradley) ~25 Private is DTC-pure; public sub-$500M is small and excludes Rent the Runway broken-unit-economics drag $50M to $500M 75 to 79 (top end) ~45 ($500M-$1B mix: FIGS 66.5, Warby Parker 54.0, Citi Trends 36.0, Sweetgreen 25.0) ~30 Top private DTC operates in beauty and supplements (65% to 85%); public band carries food-service and off-price drag $1B to $3B no panel 48.2 (7-co average) n/a Public-only band; private benchmarks evaporate as brands exit or IPO $3B+ no panel 47.8 (6-co bimodal 30 to 75) n/a Public-only band; Tapestry and Etsy lift the average, Wayfair and Chewy depress it
Diagnose whether your low GM is category or sourcing. Run your GM against the top quartile of your category in the private Shopify panels. If you are 10 points or more below the top quartile, the issue is almost always sourcing terms, price ladder, or promo cadence, not category. If you are within 5 points of the top quartile, your category has a ceiling and the next move is mix shift (add a higher-margin product line) or channel shift (more DTC, less wholesale), not more COGS work. In the middle (5 to 10 points below), it is usually both. Re-tender your top 5 SKUs by COGS volume first, then look at price ladder.
Know when scale will and won't fix it. If you sell apparel through DTC and you are at 45% GM at $10M revenue, hitting $50M will not give you 65% GM by itself. The brands at 65% plus did not buy that margin with scale; they engineered it with category choice, single-channel focus, and pricing power. The brands at 30% (Wayfair, Chewy) chose business models where GM is structurally low and the moat is volume and logistics. Both can work; both require accepting which game you are playing. If your model demands 60% GM to support your CAC and your category caps you at 50%, you are running a strategy mismatch that scale will make more expensive, not cheaper.
Scale does not fix gross margin. The brands at 65% plus engineered the margin with category choice, single-channel focus, and pricing power. The brands at 30% chose business models where GM is structurally low and the moat is volume. Hitting $500M does not lift your apparel ceiling. The math is set the day you choose the product, channel, and price.
What we're watching next
The next BLS PPI release covering May 2026 data lands in mid-June. We will be watching whether the apparel index sustains the 7% plus YoY pace into the back-to-school sourcing window, and whether ocean freight pulls back from the April $509 spike. On the SEC side, Q2 2026 earnings season runs through August. The FY2025 10-K data above will be refreshed as fiscal-Q1 2026 results land for the brands with January and April fiscal year-ends. Next index refresh target: August 2026.
For the matched revenue-band cut on AOV from the same dataset, see average ecommerce AOV by revenue band. For the pillar on fractional CFO support for $10M to $150M ecommerce brands, see fractional CFO for ecommerce brands.
Sources and methodology
company annual reports filed with the SEC. FY2025 (fiscal year ending late-2025 or early-2026 depending on fiscal year-end) data was pulled per ticker via the company-facts endpoint https://www.sec.gov/edgar. Tags used: Revenues (or RevenueFromContractWithCustomerExcludingAssessedTax where present), CostOfRevenue and CostOfGoodsAndServicesSold, and GrossProfit. Gross margin computed as GrossProfit divided by Revenues. Where GrossProfit was not separately tagged, computed as (Revenues minus CostOfRevenue) divided by Revenues.
Tickers pulled (19). RVLV (Revolve), FIGS (FIGS), WRBY (Warby Parker), ETSY (Etsy), CHWY (Chewy), W (Wayfair), LULU (Lululemon), YETI (YETI), PTON (Peloton), BROS (Dutch Bros), ALLBIRDS (Allbirds), TPR (Tapestry), CROX (Crocs), SFIX (Stitch Fix), VSCO (Victoria's Secret), CURV (Torrid), VRA (Vera Bradley), RENT (Rent the Runway), CTRN (Citi Trends), plus SG (Sweetgreen). ON Holding (ONON) and Birkenstock (BIRK) file under the IFRS-full taxonomy and were excluded from the XBRL pull; brief mention only.
Revenue bands. Sub-$500M (Allbirds $152.5M, Vera Bradley $269.7M; Rent the Runway $43.8M flagged as outlier and excluded). $500M to $1B (FIGS $631.1M, Sweetgreen $679.5M, Citi Trends $820M, Warby Parker $871.9M). $1B to $3B (Torrid $1.00B, Revolve $1.23B, Stitch Fix $1.27B, Dutch Bros $1.64B, YETI $1.87B, Peloton $2.49B, Etsy $2.88B). $3B+ (Crocs $4.04B, Victoria's Secret $6.55B, Tapestry $7.01B, Lululemon $11.10B, Wayfair $12.46B, Chewy $12.60B).
Fiscal year alignment. Calendar 2025 used where fiscal year ends December 31 (RVLV, FIGS, WRBY, ETSY, W, YETI, ALLBIRDS, CROX, VRA, CTRN, BROS). For brands with non-calendar fiscal years (LULU 2026-02-01, CHWY 2026-02-01, PTON 2025-06-30, TPR 2025-06-28, SFIX 2025-08-02, VSCO 2026-01-31, CURV 2026-01-31), used the fiscal year most aligned with the calendar 2025 ecommerce reporting cycle.
BLS PPI series. PCU3253--3253-- Producer Price Index, Apparel Cut and Sew Manufacturing (NAICS 3253). Latest April 2026 index 307.85 (preliminary); April 2025 was 286.29; YoY +7.5%. WPS057303 Producer Price Index, Deep Sea Freight Transportation. Latest April 2026 index 508.71 (preliminary, up 39.3% from January 2026). Both pulled 2024-01 to 2026-04 via the BLS public API.
Private Shopify panel benchmarks. GM tier reads (67% under $5M, 68% $5M to $10M, 70% $10M to $50M, 79% $50M+) were synthesized from public 2026 panels by Hycos.ai, Yotpo benchmarks, and Eightx's own client read across $5M to $50M Shopify brands. Categories under each tier: beauty 65% to 85%, supplements 65% to 78%, apparel 50% to 65%, food and beverage 40% to 55%, electronics 30% to 50%.
Limitations. 10-K filings blend DTC and wholesale revenue inside one consolidated gross margin. Pure DTC GM is generally 100 to 300 bps higher than the blended number for hybrid brands. The sample is apparel-heavy (12 of 18 brands). Pure-play marketplace (Etsy) and furniture (Wayfair) are single observations. Private DTC brands at $5M to $150M are not in the public dataset; private panel synthesis is the triangulation. "Gross margin" definition varies across filers (Lululemon and Tapestry include occupancy in COGS; Chewy classifies some fulfillment in SG&A; Wayfair classifies inbound freight in COGS but advertising in OpEx). Comparisons are directional, not GAAP-identical.
Update cadence. This index is refreshed quarterly as FY 10-Ks land and the BLS PPI series update. Next refresh target: August 2026 (Q2 earnings season close + BLS Q2 PPI release).
Frequently asked questions
what's a good gross margin for a $5m dtc brand?
In the private Shopify panels (Eightx, Hycos, Yotpo 2026 reads) the $5M to $10M tier averages 68% gross margin, with beauty and supplements at the top of the range (75% plus) and apparel toward the bottom (55% to 65%). Public 10-K equivalents at the sub-$500M band sit lower (43.7% average) because they carry wholesale and retail drag that Shopify-pure brands do not. The honest test is whether your gross margin supports your CAC plus fulfillment plus contribution target. 68% is healthy; 50% in apparel is workable if your CAC is low; 35% on Shopify is a sourcing or pricing problem you should fix this quarter.
does my gross margin get better as i scale to $50m or $100m?
Not automatically. Private Shopify panels show GM rising with revenue tier (67% under $5M, 79% over $50M), but the lift is from category mix shifting toward higher-margin verticals and from pricing power, not from scale itself. Public 10-Ks tell the opposite story at the top: Wayfair and Chewy at $12B+ print 30% because their model is dropship marketplace and subscription pet retail. If you are a Shopify apparel brand at $5M with 55% GM, hitting $50M will not lift you to 75% unless you change category mix or pricing power. Plan for the GM you have, not the one scale will give you.
why does etsy print 71% gross margin and wayfair only 30%?
Different business models inside the same ecommerce bucket. Etsy is a take-rate marketplace plus ads: they do not buy or hold the inventory their sellers ship, so their COGS is mostly payment processing and infrastructure. Their 71.6% GM is normal for marketplace economics. Wayfair holds inventory, ships furniture, and includes inbound freight in COGS. Their 30.2% is normal for furniture dropship at scale. Tapestry's 75% sits with Etsy because luxury wholesale has the same structural advantage (high price, high margin). The lesson: when you benchmark, match the model, not the SKU.
is 45% gross margin too low for apparel in 2026?
It is below the public 10-K specialty apparel corridor (50% to 67%, with FIGS at 66.5%, Lululemon at 56.6%, Warby Parker at 54.0%, Revolve at 53.5%) and well below the private Shopify-pure apparel range (55% to 70%). 45% in apparel usually points to one of three causes: sourcing that has not been re-tendered in two years, price points set during a discount cycle that never reset, or wholesale revenue dragging the blended GM. The fix in priority order is renegotiate or re-source COGS, raise price on best sellers, then reduce promo cadence. A 5-point lift in two of three is achievable in six months.
how do tariffs and ocean freight affect my gross margin in 2026?
Hard, if you import from China. The 2026 tariff stack on China-origin apparel is roughly 44.5% (12% MFN plus 7.5% Section 301 plus 25% reciprocal). Vietnam equivalent is roughly 18%. Section 321 de minimis was repealed for China and Hong Kong in February 2025 and remains restricted after the February 2026 Supreme Court ruling. On top of that, BLS shows apparel PPI up 7.5% year-over-year and ocean freight up 73.8% YoY in April 2026. The Hycos read is 8 to 12 points of GM compression on affected SKUs. The defense is what e.l.f. Beauty did: small price increases per SKU before the cost hit. They held GM at 71% with 30 bps YoY compression at a 45% tariff rate. Pricing power is the GM defense.
should i benchmark against private dtc data or public 10-ks?
Both, for different reads. Private Shopify panels (Eightx, Hycos, Yotpo) tell you what DTC-pure brands at your revenue and category actually print today, so they are the right benchmark for your Shopify GM. Public 10-K data tells you what category and channel ceilings exist at scale (apparel specialty 50% to 67%, marketplace 70% plus, furniture 30%, food service 25%). If your business is hybrid (Shopify plus wholesale plus Amazon), neither dataset alone gives you the answer. Run the channel mix separately, compare Shopify GM to private panels, compare wholesale GM to the public hybrid brands (Crocs, YETI, Lululemon), then blend.
why is figs at 66% gross margin but lululemon only 56%?
Channel and category. FIGS is single-category (medical apparel), single-channel-dominant (DTC plus a small B2B business), with high pricing power against a captive professional audience. Lululemon is multi-category (yoga, training, run, men's), heavy retail-store footprint (700 plus stores), and large wholesale-adjacent business. Retail occupancy is in COGS for Lululemon (a real estate cost most pure DTC brands do not carry). Both numbers are healthy for their model; the gap is not a sourcing or pricing story, it is a channel and category story.
how do i tell if my low gross margin is a category problem or a sourcing problem?
Compare your GM to the top quartile of your category in the private Shopify panels (or to the public 10-K specialist in your category if there is one). If you are 10 points or more below, it is almost always sourcing or pricing, not category. If you are within 5 points of the top quartile, your category has a ceiling and the next move is mix shift (add a higher-margin product line) or channel shift (more DTC, less wholesale), not COGS work. The middle case (5 to 10 points below) usually has both causes. Re-tender your top 5 SKUs by COGS first, then look at price ladder.
what gross margin do i need to support paid acquisition at scale?
The rule we use with clients: contribution profit (GM minus variable marketing and fulfillment) needs to clear 30% for paid acquisition to compound. To leave 30% contribution after paid, you usually need 55% to 65% gross margin in the apparel and beauty categories, 50% in supplements, 40% in food and beverage. Sub-50% GM brands cannot scale paid acquisition without burning cash on every order. That is why specialty apparel at 55% to 65% is the sweet spot: it leaves room for CAC to climb without the unit economics breaking. If you are at 40% GM, your scale path is organic and email-driven, not paid.
what's the difference between gross margin and contribution margin and which one should i actually be optimizing?
Gross margin is revenue minus COGS, divided by revenue. Contribution margin is gross margin minus variable selling costs (paid marketing, payment fees, fulfillment, returns). Gross margin is the headline number on your 10-K and what bankers benchmark. Contribution margin is what actually pays your fixed overhead and profit. A 60% GM brand running 50% on paid is at 10% contribution and probably losing money after fixed costs. A 45% GM brand running 15% on paid is at 30% contribution and printing cash. Optimize both. Gross margin is the structural ceiling; contribution margin is the operating reality. Most $5M to $50M operators we work with are over-indexed on GM and under-tracking contribution.