
Insights
Average ecommerce margin compression rate 2020-2026: gross margin held, operating margin lost 9 points
Gross margin at the median for a 10-brand public DTC panel moved from 55.9 percent in FY2019 to 57.0 percent in FY2025, a net gain of 1.1 points. The compression story lives below the gross line. Median operating margin peaked at 14.6 percent in FY2020, collapsed to 2.9 percent at the FY2022 trough, and recovered only to 5.3 percent by FY2025. SG&A and marketing spend, not COGS, are where the margin went.
Key Takeaways
- Median gross profit margin barely moved in six years: 55.9% FY2019 to 57.0% FY2025, a +1.1 point net change. The post-COVID 'margin compression' narrative does not show up at the gross-profit line for the median public DTC brand.
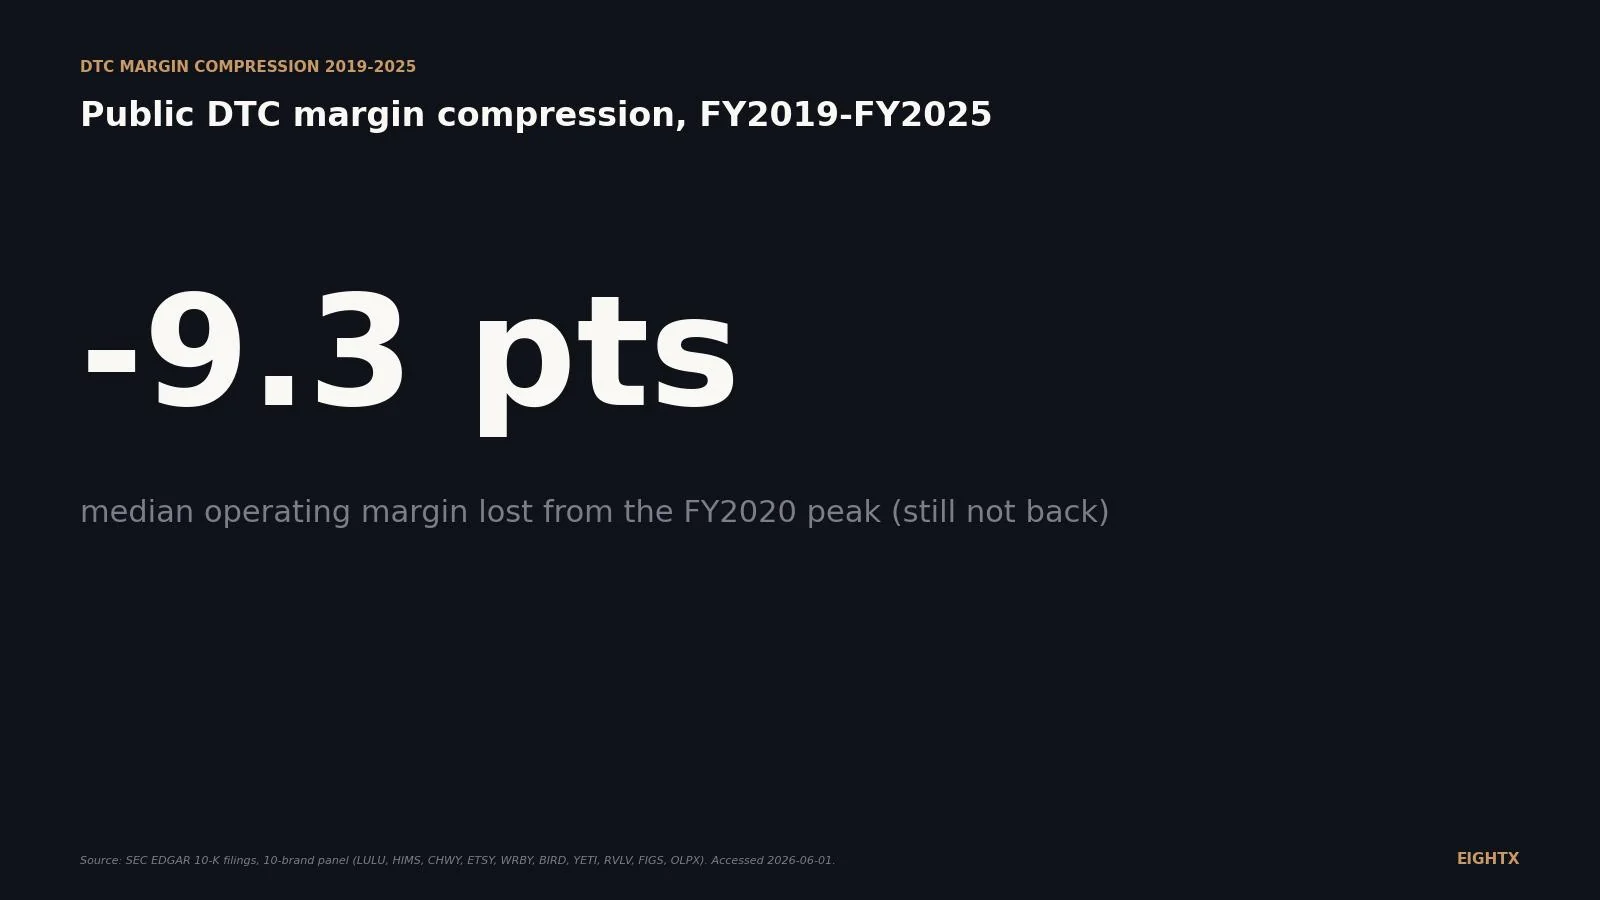
- Median operating margin peaked at 14.6% in FY2020, fell to 2.9% in FY2022, and only partially rebuilt to 5.3% in FY2025. That is a 9.3 point round-trip the median brand has not closed back.
- FY2020 was a sugar high, not a baseline. COVID demand-pull let brands run lean on marketing and leverage fixed costs. Six years in, the average public-DTC brand is roughly back to FY2019 profitability levels with no progress on operating leverage.
- Macro inputs were not the dominant compression driver. Apparel manufacturing PPI rose 18% across the window, transport and warehousing wages rose 28%, China import prices ended flat. Cost-of-goods inflation was real but largely passed through. What destroyed operating margin was demand normalization combined with sticky SG&A.
- Benchmark to FY2025 (5.3% median OM), not FY2020. A 10%+ operating margin is top-quartile in the public DTC peer set across the cycle. If you run a private 8-figure brand, do not chase a number that only existed during a one-year demand spike.
We track the margin compression story because the founder question we get every week is some version of the same thing. Is my 7% operating margin good or bad? Should I be at 15% by now? Are my competitors doing better and not telling me? The honest answer comes from looking at what the public DTC peer set has actually done across the post-COVID cycle. We built a 10-brand panel (Lululemon, Hims & Hers, Chewy, Etsy, Warby Parker, Allbirds, YETI, Revolve, FIGS, Olaplex), pulled FY2019 through FY2025 income statements straight from SEC EDGAR XBRL, and overlaid the FRED macro cost inputs (apparel PPI, transport and warehousing wages, China import prices). The result is the cleanest peer benchmark we have seen for a question operators get wrong constantly. The data is unambiguous: gross margin held. Operating margin did not. The compression story everyone calls a "margin problem" is overwhelmingly an SG&A and marketing-leverage problem, not a cost-of-goods problem.
Gross margin held, operating margin took the hit
The headline finding from the panel is that the two profit lines diverged sharply across the window.
Median gross margin across the 10 brands moved from 55.9% in FY2019 (n=8, pre-IPO Olaplex and YETI excluded) to 57.0% in FY2025 (n=10). Net change: +1.1 percentage points across six years. That is not a compression story by any reasonable read. The post-COVID narrative about freight, tariffs, and COGS destroying DTC margins does not show up at the gross-profit line for the typical public brand.
Median operating margin tells the opposite story. The series peaked at 14.6% in FY2020 (the COVID demand-pull year), collapsed to 2.9% in FY2022 (freight shock plus return-to-promotion plus large impairments), and has only partially rebuilt to 5.3% in FY2025. That is a 9.3 point round-trip the median brand has not closed back.
The operator takeaway is the thesis of this entire post: the "margin compression" public-DTC investors talk about lives below the gross-profit line. Cost of goods inflation was real but largely passed through to consumers. What destroyed operating margin was demand normalization (post-COVID volume rebasing) combined with sticky marketing spend and sticky fixed-cost growth (SG&A). When you grow opex through the demand peak and demand then normalizes, operating margin breaks before gross margin does.
FY2020 was a sugar high, FY2022 was the trough, FY2025 is the partial rebuild
The six-year window splits cleanly into three regimes.
FY2020 (the sugar high). Median operating margin: 14.6%. The pandemic forced consumer demand online, ad costs were temporarily depressed (Q2 2020 CPMs collapsed before recovering), and brands that had built infrastructure for $X of revenue suddenly did $1.5X with the same fixed-cost base. Operating leverage on the upside is brutal in the other direction; on the upside that year it printed the highest operating margins the DTC peer set had ever shown. Lululemon hit 18.6% OM. Etsy hit 24.6%. Olaplex (still pre-IPO, retrospective S-1 data) hit 30.5%, and went on to print a 55.8% OM in FY2021 as the demand-pull tailwind compounded.
FY2022 (the trough). Median operating margin: 2.9%. Three things hit at once. First, freight rates spiked in 2021 and stayed elevated through 2022 (ocean container rates were 4-5x pre-pandemic levels through Q1 2022). Second, demand normalized hard as consumers returned to in-store retail and discretionary categories like apparel and home softened. Promotional intensity returned. Third, brands that had pulled forward inventory in 2021 had to mark it down through 2022. Etsy took a $658M goodwill impairment that year. Allbirds OM hit -33.7%. Warby OM hit -18.6%.
FY2023-FY2025 (the partial rebuild). Median operating margin: 4.2%, 4.4%, 5.3%. The macro input picture cooled. Freight rates normalized. Apparel PPI deceleration arrived. Brands cycled through the markdown overhang. What did not recover was demand-pull. Allbirds, Warby Parker, and Olaplex all sit below their FY2019 operating margins two years after macro inputs normalized. The median brand is back to roughly FY2019 profitability levels, which means six years of no progress on operating leverage even though the typical brand is materially larger today than it was in FY2019.
The macro inputs that drove (and didn't drive) compression
Operators who blame COGS for the margin story are pointing at the wrong line. The FRED macro series tell a clear story.
Apparel manufacturing PPI rose 18% across the window. Transport and warehousing wages rose 28%. China import prices ended slightly below FY2019 levels (i.e. flat). Wage inflation is the dominant macro cost story for ecommerce operations; goods inflation was modest and reversed in 2024-2025.
But here is the kicker. None of those input-cost moves are large enough to explain the 9.3 point OM round-trip on their own. A 28% rise in fulfillment labor wages over six years (roughly 4.2% annualized) is significant but not catastrophic in a P&L where labor is one line of many. A flat-to-down China import price index means the COGS pass-through worked: brands raised prices, sourced more efficiently, and held gross margin. What the FRED data corroborates is that the compression was demand-side and SG&A-side, not input-cost-side.
Year Apparel PPI (FY2019=100) Transport+warehousing wages (FY2019=100) China import price index (FY2019=100) FY2019 100.0 100.0 100.0 FY2020 100.4 102.4 99.4 FY2021 101.2 106.5 102.4 FY2022 106.4 112.6 105.6 FY2023 109.3 118.5 103.4 FY2024 114.3 123.9 101.7 FY2025 118.0 127.6 99.2
Where gross margin actually moved: the spaghetti chart
The median series hides the brand-level dispersion. When you plot all ten panel members on the same axes, three callouts jump out.
Hims & Hers (HIMS): 54.0% to 73.8%, +19.8 points. This is the only panel member with a "true" gross margin expansion. The driver was the mix shift from physical OTC product into recurring telehealth and Rx subscription, which is a category-defining business-model change. Not pricing work, not COGS work. If you are looking at this trajectory and thinking "we should be expanding GM too," check whether your business model is structurally moving toward subscription or recurring services. Pricing increases will not get you 20 points.
Chewy (CHWY): 20.2% to 29.8%, +9.6 points. Scale leverage in a low-GM category. Chewy ran 20% gross margin in FY2019 and worked it up methodically through procurement leverage, private-label mix, and Autoship penetration. This is the closest the panel has to "pure operating execution drives GM expansion" and it took six years to move 10 points.
Allbirds (BIRD): 51.0% to 41.0%, -10.0 points. The cleanest case study in this panel of what happens when you cannot defend GM. Revenue went from $194M (FY2019) to $152M (FY2025). The brand compounded a -21.6% revenue trend with promotional intensity and channel mix shift away from full-price DTC. The GM erosion combined with operating deleverage. Operating margin sits at -52.4% in FY2025. This is the worked example of why defending GM matters even though the median brand held it.
The other seven brands stayed within a 5-point band. Lululemon: 55.9% to 56.6%. Warby Parker: 60.2% to 54.0%. YETI: 57.6% (FY2020) to 57.4% (FY2025). For the typical public DTC brand, gross margin was sticky in both directions.
What drove operating margin compression: the SG&A story
If gross margin held and macro inputs were modest, what destroyed operating margin? SG&A growth that did not match revenue growth. Two case studies show the mechanism.
Olaplex (OLPX): 55.8% OM (FY2021 peak) to 1.6% OM (FY2025). A 54-point operating margin compression in four years. Revenue dropped 29% (from $598M to $423M). Gross margin held at 69% the whole time. SG&A grew from $99M to $243M, a 147% increase. The brand bought back professional distribution, rebuilt its brand investment, and added marketing spend to defend against indie competitors. None of that flowed through to revenue (which kept declining). When fixed costs and brand investment are sticky and demand normalizes, operating margin collapses even if gross margin is fully intact. Olaplex is the cleanest case in the panel of "high gross margin does not save you."
Lululemon (LULU): 18.6% OM (FY2020) to 19.9% OM (FY2025). The OM-defender. But look inside the P&L: SG&A grew from $1.33B (FY2020) to $4.07B (FY2025), a 3.06x increase. Revenue grew 2.51x in the same window ($4.4B to $11.1B). Lululemon out-ran its SG&A growth on the revenue line, which is exactly what the rest of the panel failed to do. The fact that one of the strongest operators in the public DTC peer set still grew SG&A 3x in five years tells you how sticky the line is once it builds. Most brands cannot match LULU's revenue acceleration, so for them the same dynamic plays out as compression.
The general lesson: if your revenue growth slows below your SG&A growth for two or more years, the math is unforgiving. The panel ran into this between FY2021 and FY2023. Some brands have rebuilt operating leverage. Most have not.
What this means if you run a $5M to $150M private brand
Three takeaways the panel data forces.
Defending 55%+ gross margin matters less than people think. Most of the panel did defend it. It did not save them. If you spend your strategic energy on COGS programs that move GM 100-200 basis points, you are working a smaller lever than the operators around you. The bigger lever is SG&A as % of revenue. That is where the panel went from 8.3% mean OM (FY2020) to -0.2% mean OM (FY2022) in two years.
Benchmark to FY2025, not FY2020. The median public DTC operating margin in FY2025 is 5.3%. That is the realistic peer-set benchmark. The FY2020 spike of 14.6% existed because of a one-year demand-pull tailwind that does not repeat. If your board is asking why you are not at 10% OM, the answer is that only the top quartile of the public peer set hit 10% in FY2025, and they are operators like Lululemon and YETI with structural pricing power most $20M to $80M private brands cannot match.
Watch your SG&A-to-revenue ratio every quarter. If your SG&A is growing faster than revenue for two consecutive quarters, you have the same trajectory Olaplex and Allbirds did. The window to fix it is 12 to 18 months before it shows up in your debt covenants or your equity story. Cuts in that window are surgical (renegotiate the 3PL, kill the underperforming retainer, hold the open headcount); cuts after the window are public layoffs.
Full panel: every brand, every year, FY2019-FY2025
The complete data set behind the median series. Use the median row (last row) as the benchmark; the brand-level detail tells you which categories and business models drove the move.
Ticker FY2019 GM FY2019 OM FY2020 GM FY2020 OM FY2021 GM FY2021 OM FY2022 GM FY2022 OM FY2023 GM FY2023 OM FY2024 GM FY2024 OM FY2025 GM FY2025 OM LULU 55.9% 22.3% 56.0% 18.6% 57.7% 21.3% 55.4% 16.4% 58.3% 22.2% 59.2% 23.7% 56.6% 19.9% HIMS 54.0% -90.1% 73.6% -10.2% 75.2% -42.3% 77.6% -13.0% 82.0% -3.4% 79.5% 4.2% 73.8% 4.5% CHWY 20.2% -7.6% 23.6% -5.2% 25.5% -1.3% 26.6% -0.8% 28.0% 0.6% 28.4% -0.2% 29.8% 2.0% ETSY 66.9% 10.8% 73.1% 24.6% 71.9% 20.0% 71.0% -25.7% 69.8% 10.2% 72.4% 13.5% 71.6% 9.2% WRBY 60.2% -0.4% 58.9% -14.1% 58.8% -26.6% 57.0% -18.6% 54.5% -10.7% 55.3% -3.9% 54.0% -0.6% BIRD 51.0% -4.7% 51.4% -13.3% 52.9% -11.8% 43.5% -33.7% 41.0% -60.2% 42.7% -51.4% 41.0% -52.4% YETI n/a n/a 57.6% 19.6% 57.8% 19.5% 47.9% 7.9% 56.9% 13.6% 58.1% 13.4% 57.4% 11.4% RVLV 53.6% 8.0% 52.6% 10.5% 55.0% 11.8% 53.8% 6.6% 51.9% 2.1% 52.5% 4.6% 53.5% 6.1% FIGS 71.8% -0.3% 72.3% 22.0% 71.8% 2.6% 70.1% 7.4% 69.1% 6.2% 67.6% 0.4% 66.5% 6.0% OLPX n/a n/a 63.6% 30.5% 79.2% 55.8% 73.8% 51.7% 69.5% 23.6% 69.2% 15.8% 69.4% 1.6% Median 55.9% -0.4% 58.3% 14.6% 58.3% 7.2% 56.2% 2.9% 57.6% 4.2% 58.7% 4.4% 57.0% 5.3%
Gross margin held. Operating margin did not. The compression story everyone calls a "margin problem" is overwhelmingly an SG&A and marketing-leverage problem, not a cost-of-goods problem. If you set your internal benchmarks against FY2020, you are chasing a one-year demand spike. If you set them against FY2025, you are competing on the line your peer set is actually competing on, which is SG&A leverage.
What we are watching for FY2026
Three open threads for the next refresh of this tracker.
Tariff pass-through in FY2026 10-Ks. The April 2025 reciprocal tariff round and the de minimis closure for China goods (May 2025) should compress gross margin in late FY2025 and through FY2026 for import-heavy brands. The FY2025 panel median GM at 57.0% is already down 1.7 points from FY2024 (58.7%), so partial pass-through is showing up but the full hit has not yet landed in 10-K margins. We expect FY2025 median GM to revise further downward as more 10-Ks land through mid-2026. Watch the Q1 and Q2 FY2026 prints from LULU, BIRD, and FIGS for the first clean reads. LULU's March 2026 print already showed a 550 basis point gross-margin decline, which is the leading indicator.
Whether the median OM clears 7%. A 5.3% median OM in FY2025 is roughly back to FY2019 levels. The panel needs to clear 7% on the median to call this a real recovery instead of a holding pattern. Two more years of 5-6% would tell you the FY2020 spike was structurally non-repeatable and 5-7% is the new normal for the public DTC peer set.
Allbirds and Olaplex as workouts. Both are sub-2% operating margin at FY2025. Both have negative or near-zero revenue growth. Watch for either a strategic acquisition exit or a continued compression trajectory. The panel cannot carry two members below 2% OM indefinitely without one of them being acquired, taken private, or delisted.
For deeper context on how the public-market peer set compares to private brands at your scale, see the public DTC margin leaderboard and the average ecommerce profit margins benchmarks. For the cost-of-capital side of this story, the Fed funds vs DTC cost of capital tracker shows the rate environment public brands are operating in.
Sources and methodology
Primary data source. Company annual reports filed with the SEC, accessed 2026-06-01. Annual GAAP income-statement line items pulled per company for fiscal years 2019 through 2025. Gross margin = Gross profit / Revenues. Operating margin = Operating income (loss) / Revenues. All figures rounded to one decimal place.
Panel selection (n=10). Public DTC brands across apparel and footwear (LULU, BIRD, FIGS), home and durable (YETI), pet and marketplace (CHWY, ETSY), eyewear (WRBY), digital health (HIMS), specialty fashion (RVLV), and prestige beauty (OLPX). Filters: (a) majority DTC or DTC-led revenue mix; (b) full 10-K disclosure across at least FY2020 through FY2025; (c) GAAP income statement available in XBRL. Excludes private brands and IFRS filers (e.g., ON Holding).
Fiscal year alignment. Most panel members report on the calendar year. Lululemon and Chewy use 52/53-week years ending in late January or early February (so "FY2025" ends 2026-02-01). YETI uses a 52/53-week year ending in late December or early January (FY2025 ended 2026-01-03). For this time series, "FY2025" represents each company's most recently completed fiscal year covering substantially the 2025 calendar period.
Macro indices. Pulled from FRED. Apparel manufacturing PPI: PCU315315 (NSA, monthly to annual average). Transport and warehousing average hourly earnings: CES4300000003 (SA, monthly to annual average). China import price index, all industries: CHNTOT (NSA, monthly to annual average). All indexed to FY2019 = 100 for the chart and table.
Statistical aggregation. Median used for the headline series because it is resistant to outliers (Allbirds at -52.4% OM in FY2025 dominates any mean calculation). Mean reported in the FAQ for completeness. n varies by year: 8 in FY2019 (Olaplex and YETI pre-IPO); 9 in FY2020 once YETI and Olaplex enter; 10 from FY2021 onward.
Limitations. Panel size is 10, which is large enough for a stable median but small enough that one outlier (Allbirds) materially shifts the mean. Fiscal-year mismatches between LULU/CHWY/YETI and the macro calendar-year indices introduce mild misalignment in the FY2024-FY2025 comparison rows. This is public-DTC only; private 8-figure brand data is not included (the comparable private benchmark from Finaloop puts 8-figure private DTC GM at roughly 56%, close to the public median). Impairment charges (Etsy FY2022 at $658M) are reflected in the as-reported operating margin.
Update cadence. This is a Group A living index, refreshed quarterly to align with the public-company earnings cycle. Next update target: late August 2026 (post-Q2 FY2026 earnings, which captures the first clean read on tariff pass-through to gross margin). Research bundle: new-blogs/to-be-published/average-ecommerce-margin-compression-rate-2020-2026/research.md.
Frequently asked questions
has dtc gross margin actually compressed since 2020 or did it just feel that way?
It largely did not compress at the median. The 10-brand panel median moved from 55.9% in FY2019 to 57.0% in FY2025, a net +1.1 point change. Individual brands moved hard in both directions (Hims +20 pts, Allbirds -10 pts), but the typical public DTC brand defended its gross margin. The compression story everyone talks about lives below the gross-profit line.
what is a normal gross margin for a public dtc brand right now?
Around 57% at the median for the FY2025 cycle. The interquartile band sits roughly 53% to 70%. Sub-30% (Chewy) is the panel floor and is structural to the pet/replenishment category. 70%+ (Hims, Etsy, FIGS, Olaplex) is the panel ceiling and comes from subscription, marketplace economics, or prestige pricing power.
which years were worst for ecommerce margins between 2020 and 2025?
FY2022 was the trough. Median operating margin hit 2.9% versus the FY2020 peak of 14.6%. That single year combined the freight shock, post-COVID return-to-promotion, peak wage inflation, and large goodwill impairment charges like Etsy's $658M write-down. FY2023 started the rebuild but the median has only crawled back to 5.3% by FY2025.
did freight rates actually destroy gross margin in 2022 or is that an excuse?
Freight contributed but it was not the dominant driver and it largely passed through. Apparel PPI was up 6% year-over-year in 2022 (the spike year) and the median panel gross margin only dropped 2.1 points from 58.3% to 56.2%. Most brands raised prices to absorb the input cost. What did not pass through was sticky marketing and fixed-cost growth, which is why operating margin fell three times harder than gross margin did.
is the marketing line or the cogs line bigger for the margin squeeze story?
SG&A and marketing, by a wide margin. Look at Olaplex: gross margin held at roughly 69% through FY2025 but operating margin fell from 55.8% (FY2021 peak) to 1.6% (FY2025). Revenue dropped 29% and SG&A grew 147% as the brand rebuilt distribution and brand investment. Same pattern at Lululemon, where SG&A grew from $1.33B in FY2020 to $4.07B in FY2025 (3x) while revenue grew 2.5x. When growth slows but opex stays sticky, operating margin breaks first.
what is the median operating margin for a public dtc brand in 2025?
5.3% at the panel median. Mean is 0.8%, pulled down by Allbirds at -52.4%. Only LULU (19.9%) and YETI (11.4%) cleared a 10% operating margin in FY2025. HIMS (4.5%) and ETSY (9.2%) are the next two highest but both sit below the 10% threshold. A 10%+ OM is top-quartile in the public DTC peer set, not a typical benchmark.
did the 2020 covid bump permanently set unfair benchmarks for dtc operators?
Yes, and we still see it in client conversations. Operators who set their internal margin targets against FY2020 numbers are benchmarking against a one-year demand spike. The honest comparison is FY2019 (pre-COVID) or FY2024-FY2025 (post-normalization). The COVID year let brands run lean on ad spend and leverage fixed costs against demand they did not have to earn. None of those tailwinds persist.
if i run a private 8-figure dtc brand should i benchmark against fy2019 or fy2025?
Both. FY2019 gives you the pre-pandemic baseline (median public OM was -0.4%, which tells you growth-stage DTC was not a high-margin business even before COVID). FY2025 gives you the current normalized benchmark (5.3% median OM). If you sit at 8-12% operating margin on $20M to $80M revenue, you are running ahead of the public peer set. If you sit below 3%, your SG&A is doing the same thing Olaplex's did and you have a 12-month window to fix it before it gets cycled into your debt covenants.