
Insights
Average ecommerce marketing team size by revenue band: what a $1M, $10M, $50M, and $100M DTC brand actually staffs in 2026
At $1M a DTC brand typically has one generalist marketer or a founder doing the job. By $10M the median is 2 to 3 FTE plus agency coverage. At $50M the benchmark is 6 to 10 in-house with channel specialists. Public companies like Revolve show marketing intensity of 12 to 15% of revenue at scale, but headcount efficiency (revenue per marketing FTE) matters more than raw team size.
Key Takeaways
- Public DTC brands cluster at 12 to 15 percent marketing intensity once they're past roughly $600M revenue. Warby Parker ($872M, 12.6%), FIGS ($631M, 14.8%), and Revolve ($1.2B, 14.6%) all sit inside a 220 basis point band in FY2025 SEC filings. The band is unobserved below ~$600M. Allbirds at 32.3% is what distress looks like.
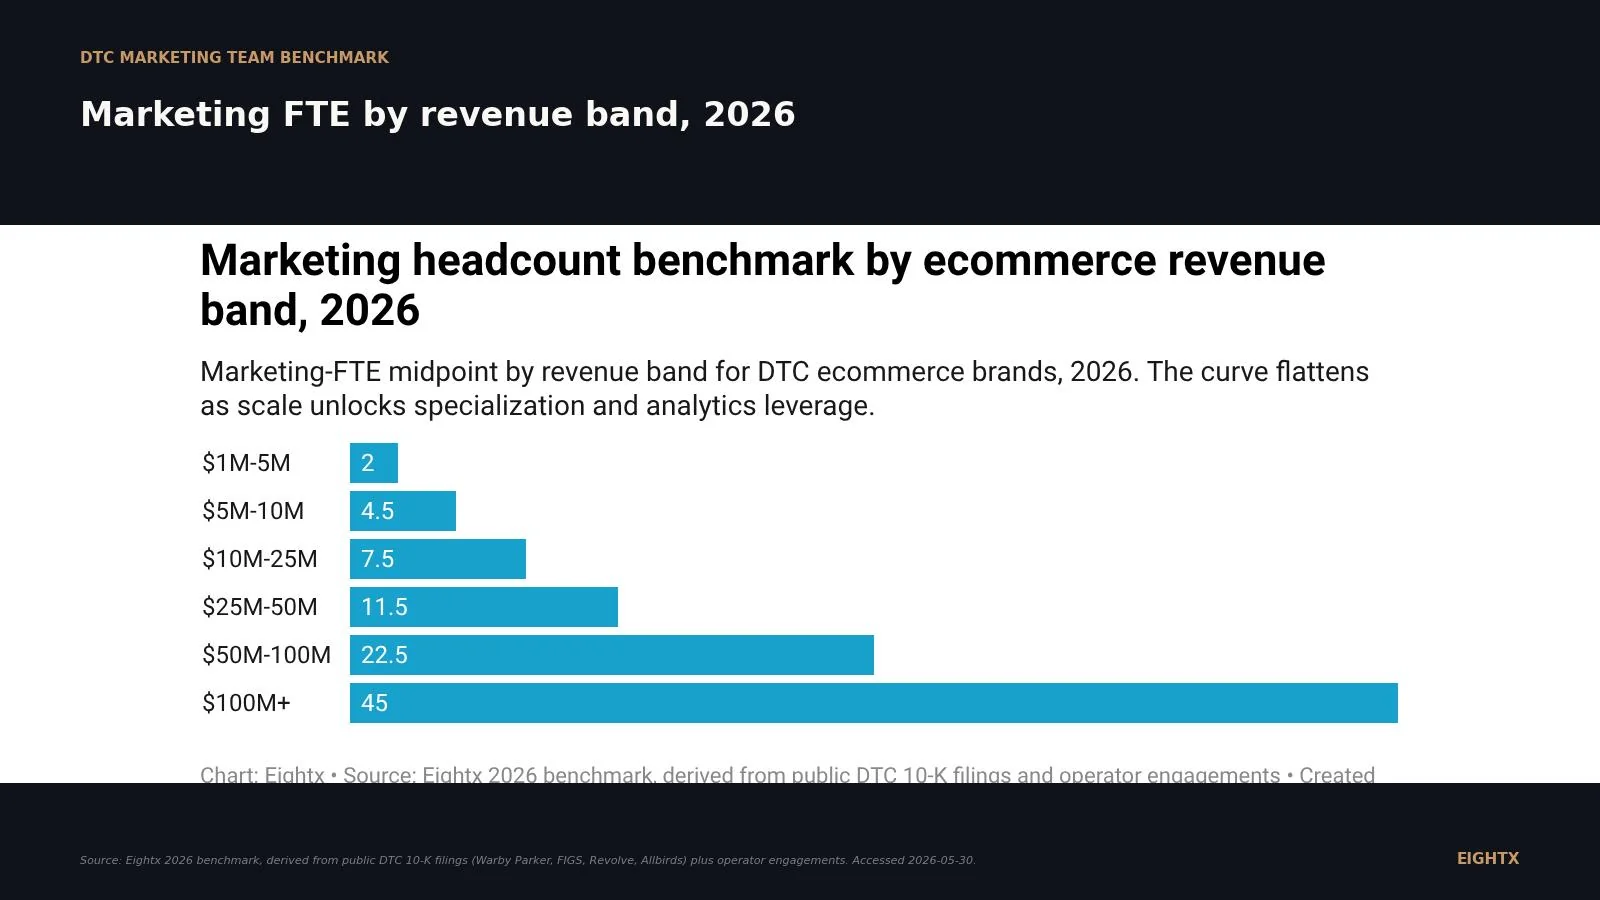
- The marketing FTE curve flattens above $30M. Plan for 0.4 to 0.8 marketing FTE per $1M revenue from $5 to $30M, then 0.3 to 0.5 FTE per $1M above $30M. Analytics, lifecycle automation, and AI tooling let one operator cover more revenue.
- Revolve disclosed 61 marketing employees on $1.2B revenue. That's 1 marketer per $19.7M revenue at billion-dollar scale, the only primary-source marketing-FTE disclosure across the public DTC universe (per their 2025 annual report).
- Retail openings are up 48 percent year over year but retail employment is flat. The hiring surge is store-side. Your competitive labor pool (marketing, lifecycle, analytics) is tighter than the BLS headline suggests.
- 94 percent of retail executives plan to insource more marketing in 2026. AI tooling collapsed the cost of in-house creative and lifecycle work, which is bending the in-house vs. agency split at every revenue band.
We get the same headcount question from every operator on the first call. "When do I hire a paid media person? Do I really need a head of retention at $8M? Should retention be in-house or agency?" The honest answer is the benchmark is downstream of three things at once: your revenue band, your in-house vs. agency posture, and what your competitors disclose in their 10-Ks. This post lays out all three so you can stress-test your marketing-team plan against the public-company universe, the BLS labor backdrop, and the Eightx 2026 operator curve before you post the role.
What public DTC filings tell us about marketing intensity
The cleanest signal in marketing-team sizing is public-company marketing intensity, defined as total marketing spend divided by revenue. Three DTC public brands in very different categories (eyewear, healthcare apparel, fashion) cluster inside a 220 basis point band in FY2025.
Warby Parker spent 12.6 percent of revenue on marketing in FY2025: $110.2M of marketing on $871.9M of revenue, per their 10-K filed 2026-02-26 (accession 0001504776-26-000006). FIGS spent 14.8 percent ($93.1M on $631.1M) per 10-K accession 0001628280-26-012333. Revolve Group spent 14.6 percent ($175.4M on roughly $1.2B) per accession 0001193125-26-071307. Three categories, three different brand teams, one tight benchmark.
Allbirds is the outlier and it's worth understanding why. Allbirds spent 32.3 percent of revenue on marketing in FY2025 (approximately $45.2M on roughly $140M revenue, per 10-K accession 0001628280-26-022192). One caveat: the $140M revenue figure is a Q1-Q3 2025 trajectory estimate (Q1 $32.3M + Q2 ~$25.8M + Q3 ~$34M, annualized), not yet read directly from the 10-K revenue line. We will refresh once the full-year 10-K text is in. That's not a marketing-intensity benchmark you should aspire to. It's what a distressed brand looks like when revenue collapses faster than marketing budgets can be cut. Allbirds is in restructuring. Their marketing percent of revenue is a denominator problem, not a strategy choice.
The practical read for a private DTC operator at $5M to $150M: 12 to 15 percent marketing intensity is the steady-state benchmark for a healthy public brand at scale. If you're below 10 percent at $20M revenue you are probably underspending or have a strong organic engine you should keep feeding. If you're above 20 percent and not in growth-mode (40 percent or higher year-over-year revenue), the audit starts at MER and the agency relationship, not at headcount.
One more caveat worth surfacing. 10-K marketing expense is total marketing (advertising, agencies, marketing payroll, tooling, attribution stack), not marketing payroll alone. Payroll-only is not separately disclosed in public filings. So the 12 to 15 percent intensity benchmark is total marketing, and the marketing-payroll-percent-of-revenue benchmark sits inside it, typically at 2 to 4 percent of revenue at scale.
The marketing FTE per $1M revenue curve
The headcount curve is what the operator actually needs to plan against. We derived it by combining (a) our 2026 DTC ecommerce headcount-per-revenue benchmark, which gives total company FTE by revenue band, and (b) operator-observed marketing-share-of-headcount ratios from Eightx engagements: 20 to 30 percent of total company FTE sits in marketing functions at $5 to $50M revenue.
That math produces a flattening curve. Marketing FTE per $1M revenue runs 0.4 to 0.8 between $5M and $30M revenue (where every channel needs a dedicated owner), and 0.3 to 0.5 above $30M (where analytics and lifecycle automation start covering more revenue per head).
Revenue band Total company FTE Marketing FTE (low-high) Marketing % of company headcount Marketing payroll % of revenue Total marketing spend % of revenue $1M-5M 5-15 1-3 20-30% 4-8% 20-30% $5M-10M 15-25 3-6 20-30% 3-6% 15-25% $10M-25M 25-45 5-10 20-25% 3-5% 12-22% $25M-50M 45-60 8-15 18-25% 3-5% 12-20% $50M-100M 80-120 15-30 18-25% 2-4% 10-18% $100M+ 110-160+ 30-60 20-30% 2-4% 8-15%
The single primary-source datapoint that anchors the curve at the top end is Revolve. Their 2025 annual report discloses 61 marketing employees on December 31, 2025 (per the Revolve Group 2025 Annual Report PDF). On approximately $1.2B revenue, that's 1 marketer per $19.7M revenue, or roughly 0.05 FTE per $1M. Marketing payroll on Revolve is implied at 3 to 4 percent of revenue, well inside the curve above.
What a marketing org actually looks like at $5M, $10M, $25M, $50M
The role-mix matters more than the total headcount because the wrong shape (heavy on creative, light on analytics) costs you efficiency at every band. Below is the role-mix we see across $5 to $50M Eightx engagements.
Function $5M-10M $10M-25M $25M-50M Head of Growth or VP Marketing 1 1 1 Paid Media (Meta, Google, Amazon, retail media) 1 2 2-3 Email, SMS and Retention 1 1-2 2 Creative or Content Producer 1 1-2 2-3 Lifecycle and CRM 0 1 1-2 Marketing Analyst or Ops 0-1 1 1-2 Content and SEO 0 (freelance) 0-1 1-2 Total in-house FTE 3-6 5-10 8-15 Agency reliance High (paid + creative) Channel-specific Specialist only
The two functions to watch as you scale through these bands are lifecycle and analytics. Lifecycle (the CRM, segmentation, journey-build work that sits on top of email and SMS) usually appears as a distinct hire at $10 to $15M, before that it's bundled into "email and SMS." Marketing analytics or ops usually appears at $15 to $20M, before that it's the head of growth running spreadsheets at 11pm.
Get those two roles in the org chart at the right time and your blended efficiency holds as you scale. Skip them and you'll feel it in your MER long before it shows up in any benchmark.
In-house versus agency: the 2026 inflection points
The Deloitte 2026 Retail Industry Global Outlook reports that 94 percent of retail executives plan to bring more marketing in-house in 2026. That number sounds huge and it's worth unpacking what it actually means, because no operator we work with is exiting their agency stack wholesale.
What's happening is power-shift, not wholesale insourcing. AI tooling (generative creative, lifecycle automation, agent-based attribution) collapsed the cost of running a function in-house. The break-even moved. Functions that needed an agency to clear the volume bar in 2022 can now clear it with one in-house operator plus tooling in 2026. Three functions in particular have crossed that line:
Lifecycle and retention (email, SMS, CRM). Tooling cost is low, iteration cadence is fast, signal value compounds when retention sits next to merchandising and CX. Insource by $5 to $10M.
Creative production at standard volume. Static ads, lifecycle creative, basic UGC editing. Insource by $15 to $25M, keep an agency for premium video and bursty campaigns.
Analytics and attribution. Insource by $15 to $25M. The MMM, MER, and incrementality work sits too close to the P&L to outsource at scale.
What stays agency-heavy through $50M is paid media auction expertise (especially Meta + Google bid management), platform-specific specialists (TikTok, Reddit, programmatic), and creative production at burst volume. The hybrid model is the dominant 2026 shape. One in-house operator owns the brief, budget allocation, and weekly read. The agency owns the execution at scale.
The line one of our portfolio operators uses captures it best. Marketing and finance don't usually talk well together. The brands that figure out how to get them talking, with one person owning the marketing-finance handshake, beat the brands that treat marketing-team size as an org-chart exercise. Marketing intensity at 14 percent only works if someone owns the relationship between spend, output, and contribution margin.
Why the labor backdrop matters for your 2026 hiring plan
Two BLS data points shape the 2026 marketing-hiring environment. First, retail job openings hit 737,000 in March 2026, up 48 percent year over year (BLS JOLTS series JTS440000000000000JOL). Second, retail employment is essentially flat at 15.47M in April 2026, up 0.03 percent year over year (BLS CES series CES4200000001).
The headline says hiring is booming. The gap between openings and net employment says employers are posting defensively to replace churn, not expanding. The openings surge is concentrated in store-side and seasonal restock roles, which means the competitive labor pool for your marketing, lifecycle, creative, and analytics hires is tighter than the headline suggests. Same labor-cost pressure (total private wages are up 3.6 percent year over year per BLS CES CES0500000003) without the slack the headline implies.
The practical read: budget a 4 to 5 percent annual payroll-inflation buffer into your 2026 marketing plan. Every FTE you add costs roughly 3.6 percent more than it did a year ago. Compounded against the FTE curve above, that's an additional 1 to 2 percent of revenue in marketing payroll if you don't either freeze hiring, raise prices, or take the productivity gain back from your tooling stack.
Sources and methodology
SEC EDGAR XBRL Frames API, accessed 2026-05-30. Marketing-expense and revenue line items were pulled for Warby Parker (CIK 1504776), FIGS (CIK 1846576), Revolve Group (CIK 1746618), and Allbirds (CIK 1653909) for FY2025 using the MarketingExpense and RevenueFromContractWithCustomerExcludingAssessedTax tags. All four 10-Ks were filed February through March 2026 (accessions 0001504776-26-000006, 0001628280-26-012333, 0001193125-26-071307, 0001628280-26-022192).
Revolve Group 2025 Annual Report. The marketing-FTE count of 61 employees as of December 31, 2025 comes from Revolve's 2025 annual report PDF at s203.q4cdn.com. This is the only primary-source disclosure of marketing headcount we found across the public DTC universe (Allbirds, FIGS, Honest Company, Stitch Fix, BARK, YETI, and Warby Parker do not break out marketing headcount in their filings).
BLS JOLTS and CES, accessed 2026-05-30. Retail trade openings (JTS440000000000000JOL) and retail trade employment (CES4200000001), both seasonally adjusted. Total private wage growth comes from CES0500000003. JOLTS data publishes with a roughly six-week lag, so March 2026 was the most recent observation at publish.
Eightx 2026 ecommerce headcount curve. Total company FTE by revenue band comes from our companion benchmark at headcount per million revenue, public DTC 2026. The marketing-FTE band in this post is derived by applying operator-observed marketing-share-of-headcount ratios (20 to 30 percent of total company FTE at $5 to $50M, sliding to 18 to 25 percent at $50 to $100M) to that base curve.
Limitations. The marketing FTE per $1M revenue figures are derived, not directly observed. We back into them from the total-headcount curve plus a marketing-share ratio. The single primary-source datapoint (Revolve at 61 marketing FTEs on $1.2B) confirms the high end of the curve but does not validate the mid-band ($5M to $50M) ranges. The public-comp 12-15% marketing-intensity band is based on three FY2025 DTC filings ($631M to $1.2B revenue) and should not be read as a universal benchmark below ~$600M revenue. The Allbirds FY2025 revenue figure of ~$140M is estimated from Q1-Q3 2025 trajectory (not yet read directly from the 10-K text); we will refresh once the full-year revenue line is verified. The Deloitte 2026 Retail Industry Global Outlook 94 percent insourcing stat is a survey aggregator, not a single-source primary survey, and the underlying methodology has not been independently audited. The 10-K marketing-expense line is total marketing (advertising, agencies, payroll, tooling) and is not separable into payroll-only without additional disclosure.
Update cadence. This benchmark is refreshed quarterly when new 10-K filings and BLS labor readings land together. Next update target: September 2026 (Q2 BLS JOLTS series + any mid-year Allbirds disclosure refresh).
The headline question every operator asks is the wrong question. It's not "how many marketers should I have at $10M?" The right question is "what marketing-finance handshake am I building, and how many FTE does that handshake need?" Get that right and the marketing-intensity ratio falls into the public-brand band on its own. Skip it and you'll buy a team that looks right on the org chart and a P&L that doesn't.
What to do this week if you're $5M to $100M
Three moves, in order. First, pull your trailing-12-month marketing spend percent of revenue and compare it against the 12 to 15 percent public benchmark and the table above for your revenue band. If you're more than 5 points off, that's your first audit cut.
Second, count your in-house marketing FTEs (including fractional allocations) and divide by your trailing-12 revenue in millions. If the result is above 0.8 at $5 to $30M, or above 0.5 above $30M, you're probably over-resourced. If it's below the floor of the band, expect to feel it in your iteration speed and channel coverage.
Third, look at the lifecycle and analytics rows of the role-mix table. If those two seats are empty at $10M-plus, that's the first hire to make in Q3. Tooling alone won't close the gap, the in-house owner is the multiplier.
For the broader DTC operator labor picture this quarter, see our DTC layoff and hiring tracker and Q1 2026 macro pulse dashboard. For the finance-marketing handshake the data points at, our fractional CFO for ecommerce overview is the working starting point.
Frequently asked questions
how many marketers should a $5m dtc brand have?
Plan for 3 to 6 in-house marketing FTEs at $5M revenue. Typical shape is 1 marketing lead, 1 paid media buyer, 1 lifecycle or email/SMS person, and 1 creative producer, with content and analytics handled by freelancers or partial allocations. Below 3 FTEs you're under-resourced for $5M scale. Above 6 FTEs you're either over-hiring or compensating for a weak agency stack.
when should i hire my first head of growth or vp marketing?
When marketing spend crosses $1M annual or the founder is spending more than half their time inside paid media, retention, and creative review. Below that, a fractional CMO plus a strong paid-media operator usually outperforms a full-time hire. The sequencing line from Eightx engagements is the same one a founder told us last quarter: start with fractional C-level for the strategy, then layer in the full-time executor.
is 15 percent of revenue too much to spend on marketing for a dtc brand?
At scale, no. The three healthy public DTC comps (Warby Parker, Revolve, FIGS) all run 12.6 to 14.8 percent marketing-to-revenue in FY2025. In growth mode at $5 to $30M, 18 to 25 percent is common and defensible if the contribution-margin math works. Above 25 percent on a non-growth-mode brand is a sign your blended efficiency has slipped and the audit needs to start at MER, not headcount.
should retention email and sms be in-house or agency at $10m?
In-house. Lifecycle is the function with the cleanest in-house economics at $10M because the tooling cost dropped, the campaign cadence is predictable, and the iteration loop is short. Agencies still make sense for paid media (auction expertise) and creative production (volume), but retention should sit inside the team where it can feed product, CX, and merchandising signals back into the email program.
what does a $50m dtc marketing org chart actually look like?
Typically 15 to 30 in-house marketing FTEs. The shape is 1 VP or CMO, a 3 to 4 person paid-media team (Meta, Google, Amazon, retail media), 2 lifecycle and CRM people, 2 to 3 creative producers, 1 to 2 in marketing analytics or ops, and 1 to 2 in content and SEO. Agencies cover specialist channels (TikTok, Reddit, programmatic display) and creative overflow. Compare this against the public-brand benchmarks before locking your plan.
how many people do public dtc brands like warby parker and figs have in marketing?
Only Revolve discloses the count. The 2025 Revolve annual report lists 61 marketing employees as of December 31, 2025, on roughly $1.2B revenue. That's 1 marketer per $19.7M revenue, or about 5 FTEs per $100M. Warby Parker, FIGS, Allbirds, YETI, Stitch Fix, BARK, and Honest Company do not separately disclose marketing headcount in their filings, so the public-brand FTE benchmark is one data point plus our derived curve.
what is the marketing fte per million revenue benchmark for ecommerce in 2026?
Roughly 0.4 to 0.8 marketing FTE per $1M revenue between $5M and $30M, then 0.3 to 0.5 FTE per $1M above $30M. The curve flattens because analytics, lifecycle automation, and AI tooling let one person cover more revenue once you've crossed the scale threshold. This is a derived benchmark, not a primary survey. Use it as a sanity check against your own org chart, not a hiring plan.
should i in-house paid media or keep an agency at $10 to $25m?
Hybrid is the dominant answer in 2026 engagements. Keep an agency for auction-aware bidding, creative testing volume, and platform-specific expertise, and put one in-house operator on top to own the brief, the budget allocation, and the weekly read. The 94 percent retail-executive insourcing trend from the Deloitte 2026 outlook is real but it's not a full agency exit. It's a power-shift toward the in-house owner.