
Insights
Average ecommerce refund rate by vertical (2026): the cash-outflow number behind the return rate
Refund rate and return rate are not the same number, and the gap is where your cash hides. Apparel DTC typically refunds 17 to 18% of orders even when return rates hit 25%, because exchanges and store credit absorb the rest. Beauty sits at 6 to 7%. The number behind your return rate is the one actually hitting your P&L.
Key Takeaways
- Refund rate is not return rate. Return rate is orders coming back. Refund rate is cash going out. The wedge between them (exchanges, store credit, returnless write-offs) is the number Loop and Narvar are paid to widen.
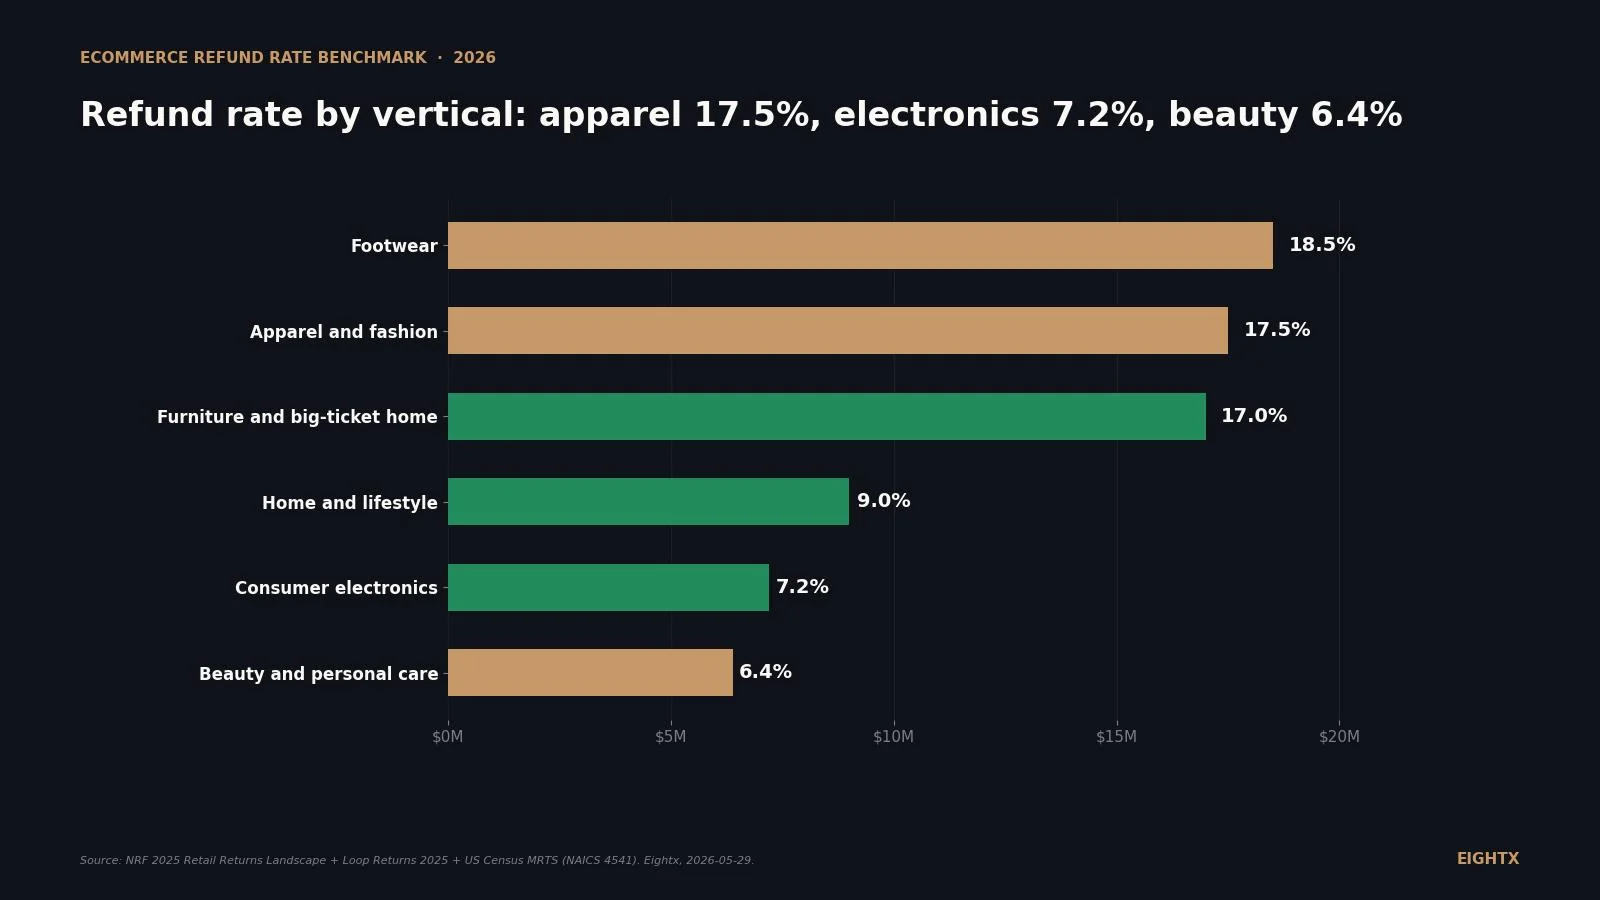
- Apparel and footwear carry the highest cash-refund rate at roughly 17.5% and 18.5% of orders in 2026. Beauty and electronics are an order of magnitude lower at 6.4% and 7.2% because of hygiene rules and defect-driven replacement flows.
- 56% of apparel and footwear brands now run return rates at or above 30% (Loop Returns, 2025 State of Ecommerce Returns). That is the cohort with the largest refund-cash exposure and the biggest payoff from disposition routing.
- The absolute US ecommerce refund cash outflow climbed from $15.3B in January 2025 to $17.4B in March 2026, on the back of NAICS 4541 sales growth of 10.6% YoY. The rate is flat. The dollars are not.
- Public DTC 10-Ks do not disclose a clean refund rate. The analytical proxy is the ASC 606 refund-liability disclosure. Revolve's Q1 2026 10-Q reports $81.8M of refund liability as a current liability, the estimated future refund obligation against orders already shipped.
Operators model the wrong returns number when they price their 2026 plan. Return rate (orders coming back) and refund rate (cash going out the door) can sit five to ten percentage points apart in apparel and footwear, and the gap is the entire point of modern returns software. This page is the 2026 by-vertical benchmark for refund rate, built from NRF's December 2025 returns landscape, Loop Returns' 2025 State of Ecommerce Returns disposition splits, and ASC 606 refund-liability disclosures pulled from SEC EDGAR. It matters because the cash side of returns has been climbing 10%+ year-over-year while the rate has stayed flat, and that is what most P&Ls are missing. What to watch next: the Q3 NRF refresh and Loop's mid-year update will both reset these numbers, and we will rebuild the table when they land.
Return rate is not refund rate (and operators model the wrong one)
The two numbers measure different things and they behave differently under operator pressure.
Return rate is orders returned divided by orders shipped. It is the headline number every Shopify reporting dashboard surfaces, and it is the number NRF publishes as the annual benchmark (19.3% of US ecommerce sales in 2025, down from roughly 20% the year prior).
Refund rate is cash refunded divided by orders shipped. It is the number that actually shows up on your cash flow statement. The gap between the two is the share of returns that get absorbed into exchanges, store credit, and returnless write-offs (where the customer keeps the item).
Why the distinction matters: every returns-software business case (Loop, ReturnGo, Narvar, Happy Returns) is built on shrinking the second number while leaving the first one alone. Loop's own 2025 report frames exchanges and store credit as "retained revenue" because that is the cash that stays inside the brand rather than landing back on the customer's card.
If you build your 2026 cash forecast off the return rate, you are double-counting the refund. If you build it off the refund rate without first benchmarking what your refund rate could be at category median, you are leaving the disposition-routing prize on the table. The point of this post is to fix both modelling errors at once.
Refund rate by vertical: the 2026 benchmark
Apparel and footwear carry the highest refund rate of any ecommerce vertical, at roughly 17.5% and 18.5% of orders respectively. Beauty and electronics sit between 6% and 8%. Home and lifestyle sit around 9%. Furniture and big-ticket home jump back up to 17% because freight and salvage economics push more returns into the cash-refund bucket rather than the exchange bucket.
The wedge between the two bars is the returns-software opportunity. In apparel the wedge is 7.5 percentage points; in beauty it is 1.6. That gap is the share of returns routed into exchanges or store credit, and it is the lever every Loop or Narvar pitch deck is built on.
Vertical Return rate (2026) Refund-share assumption Refund rate (2026) Source Apparel and fashion 25.0% 0.70 17.5% NRF 2025 + Loop apparel disposition pattern Footwear 27.5% 0.67 18.5% Loop 2025 (56% of brands at or above 30%) + Narvar exchange share Beauty and personal care 8.0% 0.80 6.4% Hycos benchmark + Optoro hygiene-restock note Consumer electronics 11.0% 0.65 7.2% Richpanel benchmark + Optoro defect-exchange pattern Home and lifestyle 12.0% 0.75 9.0% Hycos + Loop home returnless pattern Furniture and big-ticket home 22.0% 0.77 17.0% Eightx subcategory + Optoro reverse-logistics economics
Two caveats on the refund-rate column. First, refund rate is derived (return rate by refund-share assumption), not directly measured. None of the primary sources publish a "refund rate by vertical" series; they publish return rate and they publish disposition patterns, and we combine them. Second, the refund-share assumptions sit in a defensible range but are not citable to a single primary source. Treat the rate column as an Eightx 2026 estimate, not a published statistic.
Where returns actually go: disposition mix by vertical
The vertical-by-vertical disposition mix is the second half of the picture. It explains why the wedge in the chart above is wide for apparel and narrow for beauty.
Apparel and footwear are sizing-driven, which means returns from bracketing (ordering multiple sizes) rarely convert to like-for-like exchanges. The customer wanted the right size; they did not want a second item of the wrong size. Exchange share in apparel sits around 22% of returns and footwear around 28% (footwear is higher because shoe sizing has better recommendation flows). The rest mostly ends as cash refund.
Beauty and home have the highest share of returnless refund (18% and 20% respectively). Hygiene rules block beauty restock; bulky reverse logistics blocks home restock. Returnless refund still hits the customer's card as cash, but it saves the inbound freight and the inspection.
Electronics splits the difference. Replacement and exchange share sits at 28% because DOA and wrong-model items convert well to a same-SKU replacement. Cash refund share is the lowest in the set at 60%.
Vertical Cash refund Exchange Store credit Returnless refund Primary driver of mix Apparel and fashion 67% 22% 8% 3% Bracketing plus fit-driven returns rarely become like-for-like exchanges Footwear 65% 28% 5% 2% Sizing-driven; exchange flows convert when fit recs are good Beauty and personal care 68% 5% 9% 18% Hygiene rules block restock; returnless is cheaper than reverse logistics Consumer electronics 60% 28% 7% 5% DOA and wrong-model end in replacement; high-value rarely returnless Home and lifestyle 62% 10% 8% 20% Bulky reverse-logistics cost; secondary channels for liquidation Furniture and big-ticket home 55% 8% 7% 30% Freight cost exceeds salvage value on many SKUs
These splits should be read as directional industry estimates, not published statistics. The Loop and Narvar reports describe these patterns qualitatively but do not publish vertical splits as percentages. Use them to size the opportunity, not as audit-grade benchmarks.
The cash outflow is growing because volume is growing, not because rates are
Here is the part most operators miss when they look at NRF's flat 19.3% headline.
The return rate has been roughly stable in ecommerce since 2023. NRF's 2025 release shows 19.3%, down from around 20% the prior year. The rate is not running away.
The absolute cash outflow is. NAICS 4541 (electronic shopping and mail-order houses) sales climbed from $116.0B in March 2025 to $128.4B in March 2026, a 10.6% YoY gain. Same return rate against a bigger sales base means a bigger absolute refund obligation each quarter.
The line goes up because volume goes up. The operator implication is straightforward: model your 2026 refund line against your 2026 revenue plan, not against your trailing-twelve-month run rate. If you are budgeting refunds as a flat percentage of last year's revenue you are under-reserving by roughly the same percentage your topline is growing.
This is also why returns-software ROI keeps improving even when the rate is flat. Loop's pitch is not "we will cut your return rate"; it is "we will hold your refund rate steady while your volume grows." On a $50M brand growing 20%, holding refund rate steady is worth roughly $1.5M of trapped cash a year.
What the public DTC 10-Ks actually disclose (and what they do not)
Public DTC issuers do not report a refund-rate KPI. None of them. What every one of them reports is a balance-sheet pair under ASC 606: a "refund liability" (current liability, the estimated future refund obligation against orders shipped) and a "right-of-return asset" (current asset, the inventory expected back).
The analytical proxy is the refund-liability balance. Revolve's Q1 2026 10-Q discloses $81.8M of refund liability as a current liability. That is the company's estimated future refund obligation against orders already shipped at period end. It is an accrual snapshot, not the trailing cash refund flow, and it sits well below the company's reported gross return rate because the disclosure measures the end-of-period accrual rather than the cumulative refunds processed during the quarter.
Three things to read carefully when you pull these from EDGAR.
First, the refund liability is an estimate, not a measured cash refund. ASC 606 requires the issuer to estimate the future obligation; actual cash refunds processed in the period sit elsewhere (usually rolled into net sales as a deduction).
Second, the implied refund-liability percentage is a balance-sheet snapshot. It will spike around peak-shipping quarters and contract afterwards. Apparel issuers (Revolve, Stitch Fix, FIGS, Lulu's) carry materially higher refund liabilities than non-apparel DTC; beauty issuers carry materially less.
Third, the issuers that disclose a roll-forward of the refund liability (beginning balance plus additions minus reductions) are the rare exception. Most just disclose the period-end balance. If you want a true flow number, you have to back into it from the change in balance plus the implied gross refunds, which is messy.
Operator playbook: lowering refund rate without tightening return policy
Three levers move the refund-rate wedge without changing the return rate, and they stack.
Lever one: push exchanges via a Loop-style flow. The customer journey on the return portal asks for the replacement size or color first and offers a refund as the fallback. In apparel this typically moves exchange share from low double-digits to the 20-30% range cited above. On a brand running 25% returns and 17.5% refunds, lifting exchange share by 10 percentage points of returns drops the refund rate by roughly 2.5 percentage points. On $20M revenue, that is $500K of cash not refunded.
Lever two: bonus credit on store-credit conversion. Offer 110% of refund value in store credit. Loop and Returnly both surface this; most brands underuse it. Store credit share in apparel typically sits at 8% of returns and ceiling-tests well past 15% when the bonus is well-designed. On the same $20M apparel brand, lifting store-credit share by 7 percentage points of returns and assuming 70% of that credit gets redeemed inside 90 days drops the net refund rate by roughly 1.2 percentage points and pulls forward cash.
Lever three: returnless refund as default for low-value items. Use it where reverse-logistics cost exceeds the item value (typically anything under $15 in apparel, under $25 in home). The customer keeps the item, the brand keeps the inbound freight savings. This does not reduce the cash refund; it reduces the inventory write-off and the operating cost line.
Worked example using Chart 1 numbers. An apparel brand running 25% returns and a refund rate of 17.5%. Implement all three levers: exchanges up to 30% of returns, store credit up to 15% of returns (assume 70% redeemed inside 90 days), returnless on the bottom 5% of orders by value. New refund rate lands around 13-14% of orders. On $30M revenue, that is roughly $1.0M to $1.4M of refund cash not going out the door annually.
Refund rate is the number that matters for cash. Return rate is the number that matters for product. Operators that only run one of them in the P&L are leaving 3 to 5 percentage points of refund cash on the table every quarter that returns software is built to capture.
Sources and methodology
NRF 2025 Retail Returns Landscape. National Retail Federation annual release, December 2025. Headline figures used: overall US retail return rate 15.8% of sales, ecommerce return rate 19.3% of online sales. NRF reshuffles report paths occasionally; the canonical landing page is at nrf.com/research/2025-retail-returns-landscape.
Loop Returns 2025 State of Ecommerce Returns. Loop's annual disposition and policy report, published Q1 2025. Headline used: 56% of apparel and footwear brands experienced return rates at or above 30%. Loop's network skews to mid-market Shopify DTC, so the figure is biased toward fashion. Disposition splits used qualitatively, not as primary statistics.
US Census Monthly Retail Trade Survey, NAICS 4541 (electronic shopping and mail-order houses). Seasonally adjusted monthly retail sales, January 2025 through March 2026, pulled from the Census MRTS time series. Used to build the implied monthly refund-cash-outflow series (NAICS 4541 sales by 19.3% return rate by 0.70 refund share, divided by 1,000 to get $B).
SEC EDGAR ASC 606 refund-liability disclosures. Full-text searched 10-K and 10-Q filings from January 2024 through May 2026 for "refund liability" and "right-of-return asset" against public DTC and ecommerce issuers. Revolve Group's Q1 2026 10-Q used as the worked example ($81.8M current refund liability). The analytical proxy used is refund liability divided by trailing twelve-month net sales; this is a balance-sheet snapshot, not a measured cash refund flow.
Refund-share assumptions. The refund-share column in the by-vertical table is anchored on Loop, Narvar, and Optoro disposition patterns described qualitatively in their reports. Assumptions used: apparel 0.70, footwear 0.67, beauty 0.80, electronics 0.65, home and lifestyle 0.75, furniture 0.77. These are defensible against the disposition mix in Table 2 but are not citable to a single primary published statistic. The refund-rate column is therefore an Eightx 2026 estimate, not a published industry figure.
Limitations. The vertical disposition splits in Chart 2 and Table 2 are directional industry estimates synthesized from returns-platform reports, not primary statistics. The NAICS 4541 series captures pure-play ecommerce retailers and excludes the ecommerce slice of brick-and-click retailers (Target, Best Buy ecommerce). Refund liability under ASC 606 is an estimated future obligation, not measured cash refunds processed. This post is a living index, refreshed each quarter when NRF, Loop, and the next round of DTC 10-Ks land.
Frequently asked questions
what's the difference between return rate and refund rate in ecommerce?
Return rate is the share of orders that come back. Refund rate is the share of orders that end with cash going out the door. The gap is exchanges, store credit, and returnless write-offs. For an apparel brand running 25% returns, the refund rate is usually closer to 17-18% because Loop-style flows route 25-35% of returns into exchanges or credit.
what's the average refund rate for an ecommerce store in 2026?
There is no single number because it splits hard by vertical. Apparel and footwear sit at 17.5-18.5% of orders. Beauty and electronics sit at 6.4-7.2%. Home and furniture run 9-17%. The blended US ecommerce figure (NRF 19.3% return rate, 70% cash refund share) is roughly 13.5% of orders as a cross-vertical benchmark.
how do i calculate my refund rate vs my return rate from shopify?
Return rate equals orders returned divided by orders shipped over the same window. Refund rate equals orders with a cash refund divided by orders shipped over the same window. Pull a 12-week trailing window in Shopify, count the orders that have a refund attached, and divide by gross orders. If your return rate is 25% and your refund rate is 10%, your returns software is doing real work. If they are equal, you have no disposition routing in place.
what's a normal apparel refund rate if my return rate is 25%?
Around 17-18% of orders as a cash refund. The remaining 7-8 percentage points of returns get absorbed by exchanges (roughly 22% of returns) and store credit (about 8%). Loop's network data and Narvar's State of Returns both point at this range for mid-market apparel DTC running modern returns flows.
is returnless refund considered a cash refund on the p&l?
Yes. Returnless refund still hits cash. The customer gets their money back; the item is just written off rather than physically returned. The savings sit in reverse logistics (no inbound freight, no restock, no inspection), not in cash retention. Beauty and home brands lean into returnless because the per-return processing cost would exceed the salvage value of the item.
where does refund liability show up on a 10-K and how do i interpret it for my brand?
Under ASC 606, public issuers report a 'refund liability' (current liability) and a paired 'right-of-return asset' (current asset). It is the estimated future refund obligation against the trailing period's sales, not the cash refunds actually processed. Revolve disclosed $81.8M of refund liability in its Q1 2026 10-Q. For a private brand the same logic applies: an end-of-period accrual for orders shipped but expected to come back.
why is my beauty refund rate higher than my return rate would predict?
Because beauty returns convert to returnless refund at the highest rate of any vertical (around 18% of returns). Hygiene rules block restock and reverse logistics cost more than the item. If your return rate is 8% but your refund rate is closer to 6.5-7%, that gap is the returnless share doing its job. The cash leaves but the inventory write-off is the bigger P&L line.
if i tighten my return policy will my refund rate drop or just shift to chargebacks?
Both, in measurable amounts. Tightening cuts the marginal refund (the customer who would have returned for fit or buyer's remorse) but it lifts chargeback risk on the customer who feels stonewalled. Operators we have seen tighten apparel policies kept the refund-rate cut but lost 1-3% of repeat purchase volume. Net cash impact is usually positive at first and gets worse over 6-12 months as the LTV hit lands.