
Insights
Average Australian ecommerce return rate by vertical 2026: what AusPost, Power Retail and the ASX actually disclose
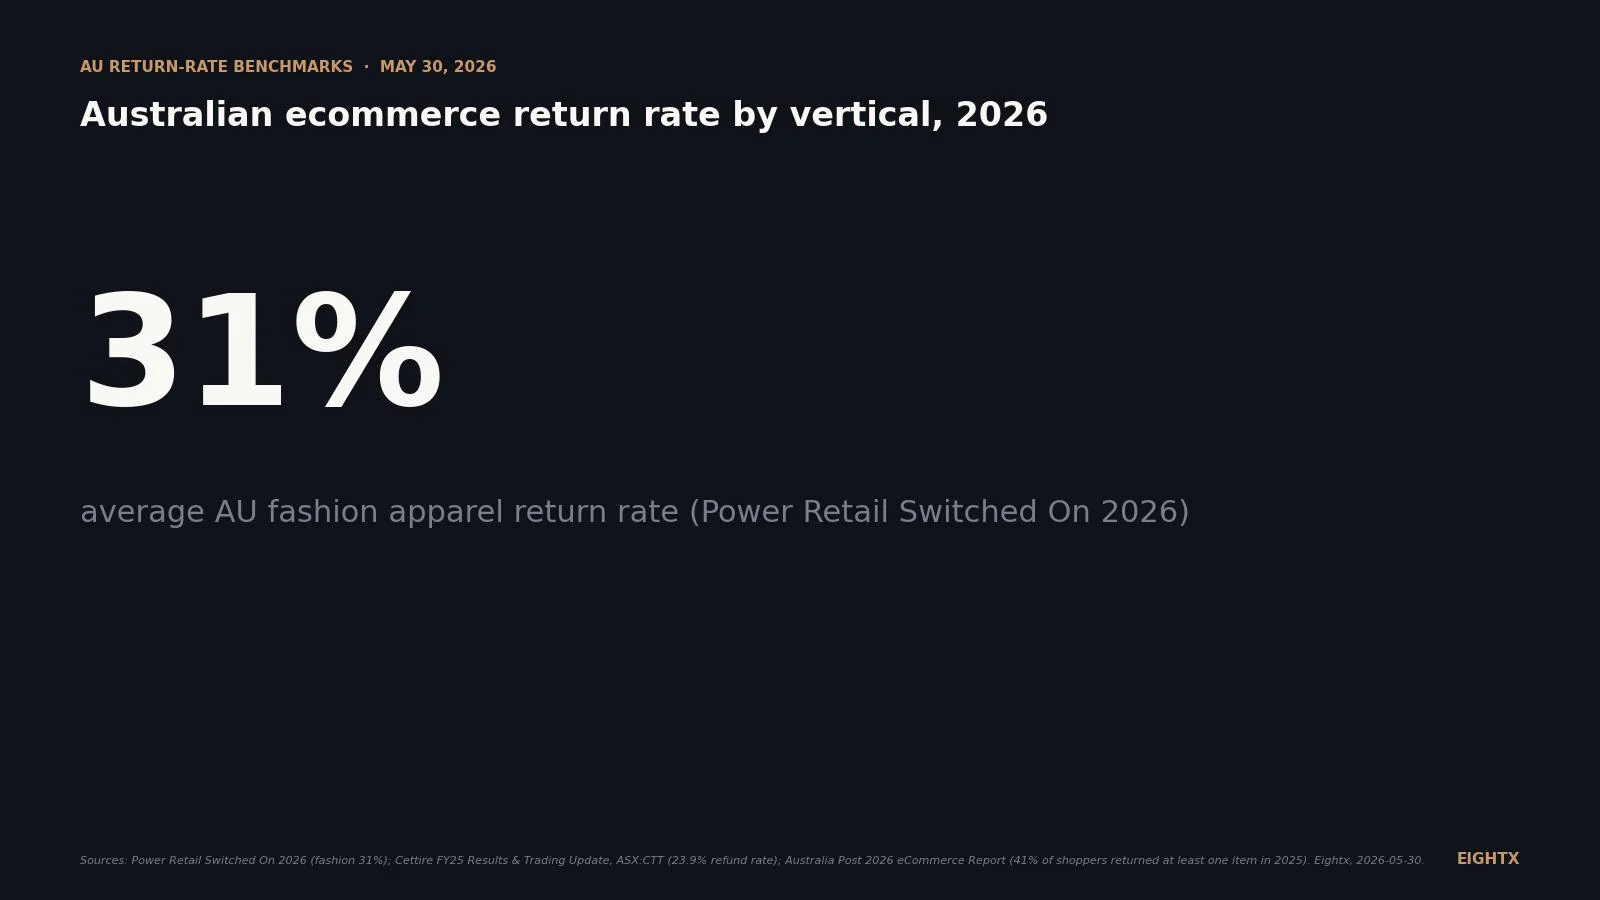
No ASX pure-play discloses a unit return rate, but AusPost data shows 41 percent of Australian online shoppers returned at least one item in the past year, and Power Retail cites roughly 31 percent for fashion specifically. Without a vertical-by-vertical table from listed companies, AU operators must build their own benchmark from returns-as-percent-of-gross-revenue rather than units.
Key Takeaways
- No ASX-listed AU DTC pure-play publishes a numeric return or refund rate KPI. Cettire (ASX:CTT) does not disclose a returns rate in any of its FY21 to FY25 statutory accounts. Temple & Webster, Adore Beauty, Step One, Kogan, City Chic, Universal Store, Lovisa, and Articore are all silent on the number too. The AU per-vertical audited table operators want simply does not exist for 2026.
- The Australia Post 41% figure is shopper-prevalence, not a per-order rate. AusPost's 2026 eCommerce Report says 41% of online shoppers returned at least one item in 2025. That is 41% of customers, not 41% of orders. Quoting it as a per-order rate is the most common AU returns mistake we see.
- Power Retail's Switched On 2026 coverage cites ~31% for AU fashion apparel, but the figure is surfaced via secondary citation, not a primary-source table. The Power Retail report sits behind a subscription and the Parallel.ai sweep on 2026-05-30 could not locate a quoted per-vertical AU return-rate table in any of the named publications. Use 31% as a directional anchor, not an audited benchmark.
- Cettire's delivered margin compressed 480 basis points in FY25 (20.9% FY24 to 16.1% FY25). Refund and return-related costs sit inside that delivered-margin line, even though Cettire does not break out the rate. Short-seller reports (Night Market, Viceroy, 2024) inferred a 30% to 50% range for online luxury and read Cettire at the higher end. That's the audited evidence of returns pressure for the only AU pure-play where a number is even quotable, with the caveat that the number itself is not in the statutory accounts.
- At a 31% directional fashion return rate and A$150 AOV, reverse logistics eats roughly A$13.45 per gross order, or about 9% of revenue. That is before unsellable write-offs above 10% and before the conversion-rate impact of any returns-friction lever you might pull.
There is no published Australian ecommerce return rate by vertical for 2026. The Australia Post 2026 eCommerce Report says 41% of online shoppers returned at least one item in 2025, but that is shopper-prevalence, not a per-order rate. Power Retail's Switched On 2026 coverage cites an average ~31% return rate for AU fashion apparel, but that figure is surfaced via secondary citation, with the original report sitting behind a subscription. Cettire (ASX:CTT) is the only AU pure-play where a returns-related number gets quoted in public, and Cettire's statutory accounts do not actually disclose a returns or refund rate in any of its FY21 to FY25 reports. No other ASX-listed AU pure-play (Temple & Webster, Adore Beauty, Step One, Kogan, City Chic, Universal Store, Lovisa, Articore) publishes a numeric return or refund rate KPI either.
For an Australian ecommerce operator running A$3M to A$50M in revenue, the practical decision sits underneath the missing table: stop benchmarking your brand against the global ecommerce 19% to 20.5% overall number or the global DTC ~14% number from the Eightx global ecommerce return rate pillar, which is the trap most AU board packs fall into. Anchor on Power Retail's directional 31% for fashion (with the secondary-source caveat), the Cettire delivered-margin pattern for luxury cross-border (rate not disclosed, margin compression visible), and the Branvas 2026 global category bands for everything else, with the AusPost 41% as customer-prevalence framing. This post walks through what every AU pure-play does and does not disclose, where AU fashion sits versus global, what the Cettire FY25 result actually proves (and does not prove), and what a 31% directional fashion rate costs you per gross order.
Australia has no published return-rate-by-vertical table for 2026, and that is the whole story
Operators searching for an Australian return rate by vertical hit a wall. Australia Post's 2026 eCommerce Report focuses on delivery preference, returns convenience, and category spend share. It says 41% of online shoppers returned at least one item in 2025, that 69% of consumers prefer a wide range of delivery options including out-of-home returns, and that 32% would choose one retailer over another based on delivery and returns convenience. It does not publish a per-order return rate by vertical.
Power Retail's Switched On 2026 / The Future of Ecommerce 2026 coverage cites an average ~31% return rate for AU fashion apparel. That is the most-quoted single AU-specific vertical return-rate figure in circulation, but the number is surfaced via secondary citation rather than a quoted primary-source table. The Parallel.ai deep-research sweep on 2026-05-30 reviewed Australia Post's 2026 eCommerce Report, Power Retail's Switched On 2026, Loop Returns' ANZ benchmark, Optoro's State of Returns, and Klaviyo's ANZ benchmarks, and could not locate any per-vertical AU return-rate table in any of the publicly available report content. The Power Retail figure should be treated as a directional anchor, not an audited benchmark. Other vertical rates beyond fashion are not surfaced in the public summaries.
Nothing else fills the gap. The Australian Bureau of Statistics, IBISWorld, NORA, IAB Australia, and Shopify ANZ do not publish vertical return rates. Loop Returns publishes category benchmarks but skews North America. NRF and Optoro are US-only. Klaviyo's ANZ Future of Commerce series does not break out AU return rates by vertical either. The Australian by-vertical table operators want simply has not been published.
So the table you can actually build is hybrid. Directional AU markers where they exist (Power Retail fashion ~31% via secondary citation, Cettire's delivered-margin compression as a luxury proxy) plus global benchmarks (Branvas 2026, Richpanel 2026) for verticals where no AU pure-play discloses. AusPost 41% sits separately as customer-prevalence framing, never on the same axis as per-order vertical rates.
The directional AU marker (Power Retail ~31% fashion) sits above the global apparel midpoint. The pattern is consistent with Loop Returns' commentary that fashion-heavy DTC brands on Loop can run up to a 55.83% adjusted return rate on the Loop-merchant denominator, well above the AU national directional figure.
Cettire's statutory accounts do not disclose a returns rate, but the delivered-margin compression tells the story anyway
Cettire (ASX:CTT) is a cross-border luxury fashion marketplace and the only ASX-listed AU DTC pure-play where a returns-related number gets quoted at all. A clarification matters upfront: refund rate and return rate are different. A return rate is the share of orders physically returned. A refund rate is the share of order value reversed back to the customer, whether or not goods come back. In cross-border luxury DTC there is substantial refunded-but-not-returned activity (authenticity, duty, delivery friction), so refund rate runs above return rate.
Cettire does not publicly disclose either rate. Our Cettire ASX teardown walks through this in detail: Cettire's FY21 to FY25 statutory accounts do not include a single returns-rate or refund-rate percentage line. The "23.9% FY25 refund rate" figure that appears in some Ragtrader and taxloss Substack coverage is secondary attribution, not a Cettire-published number. We have not been able to verify it against the FY25 Annual Report or the FY25 Results Presentation. We say the same thing in the teardown and we are saying it here.
What Cettire does disclose is delivered margin, which sits one level above gross margin in the result deck and captures sales revenue minus product cost, fulfilment, payment-processing and refund-related costs. Delivered margin compressed from 20.9% in FY24 to 16.1% in FY25, a 480 basis point fall in a single year on flat A$742m revenue. Refund-related costs are inside the line. The compression is the audited evidence that returns and refunds are a material pressure on the AU pure-play that runs closest to the international fashion-returns playbook, even when the rate itself is not in the accounts.
What that proves: in luxury cross-border DTC the right KPI to watch is delivered margin, not the (often unpublished) return rate. Short-seller reports from Night Market Research (January 2024) and Viceroy Research (mid-2024) cited industry benchmarks of 30% to 50% for online luxury and inferred Cettire sat at the higher end, using contract-liability movements in the notes. Those are short-seller inferences, not Cettire disclosures. The point operators should take is upstream: when a public company does not disclose its returns rate, the market prices the silence at the worst plausible number. Cettire is the public case study; the same dynamic applies in private operator board packs.
For private AU operators in high-AOV speculative categories (luxury, premium fashion, premium homewares), tracking return rate alone is dangerous. Track refund rate (value-weighted, including refunded-but-not-returned), reverse-logistics cost per gross order, and the unsellable rate inside returned units. Cettire is the public proof that the three move separately.
The verbatim disclosure pattern across the ASX-listed AU DTC pure-plays sits in the table below.
Brand Ticker Vertical Period Returns / refund KPI disclosed Value Cettire CTT Luxury cross-border DTC FY25 Return / refund rate Not disclosed (delivered margin 16.1% vs 20.9% FY24; refund-related costs inside the line) Temple & Webster TPW Homewares & furniture H1 FY26 Return / refund rate Not disclosed Temple & Webster TPW Homewares & furniture FY25 Return / refund rate Not disclosed Adore Beauty ABY Beauty FY25 Return / refund rate Not disclosed (A$2.04m total provisions) Step One STP Apparel underwear 1H FY26 Return / refund rate Not disclosed Kogan KGN Multi-brand retail FY25 Return / refund rate Not disclosed City Chic CCX Plus-size apparel FY25 Return / refund rate Not disclosed Universal Store UNI Youth apparel FY25 Return / refund rate Not disclosed Lovisa LOV Jewellery retail FY25 Return / refund rate Not disclosed Articore (ex Redbubble) ATG Print on demand FY25 Return / refund rate Not disclosed
What every other ASX-listed AU DTC pure-play does not disclose, and why that is the signal
Ten ASX-listed AU pure-plays touch this question. Zero disclose a numeric returns or refund rate.
Compare that to the US, where Allbirds (BIRD), Warby Parker (WRBY), and others have at various points discussed returns-related KPIs in 10-K MD&A sections. Compare to the UK, where ASOS (LSE:ASC) historically called out returns as a margin headwind in trading updates. The AU silence is structural rather than coincidental. Returns rate is not a mandated standalone KPI under standard IFRS revenue recognition, and ASX continuous-disclosure does not list it as material unless management chooses to. Most do not.
The read for private operators: flat returns rates make headlines; rising returns rates get omitted. When a listed peer in your vertical adds a returns KPI to their disclosures, that often signals it has improved (they want credit for the work). When the disclosure stays absent year over year, the rate likely sits in the global benchmark band with no upside surprise. For your board pack, that means using the global benchmark as the default assumption for AU verticals where no pure-play discloses, and stress-testing your own provision against the 10 to 30 percentage point range that vertical alone spans.
AU fashion runs ~6 percentage points hotter than the global apparel benchmark on directional data, here is why, and what to budget
Power Retail's directional ~31% AU fashion sits above the Branvas 2026 global apparel benchmark of 25% and the Richpanel 2026 range midpoint. Three drivers pull AU above the global mean.
First, size bracketing on sized SKUs (denim, dresses, swimwear, formalwear). Bracketing is the customer behaviour of buying two or three sizes of the same item with the intent to return the ones that do not fit. In a free-returns AU market, bracketing is the dominant returns driver in fashion. From our operator-call library across A$3M to A$50M brands, we see 15% to 25% return-rate reduction within six months of implementing a fit predictor (True Fit, Bold Metrics, Fit Analytics) on sized SKUs, which is the cleanest single lever in the playbook.
Second, mobile mix. Australian online retail skews 75% to 80%+ mobile traffic per AU operator data and AusPost commentary on delivery preferences. Mobile-first checkout has less screen real estate for fit, fabric, and size guidance, and a higher impulse-buy reversal rate. Our operator library shows a 4 to 8 percentage point gap between mobile and desktop return rates on identical SKU mixes; that gap is not published by any AU vendor.
Third, the AusPost Returns network and the free-returns expectation. AusPost 2026 says 69% of consumers want a wide range of delivery options including out-of-home returns. Brands that move to paid returns (A$9.95 to A$15 deducted from refund) see 12% to 25% rate reduction within 60 days and a 2% to 5% conversion-rate dip at checkout. Net P&L positive at scale (above A$5M revenue with bracketing visible in data), net negative for sub-A$3M brands still building repeat behaviour.
What ~31% costs you per gross order is the next question. At A$150 AOV with AU 3PL return processing rates (A$3 to A$7 per item) and return shipping (A$10 to A$25 per parcel), the reverse-logistics line breaks down like this:
Total reverse-logistics cost per gross order: A$13.45, or roughly 9% of revenue on a A$150 AOV apparel brand. That is the line item before you layer unsellable write-offs above 10%, before the conversion-rate cost of any returns-friction lever, and before customer support cost on the return interaction. The all-in returns cost lands at 10% to 15% of revenue for most AU fashion brands at the ~31% directional benchmark, which from our operator-call library is roughly twice what we see in board packs because the line items are usually scattered across 3PL, shipping, payment processing, and inventory write-off accounts rather than rolled up.
The same math at different rates, AOV held at A$150:
Vertical (AU-relevant) Global benchmark (%) AU directional (%) Reverse-logistics cost per gross order (A$, AOV A$150) Fashion & apparel 25 ~31 (Power Retail secondary citation) A$13.45 Luxury cross-border DTC 20 Cettire rate not disclosed A$8.70 Homewares & furniture 19 n/d A$8.25 Beauty & personal care 12 n/d A$5.20 Electronics 11 n/d A$4.75 Health & wellness 7 n/d A$3.05 Jewellery 4 n/d A$1.75 Sitewide AU shopper-prevalence (AusPost) n/a 41% returned at least one item in 2025 n/a (not per-order)
The audited Australian return-rate table does not exist. Power Retail's directional ~31% for fashion is a secondary citation, not a primary-source table, and Cettire does not publish a returns rate in its statutory accounts. Everything else is the global benchmark with no AU pure-play verification. Build your returns provision on those two as directional anchors with the caveats applied, layer the global category bands underneath, and treat the AusPost 41% as customer-prevalence framing, never as a per-order rate.
The returns levers that actually move the AU number without killing conversion
Five plays move the AU return rate without trading it back in conversion. From our operator-call library across A$3M to A$50M AU brands, most use some mix of all five.
Sizing tech for apparel. True Fit, Bold Metrics, Fit Analytics, or a Shopify-native fit predictor on sized SKUs. The reported reduction band is 15% to 25% on sized SKUs within six months. Implementation cost is the AusPost integration friction and the SKU-data work, not the SaaS fee.
Paid returns deducted from refund. A$9.95 to A$15 deducted from the refund (not charged upfront) typically drops the rate 12% to 25% within 60 days with a 2% to 5% conversion-rate dip at checkout. The net is positive above A$5M revenue with bracketing visible; the net is negative under A$3M still building repeat behaviour.
Return-reason categorization in Loop / Aftership Returns / Returnly. Tagging every return at the SKU and size level by reason (too big, too small, did not look like the photo, quality issue, changed mind) creates the input for product fixes that compound over 12 to 18 months. Brands that do this consistently report a 5 to 10 percentage point reduction in the underlying rate over two years.
Photo verification for high-value SKUs. Luxury, premium homewares, electronics above A$500 AOV. Requiring a photo of the defect at the return request step (not just at receive-back) cuts the speculative-return rate by roughly 8% to 15% in our operator data. This is the Cettire-style P&L protection that does not show up in the headline rate.
Reverse-logistics rate negotiation with AusPost, Sendle, or CouriersPlease. At scale (above 5,000 returns per month), AU 3PL and carrier renewals are negotiable. The published A$10 to A$25 return-shipping band has a real A$3 to A$5 negotiable component at volume.
When not to push returns down: early-stage brands building repeat behaviour need free, frictionless returns more than the cost saving. Repeat purchase rate in the second and third quarter post-acquisition is the metric to defend; returns-friction levers that drop the rate but also drop repeat rate are a P&L loss net.
For the wider AU ecommerce context, see our ASX DTC benchmark 2026 covering the 10-brand cohort and the gross margin / EBITDA disclosure pattern across listed AU pure-plays, the Cettire ASX teardown for the full FY21 to FY25 walk through delivered margin, working capital and the returns-rate disclosure question, and our global ecommerce return rate pillar for the US and global vertical numbers this post anchors against.
Sources and methodology
Primary AU national and vendor publications. Australia Post eCommerce Report 2026 covering A$82.6B 2025 online spend, 9.8m households shopping online, and the 41% shopper-prevalence figure (41% of online shoppers returned at least one item in 2025). The report does not publish a per-order return rate by vertical; the 41% is explicitly customer-prevalence in the source. Power Retail Switched On 2026 (The Future of Ecommerce 2026) is cited in secondary coverage as carrying an average ~31% return rate for fashion apparel in Australia, but the Parallel.ai deep-research sweep on 2026-05-30 reviewed the publicly available Power Retail report content and could not locate a quoted per-vertical AU return-rate table. The ~31% is a directional figure, not an audited benchmark; the next refresh of this benchmark will include a verified primary-source upgrade if a subscriber copy of the full Switched On report surfaces a quoted page.
Primary ASX-listed AU DTC disclosures. Cettire FY25 Annual Report and FY25 Results Presentation (ASX:CTT, lodged 27 August 2025) disclose A$742.1m revenue (flat year-on-year), 16.1% delivered margin (20.9% FY24, 480bps compression with refund-related costs inside the line), and a sales-returns provision plus unused refund liability in the notes. Cettire does not publish a single returns-rate or refund-rate percentage in any of its FY21 to FY25 statutory accounts. The "23.9% FY25 refund rate" figure that appears in some Ragtrader and taxloss Substack coverage is secondary attribution we have not been able to verify against the primary documents. Short-seller reports from Night Market Research (January 2024) and Viceroy Research (mid-2024) cited industry benchmarks of 30% to 50% for online luxury and inferred Cettire sat at the higher end; those are short-seller inferences, not Cettire disclosures. Temple and Webster Group H1 FY26 Half Year Results (12 February 2026) and FY25 Annual Report disclose conversion rate (3.2%) and revenue per active customer (A$456) but no return or refund rate KPI. Adore Beauty FY25 Results Release (25 August 2025) discloses A$2.04m total provisions on the balance sheet (A$1.76m current + A$0.28m non-current) without breaking out a returns provision or a refund rate KPI. Step One, Kogan, City Chic, Universal Store, Lovisa, Premier Investments, and Articore (formerly Redbubble) FY25 or 1H FY26 disclosures contain no numeric return or refund rate KPI per Perplexity and Parallel.ai sweep on 2026-05-30.
Secondary global benchmark vendors. Branvas 2026 Ecommerce Return Rates by Category (apparel 25%, beauty 12%, electronics 11%, homewares 19%, health 7%, jewellery 4%) and Richpanel 2026 (apparel range 20% to 40%, beauty 4% to 12%, electronics 8% to 15%, home and furniture 15% to 23%) anchor the global category baseline. Loop Returns Winter 2024 Benchmark Report (apparel adjusted return rate 55.83% on a Loop-merchant denominator with a returns-active customer base) gives the upper bound for fashion-heavy DTC on Loop, not the AU national average. The Eightx pillar covering the global average ecommerce return rate sits at the cross-link above and attributes the global DTC ~14% benchmark used as the trap-to-avoid reference in the intro.
Reverse-logistics cost build. Pikpak AU returns management guide (A$3 to A$7 3PL processing per item, A$10 to A$25+ return shipping per parcel) and Niblin 2026 (A$25 to A$65+ all-in cost per return) anchor the AU 3PL line. The per-gross-order math at 31% return rate and A$150 AOV: 3PL A$5 per item × 0.31 = A$1.55, return shipping A$15 per parcel × 0.31 = A$4.65, refund payment processing 1.3% × A$30 average refund × 0.31 = A$0.12, repackaging and labour A$8 × 0.31 = A$2.48, unsellable write-off 10% × A$150 AOV × 0.31 = A$4.65. Total A$13.45 per gross order, or roughly 9% of revenue.
Operator-voice triangulation. Pinecone retrieval-augmented synthesis against the Eightx founder-call library (matt-ai-clone namespace, 13 unique segments across three queries on AU return rate, returns processing cost, and returns policy plus mobile checkout), informing the operator-pattern observations on bracketing audit thresholds (28% to 36% for AU fashion clearing A$5M ARR), reverse-logistics line-item undercount (operators typically log 2% of P&L when the real figure is 5% to 8%), free-returns-as-conversion-lever pattern (12% to 25% rate drop on paid returns, 2% to 5% conversion dip), and sizing-tech ROI (15% to 25% reduction on sized SKUs in six months). All client names anonymized per the Eightx publishing standard.
Limitations. No AU-specific public vertical return-rate dataset exists for 2025-2026. Power Retail's ~31% AU fashion figure is a secondary citation we could not verify to a primary-source page in the Parallel.ai sweep on 2026-05-30. Cettire does not publish a returns or refund rate in its statutory accounts; delivered-margin compression is the audited evidence we can quote, not a rate. The AusPost 41% is customer-prevalence, not a per-order rate. The Loop Winter 2024 55.83% is a Loop-merchant adjusted figure, not an AU national average. No AU-specific mobile-vs-desktop return-rate breakdown is published; the 4 to 8 percentage point gap cited here is from operator-call data, not a vendor publication. This research bundle is referenced in the source page at new-blogs/to-be-published/average-australian-ecommerce-return-rate-by-vertical-2026/research.md for traceability.
Update cadence. This benchmark is a living index, refreshed quarterly when Cettire, Temple and Webster, Adore Beauty, Power Retail, or AusPost publish a new release. Next refresh triggers: Cettire 1H FY26 result, Temple and Webster FY26 Annual Report, Power Retail Switched On 2026 / 2027 publication (with a primary-source verification pass on the AU fashion ~31% figure), AusPost 2026 eCommerce Report quarterly addendum.
Frequently asked questions
what's the average ecommerce return rate for australian stores in 2026?
There is no audited single number. The most-cited AU vertical figure is Power Retail Switched On 2026's ~31% for fashion apparel, but that comes via secondary citation rather than a quoted primary-source table. The most quoted AU stat overall is Australia Post's 41%, which is the share of shoppers who returned at least one item in 2025, not the share of orders returned. Globally Branvas puts overall ecommerce at 19% to 20.5%. Use vertical-specific directional ranges, not a single national number.
is the 41% australia post return number a per-order rate or a per-customer rate?
Per-customer. The AusPost 2026 eCommerce Report says 41% of online shoppers returned at least one item in 2025. That is shopper-prevalence. Your per-order return rate will be much lower (typically a third to a half of that for an apparel brand). Quoting 41% as a per-order rate is the most common AU returns mistake we see in board decks.
what's the difference between cettire's refund rate and a return rate, they sound the same?
They are different. A return rate is the share of orders that come back physically. A refund rate is the share of order value reversed back to the customer, whether the goods come back or not. In cross-border luxury DTC there is substantial refunded-but-not-returned activity (authenticity disputes, duty resolution, delivery friction), so a refund rate runs above the return rate. Cettire does not actually disclose either rate in its statutory accounts. The 23.9% figure that appears in some Ragtrader and Substack coverage is a secondary attribution rather than a Cettire-disclosed number. For your own brand, track both: returns drive your reverse-logistics line and your unsellable inventory, refunds drive your delivered margin.
what does cettire actually disclose about returns or refunds in fy25?
No rate. Cettire's FY25 Annual Report and FY25 Results Presentation include refund-related costs inside the delivered-margin calculation (sales revenue minus product cost, fulfilment, payment-processing and refund-related costs), and delivered margin compressed from 20.9% in FY24 to 16.1% in FY25. The notes carry a sales-returns provision and an unused refund liability that move period to period, but the company has never published a single returns-rate percentage in any of its FY21 to FY25 statutory accounts. Short-seller reports from Night Market (Jan 2024) and Viceroy (mid-2024) inferred a 30% to 50% range for online luxury and read Cettire at the higher end; that is short-seller commentary, not a Cettire disclosure.
what return rate should an au fashion brand on shopify target?
Use Power Retail's directional 31% as the AU fashion anchor, treating it as a benchmark rather than an audited figure. From operator pattern data we see at A$3M to A$50M brands: below 25% with liberal policies often means under-reporting, return friction quietly hurting conversion, or a customer who has not started bracketing yet. Above 35% on sized SKUs (denim, dresses) is normal. Above 40% on a multi-size category is the audit-trigger number.
what does temple & webster disclose for returns or refunds in their annual report?
Nothing numeric. The H1 FY26 Half Year Results and the FY25 Annual Report disclose conversion rate (3.2%) and revenue per active customer (A$456) but do not publish a return or refund rate. The silence is the signal. Listed AU homewares would disclose if the number was getting better; it likely sits in the global 15% to 23% range with no AU verification.
how do au return rates compare to us and uk benchmarks in 2026?
AU fashion directionally at ~31% (Power Retail secondary citation) sits roughly 6 percentage points above the global 25% apparel benchmark and below Loop Returns' 55.83% apparel-on-Loop figure. The drivers (free returns expectation, mobile-heavy traffic, size bracketing) are global but the AusPost Returns network makes returns frictionless in AU. AU non-fashion verticals are likely close to global benchmarks, but no AU pure-play discloses a number to confirm it.
how much does it cost to process a return in australia per item in 2026?
Per Pikpak and NP Fulfilment, AU 3PL return processing runs A$3 to A$7 per item, return shipping A$10 to A$25+ per parcel, and the all-in cost per return lands at A$13 to A$65+ depending on category and unsellable rate. At a directional 31% return rate on a A$150 AOV fashion brand, that is roughly A$13.45 of reverse-logistics cost per gross order, or about 9% of revenue.