
Margins
Footwear vs Apparel Margins: What Is Different in 2026
Footwear and apparel can post nearly identical gross margins, around 60 percent at the premium end (On Holding 62.8 percent, Levi 61.7 percent in FY2025), but they earn it in opposite ways. Footwear concentrates value in fewer high-AOV units carrying tooling cost and a high return rate, while apparel bleeds margin through size-curve markdowns. Read both at contribution margin, not gross.
Key Takeaways
- Gross margin is close at the top: On Holding posted 62.8 percent in FY2025 and Levi Strauss 61.7 percent, so the real gap shows up below the gross line.
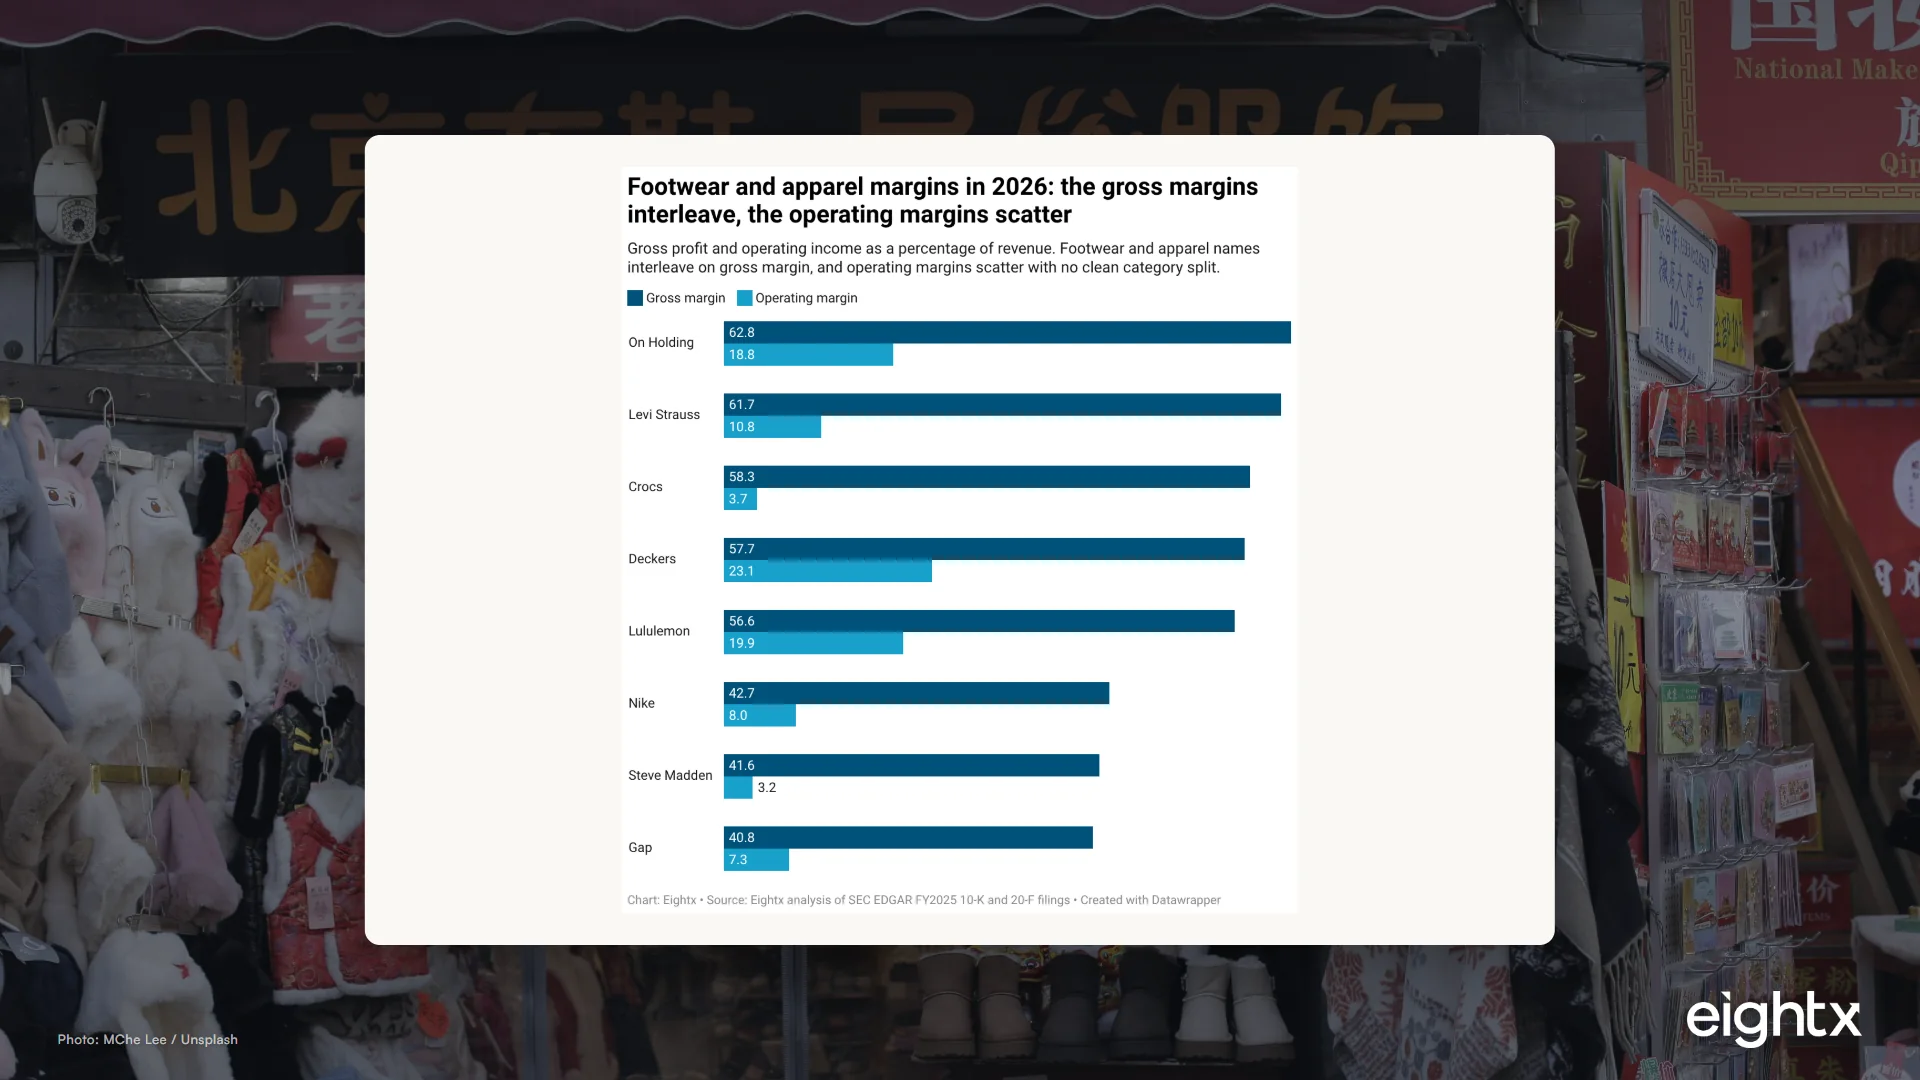
- Footwear and apparel interleave, not separate: in the FY2025 comp set, operating margin runs from Steve Madden at 3.2 percent to Deckers at 23.1 percent, with no clean footwear-versus-apparel split.
- Returns are a subcategory story: within apparel and accessories, shoes are the highest-returning subcategory at 31.4 percent, but they hit fewer, higher-value, often-resalable units.
- Footwear carries real front-loaded cost: tooling runs from roughly $10,000 to $30,000 for open-mold styles up to about $85,000 for a fully tooled custom style, and it must be amortized across the units you actually sell.
- If you run both lines, never read them blended: allocate returns, fulfillment, and development cost by SKU and compare at contribution margin, or one line will quietly subsidize the other.
Founders who sell both shoes and clothing keep asking me the same question: which line actually makes the money? They look at the topline, see footwear pulling a higher average order value (AOV), and assume it is the winner. Then they look at gross margin and see the two lines almost tied. Both reads are incomplete, because footwear and apparel earn their margin in completely different ways, and the difference only shows up once you walk past gross profit to contribution margin.
Here is the short version. Footwear concentrates value into fewer, more expensive units that each carry tooling and mold cost. Apparel spreads value across a size curve that bleeds through markdowns more than through returns alone. The gross margins can look identical on the P&L and still mean two opposite things about how the business behaves. If you run both, you need to count them separately or one line will quietly subsidize the other.
The gross margins are closer than you think
The instinct that footwear is structurally higher margin than apparel does not hold up against the filings. Pull two premium public comps and they land within about a point of each other.
On Holding, the maker of On running shoes, posted a 62.8 percent gross margin for full year 2025 on CHF 3,014.0 million of net sales, filed on Form 20-F. Levi Strauss, the apparel comp, reported FY2025 revenue of $6,282.0 million and gross profit of $3,877.8 million, which is a 61.7 percent gross margin, with operating income of $677.6 million for a 10.8 percent operating margin (FY2025 10-K, SEC EDGAR). That is roughly a one-point gross margin gap between a premium footwear brand and a premium apparel brand.
Widen the comp set and the "footwear is higher margin" story falls apart entirely. The eight public names below interleave on gross margin and scatter on operating margin, with no clean category line between them. The footwear leader on operating margin is Deckers (UGG and HOKA) at 23.1 percent, but right behind it is an apparel name, Lululemon, at 19.9 percent. At the bottom you find two footwear names, Steve Madden at 3.2 percent and Crocs at 3.7 percent, the latter after a HEYDUDE impairment crushed its FY2025 operating line (Crocs ran 24.9 percent the year before).
This is where the operator instinct usually goes wrong. When I talk to founders running a brand with both lines, the thing they keep saying is some version of "footwear has to be the better business, the AOV is double." The chart says the opposite is just as likely. Category does not decide the margin. Construction, channel mix, return discipline, and what you do with the stuff that did not sell decide it. The story is not at the gross line. It is everything below it. The same lesson plays out in other categories, where the channel itself rewrites the math, as in the way supplement economics swing between Amazon and DTC.
Footwear: high AOV, tooling cost, concentrated returns
Footwear's economics are built on fewer, more expensive units. A pair of shoes carries a higher AOV than a t-shirt, which means each unit absorbs more freight, duty, and overhead per dollar of revenue. In the modeling sessions I sit in, operators net shipping at roughly 6 percent and payment processing at 1.5 to 3 percent against the order. The higher the AOV, the smaller those become as a share of revenue. That is footwear's structural advantage, and it is real.
The cost of that advantage sits at the front and the back of the unit. At the front, every new style needs tooling and molds. Open-mold or basic styles can run from roughly $10,000 to $30,000, but a fully tooled custom style, with its own midsole molds, outsole molds, cutting-die sets, shank tooling, and logo molds, can run to about $85,000 before a single pair ships. Cutting dies alone are $3,000 to $5,000 per set. That is a fixed cost per style that has to be amortized across the units you actually sell.
The math is unforgiving at low volume and trivial at high volume. Spread $85,000 across 50,000 pairs and it is $1.70 a pair. Across 200,000 pairs it is $0.43. Across 500,000 pairs it is $0.17 and disappears into the rounding. Launch a style that sells 800 pairs, though, and that same tooling is over $100 a pair. The development burden is a volume problem, not a fixed handicap, which is exactly why footwear punishes brands that launch too many styles and reward the ones that concentrate volume.
At the back, footwear returns more than apparel does, not less, at least within the apparel-and-accessories subcategory set. Shoes carry a 31.4 percent return rate, the highest subcategory in our ecommerce return-rate benchmarks, driven by fit, sizing, and size bracketing online (ordering two sizes to keep one). The saving grace is that a footwear return is one unit going back, often resalable, against a high AOV. The damage is concentrated, not spread. But it only stays resalable if you actually process it. The pattern we see again and again is returned units that sit opened in the warehouse while someone decides whether the best sellers (often up to ten units of a size) go back on the shelf or get liquidated. A footwear return is recoverable margin only if the disposition actually happens.
Apparel: the size curve and the markdown machine
Apparel's problem is not any single number. It is breadth. One style ships across a size curve, XS through XXL, and you have to buy depth in every size before you know which ones sell. The middle sizes clear; the tails sit. What sits gets marked down, and markdown is where apparel margin actually dies, more than returns alone.
Apparel returns run about 25 percent overall, with women's fashion at 27.8 percent in our benchmarks. That is lower than footwear's 31.4 percent subcategory figure, but the unit economics are worse in a subtle way: an apparel return is often a low-AOV unit that has already been opened, may not be resalable at full price, and represents one broken size in a curve you now cannot complete. You do not just lose the return. You strand the rest of the run.
The size-curve problem compounds the more styles you carry. One merchandiser I worked through this with looked at a line of about 100 styles and admitted they could probably cut inventory by $500,000 in a year, because half the styles were not really contributing. The tails do not sell, and you bought depth in them anyway. That dead weight is the real apparel tax, and it shows up as markdown, not as a return.
Markdown is a standing cost in apparel, not an exception. When we've struggled with this with apparel operators, the honest ones describe a clearance event nearly every month to move aged inventory, and some write off aged stock entirely and treat any clearance as incremental. That is the machine: buy a curve, sell the middle, mark down the tails, repeat. This is why getting apparel markdown strategy right matters more than chasing the return rate down, and why the true cost of apparel returns is bigger than the refund line suggests. For a brand serving $5M to $150M operators, a fractional CFO for apparel brands earns the fee just by getting size-curve buying and markdown cadence under control.
Side by side: where the margin really goes
Here is the comparison that matters. Gross margins are close. Returns are higher for footwear at the subcategory level. But contribution margin, what is left after returns, return processing, shipping, and markdowns, tends to land in a similar band for opposite reasons. The table makes the trade-off explicit.
| Driver | Footwear | Apparel |
|---|---|---|
| Premium gross margin | 62.8% (On Holding FY2025) | 61.7% (Levi FY2025) |
| Premium operating margin | 23.1% (Deckers FY2025) | 19.9% (Lululemon FY2025) |
| Return rate | 31.4% (shoes subcategory) | ~25% (women's fashion 27.8%) |
| Return shape | Fewer high-AOV units, often resalable | Many low-AOV units, breaks the size curve |
| Front-loaded cost | Tooling and molds ($10K to $30K open-mold, ~$85K full custom) | Size-curve depth buy across XS to XXL |
| Where margin leaks | Tooling amortization and returns | Markdowns and broken-curve breakage |
The next chart is the conceptual version of the same point. Treat the drag figures as illustrative planning estimates, not reported data: only the starting gross margins are filing-sourced. Footwear starts higher and gives back ground to returns and tooling; apparel starts a touch lower and gives back more to markdowns and broken curves. Both can land in a similar contribution-margin band, which is the whole reason you cannot judge the two lines by gross margin alone.
Two product lines can post the same gross margin and behave like completely different businesses. Footwear hides its cost in tooling and returns; apparel hides it in markdowns and broken size curves. Read them blended and you will never see which one funds the company. Read them at contribution margin and the answer is usually obvious.
What to do about it
If your brand runs both lines, stop reading them blended. Here is the order of operations I use, and it leans on the same contribution-margin framework I walk every founder through.
- Split the P&L by line first. Footwear and apparel get their own revenue, COGS, returns, and fulfillment. A blended gross margin hides which line is carrying you.
- Work down the contribution-margin stack, not just gross profit. Start at CM1 (gross profit), then CM2 (after shipping, payment processing, and commissions), then CM3 (after variable marketing). A healthy CM3 lands somewhere around 20 to 30 percent. If a line cannot get there, no amount of topline fixes it.
- Allocate returns and return processing by SKU, not as a single percent of sales. Footwear's 31.4 percent at high AOV behaves nothing like apparel's 25 percent at low AOV, and the resale-recovery rate differs too.
- Amortize footwear tooling across realistic unit volume, not hoped-for volume. If a style needs 5,000 pairs to bury its mold cost, say so before you commit the buy.
- Track markdown as a named line in apparel, separate from returns. If you cannot see markdown dollars, you cannot manage the thing that actually eats apparel margin.
- Buy apparel depth to the size curve you can sell, not the curve you wish you sold. The tails are where the markdowns come from.
- Compare the two lines at contribution margin, not gross margin. That is the number that tells you which line funds overhead and growth.
The discipline this forces is uncomfortable but useful. More than one operator has reached the blunt conclusion that they were not first-purchase profitable on a blended basis, dialed back ad spend, and acquired fewer customers on purpose. You only get to that decision once you can see contribution margin by line. Apparel especially is just a hard business: even experienced operators get humbled by it. The numbers are the only thing that keep you honest about which line actually deserves the next dollar.
Methodology
Public-company figures come from SEC EDGAR FY2025 filings, with gross margin (gross profit divided by revenue) and operating margin (operating income divided by revenue) computed by hand from the filed line items. Levi Strauss FY2025: revenue $6,282.0 million, gross profit $3,877.8 million (61.7 percent), operating income $677.6 million (10.8 percent), 10-K filed 2026-01-28. Deckers FY2025 (ended 2026-03-31): revenue $5,472.3 million, 57.7 percent gross margin, operating income $1,262.9 million (23.1 percent), 10-K filed 2026-05-22.
On Holding FY2025: net sales CHF 3,014.0 million, gross profit CHF 1,893.6 million (62.8 percent), filed on Form 20-F (accession 0001858985-26-000008). As a foreign private issuer reporting under IFRS in Swiss francs, On's gross margin is comparable but its operating line is not strictly US-GAAP, so the chart shows On's 18.8 percent adjusted EBITDA margin in the operating-margin slot and labels it as such.
Crocs FY2025 operating margin of 3.7 percent reflects a HEYDUDE-related impairment; its FY2024 operating margin was 24.9 percent. We use Deckers, not Crocs, as the clean footwear high-operating-margin exemplar for that reason. Steve Madden's 3.2 percent reflects tariff and sourcing pressure in FY2025 (FY2024 was 9.9 percent). Nike's operating margin is derived as gross profit less total SG&A, which lands near its reported 8 percent range.
Return-rate benchmarks come from Eightx ecommerce return data: shoes 31.4 percent, women's fashion 27.8 percent, fast fashion 28.9 percent, apparel blended around 25 percent. These are subcategory figures within apparel and accessories. Several whole-category 2026 benchmarks instead put footwear overall near 17 to 18 percent and apparel near 24 to 25 percent, so we frame the 31.4 percent as the highest-returning subcategory, not a settled cross-industry fact.
Tooling figures come from Shoemakers Academy: a fully tooled custom style runs to roughly $85,000 in molds and dies, with cutting dies at $3,000 to $5,000 per set, while open-mold styles can be well under $30,000. These are industry and vendor benchmarks, not figures from filings, and the $85,000 case is one well-documented example, not an average. The contribution-margin bridge chart uses illustrative planning estimates, not reported company data, and is labeled as such.
Frequently Asked Questions
do footwear or apparel brands have higher gross margins?
At the premium end they are close. On Holding posted a 62.8 percent gross margin in FY2025 and Levi Strauss 61.7 percent. The real divergence is below the gross line, where footwear carries tooling cost and a high return rate and apparel carries markdowns and size-curve breakage.
is the footwear return rate really higher than apparel, or is it the other way around?
It depends on how you slice it. Within apparel and accessories, shoes are the highest-returning subcategory at 31.4 percent versus apparel around 25 percent. But several whole-category 2026 benchmarks put footwear overall lower, near 17 to 18 percent, and apparel near 24 to 25 percent. The 31.4 percent is a subcategory figure, not a settled cross-industry fact.
what is contribution margin in footwear vs apparel?
Contribution margin is the cents left after you strip every variable cost out of a dollar of revenue: returns, return processing, shipping, payment fees, and markdowns. Footwear often wins on contribution margin when the AOV is high enough to absorb tooling amortization and the return rate. Apparel wins when sizing is tight and markdown discipline is strong.
how much does footwear tooling and mold cost per style?
Open-mold or basic styles can run from roughly $10,000 to $30,000, while a fully tooled custom style with its own midsole molds, outsole molds, cutting dies, and logo molds can run to about $85,000 before production. Cutting dies alone are about $3,000 to $5,000 per set. That cost is fixed per style and has to be amortized across the units you actually sell.
what operating margin do public footwear brands actually run?
It scatters. In FY2025 filings, Deckers ran 23.1 percent and Nike about 8.0 percent, while Steve Madden fell to 3.2 percent under tariff and sourcing pressure and Crocs printed 3.7 percent after a HEYDUDE impairment (its FY2024 was 24.9 percent). There is no single footwear operating margin; construction, channel mix, and one-time charges move it a lot.
why is my brand at 60 percent gross margin but barely profitable?
Because gross margin stops at COGS. The costs that actually decide profit sit below it: returns and return processing, shipping and fulfillment, payment fees, and markdowns on what did not sell. A 60 percent gross margin can collapse to a thin contribution margin once a 30 percent return rate or a standing markdown habit is counted.
should i read footwear and apparel on a blended margin or separately?
Separately, always. A blended gross margin hides which line is carrying the business. Split revenue, COGS, returns, and fulfillment by line, allocate development cost by SKU, and compare the two at contribution margin. Otherwise one line quietly subsidizes the other and you cannot see it.