
Margins
Margin Recovery: How to Fix (or Kill) an Unprofitable Product Line
To fix an unprofitable product line, measure true contribution margin per SKU after COGS, payment, fulfillment, shipping, returns, and marketing. Then run each loser through a fixed order of levers: reprice, re-source COGS, cut shipping and returns, bundle, and only then discontinue. Cut any SKU stuck below 20% CM3 with no strategic reason to keep it.
Key Takeaways
- Measure CM3 per SKU, not blended gross margin. A scalable DTC line runs 20% CM3 or higher; below 10% you are scaling losses (Eightx contribution margin benchmark).
- The work is concentrated: roughly 20% of SKUs drive about 80% of revenue and profit, with a long tail of break-even and loss SKUs hidden behind them. Rank by profit dollars, not revenue.
- Work the levers in order before you cut: reprice, re-source COGS, reduce shipping and returns, then bundle. Discontinue only when a SKU stays below 20% CM3 after real fixes.
- Shipping is often the hidden killer, and it is structural. BLS courier prices are up 38% since January 2022 while diesel fell 27%: the cost is surcharges, not fuel.
- Returns can erase a line on their own. A 25% return rate can cut a SKU's unit contribution margin by up to 70%, and only about 48% of returned items resell at full price.
In 2026 the median DTC net margin is only about 3 to 10%, which means one quietly money-losing product line is enough to swing a brand from profit to loss. Every catalog I audit has at least one. It looks fine in the P&L, the revenue line is growing, and nobody can tell you which SKUs are actually paying the bills. That is the problem. A line is not a number; it is a stack of SKUs with wildly different economics, and the losers hide behind the winners because blended gross margin averages them all together.
Fixing it is not a vibe or a brand decision. It is arithmetic followed by a decision tree. Measure true contribution margin per SKU, find the losers, then run each one through the same ordered set of levers: reprice, re-source, cut shipping and returns, bundle, and only then discontinue. Here is the playbook I use, with the benchmarks and a worked example.
Step 1: measure true contribution margin per SKU
Gross margin is a starting point, not the answer. The number that tells you whether a SKU works is CM3, and most brands never calculate it at the SKU level. Our contribution margin by vertical work lays out the waterfall:
- CM1 = revenue minus COGS minus payment processing. COGS is landed cost: product, packaging, inbound freight.
- CM2 = CM1 minus fulfillment, outbound shipping, and returns.
- CM3 = CM2 minus the variable marketing allocated to that SKU. The truth number.
When I sit with a founder doing a SKU-level profitability pass for the first time, the line that comes up again and again is some version of "I always meant to know, SKU by SKU, which ones are actually profitable after I load in all the cost." Almost nobody has it. The mistake I see in nearly every audit is that shipping, returns, and fulfillment are buried in opex instead of in the per-order waterfall, which makes contribution margin look several points better than it is. The first job is sweeping those costs back into the SKU where they belong. As one operator put it, CM3 "includes pretty much everything, that's true contribution margin," and the only thing separating it from gross profit is the ad spend you allocate to the SKU.
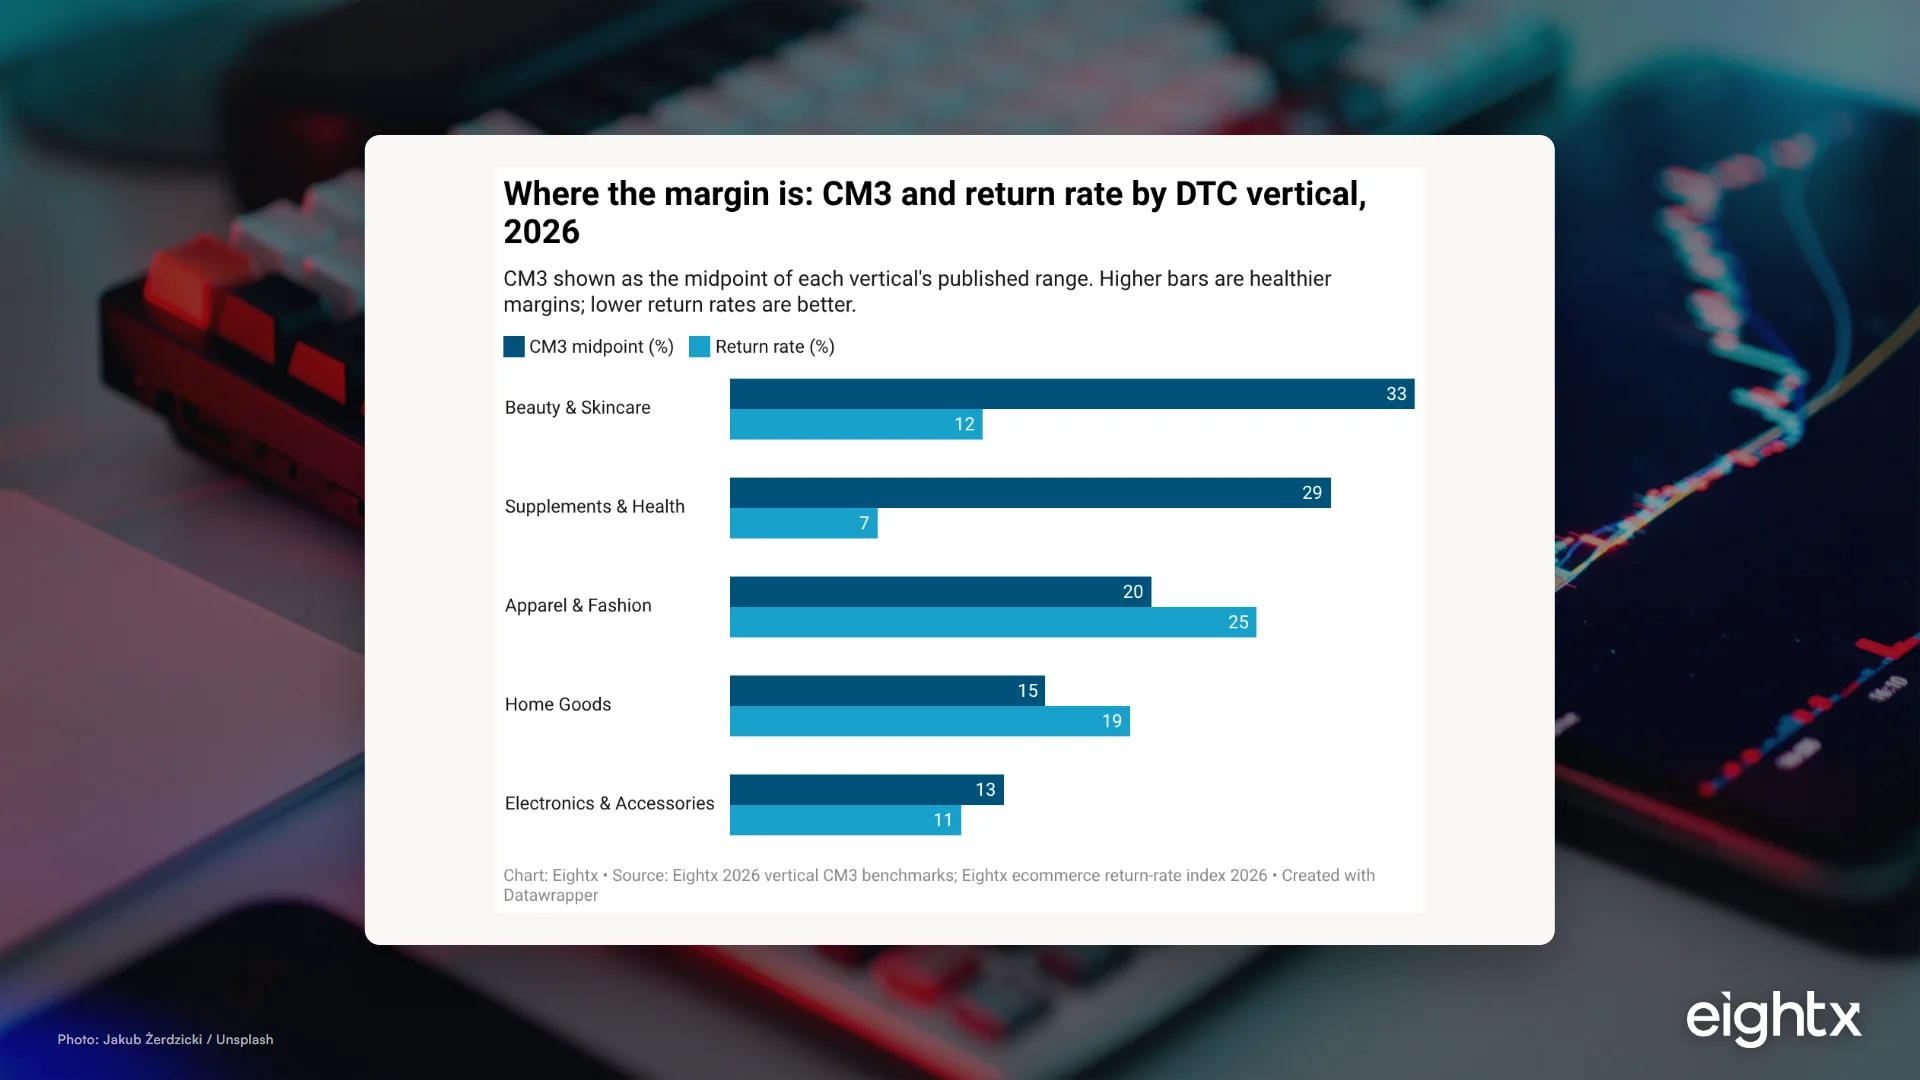
The benchmark that anchors the whole exercise: a scalable DTC line runs 20% CM3 or higher. Below 10% you are scaling losses, not profit (Eightx contribution margin benchmark). The floor is universal, but the healthy range is vertical-specific, running from roughly 8% in electronics to 40% in beauty. That spread is the first clue to where money-losing SKUs tend to hide.
The pattern is clean: beauty and supplements pair the highest contribution margins with the lowest return rates, while apparel and electronics combine thin margins with the highest returns. Within apparel the gap is wider than it looks, the way footwear and apparel margins diverge is a good example of why category averages mislead. And in supplements, channel changes the answer entirely, since the Amazon versus DTC economics for supplement brands can flip a winning SKU into a loser. If you sell in one of those bottom categories, you have less room for error, and a single bad SKU does more damage. Here are the full published ranges.
| Vertical | Typical CM3 (2026) | Avg return rate (2026) |
|---|---|---|
| Beauty & Skincare | 25 to 40% | 12% |
| Supplements & Health | 22 to 35% | 7% |
| Apparel & Fashion | 15 to 25% | 25% |
| Pet Care | 15 to 25% | n/a |
| Food & Beverage | 12 to 22% | n/a |
| Home Goods | 10 to 20% | 19% |
| Electronics & Accessories | 8 to 18% | 11% |
Step 2: rank by profit dollars and find the losers
Once you have CM3 per SKU, rank the line. Do not rank by revenue, rank by contribution dollars, because a high-volume SKU can be a high-volume loser. The distribution is almost always lopsided: a Pareto-style 20% of SKUs drives roughly 80% of revenue and profit, with a long tail of break-even and loss SKUs hiding behind them (SKU rationalization benchmarks, 2025-26). In one cited DTC example, the top 10 SKUs produced 73% of profit. The winners are funding the losers, and your job is to find out by how much.
Here is what a single line looks like once you plot CM3 by SKU.
Two SKUs are negative. The free-shipping loss leader and the high-return variant lose money on every order, and the heavy item at 8% CM3 is below the scaling-losses floor. The hero bundle at 34% is carrying the line. Average the eight together and the blended number looks acceptable, which is exactly how losers stay hidden.
Step 3: the fix-or-cut decision tree
Do not jump to discontinuing. Run every loser through the levers in this order, because each one is cheaper and less destructive than killing the SKU outright:
| Lever | Use it when | Watch out for |
|---|---|---|
| Reprice | Demand is not highly elastic and the SKU has strategic value | Markup vs margin trap (see below) |
| Re-source COGS | The SKU has enough velocity to justify supplier work | MOQs, switching cost, quality risk |
| Cut shipping and returns | Fulfillment friction is erasing the margin | A dim-weight or returns problem you cannot fully fix |
| Bundle | The SKU has low standalone margin but lifts AOV | Bundling two losers does not make a winner |
| Discontinue | Still below 20% CM3 after the above, and not strategic | Write-downs and overhead that does not disappear |
Reprice first. It is the only lever that adds margin with no added cost. A 5 point price increase on a 50% margin SKU is 5 points straight to CM3. But mind the markup versus margin trap: a 50% markup is only a 33% margin, and brands routinely under-price because they confuse the two. When we work with operators running price tests, the ones who win tend to move in small, deliberate steps and watch elasticity rather than guessing. If you are pricing off cost, use the conversion: margin equals markup divided by one plus markup.
Re-source COGS when the SKU has the volume to justify supplier work. The pattern we see again and again is a brand that spent a year or two re-evaluating every supplier to claw back landed cost, fighting MOQ battles the whole way. It is slow, but for top-cluster and hero SKUs a few points of landed cost relief flows straight to the bottom of the waterfall.
Cut shipping and returns when fulfillment is the killer, which it often is. We will come back to why in the next section, because it is the single most underestimated line in the whole waterfall.
Bundle when a SKU has thin standalone margin but can raise AOV or spread shipping cost across a larger basket, especially if it supports a hero product or drives repeat purchase. Just do not bundle two losers and call it strategy.
Discontinue only when a SKU stays below your 20% CM3 target after the fixes above and has no strategic role. And know that cutting is not free: it forces inventory write-downs on remaining stock, and shared overhead does not vanish with the SKU. As one operator framed the trap, "whether I'm selling one unit or ten thousand, I still pay the salaries, the software, all of it." The direct variable cost goes away; the warehouse lease does not. Public DTC brands wrote down about 1.2% of revenue in inventory in 2025, and anything over 3% signals broken SKU discipline.
Why shipping and returns are usually the hidden killers
If a SKU is losing money and you cannot see why, look at fulfillment first. Two things have changed under operators' feet, and both punish low-AOV and heavy SKUs hardest.
The first is that shipping cost is climbing on surcharges, not fuel, which makes it structural rather than cyclical. BLS courier and messenger producer prices rose 38% from January 2022 to April 2026, and warehousing rose 33%, while retail diesel actually fell about 27% over the same window. The fuel input went down and the price went up. That gap is the surcharge signal: residential, dimensional-weight, and peak-season surcharges now make up roughly a third of the average package cost, and the Eightx free shipping index puts them at 51% of one specific 3 pound residential Zone 5 parcel that runs $18.80 all-in.
| Series | Jan 2022 | Apr 2026 | Change |
|---|---|---|---|
| BLS courier & messenger PPI | 289.4 | 399.9 | +38% |
| BLS warehousing & storage PPI | 135.0 | 179.1 | +33% |
| Retail diesel (annual avg, $/gal) | $5.00 (2022) | $3.66 (2025) | -27% |
| Carrier surcharge share of avg package cost | n/a | ~33% (2026) | rising |
Shipping as a share of revenue is the clean early-warning diagnostic, and one of the first numbers I check. The operator version is simple: if a brand usually spends about 10% of AOV on shipping and a given month jumps to 20%, go ask the carrier what changed. Strong is under 8% of revenue, average is 8 to 12%, 12 to 18% needs work, and over 18% is problematic. Many brands overpay by about 4 points versus optimized peers, which is pure recoverable margin.
The second killer is returns. The 2026 average return rate sits at 19 to 20.5%, but apparel runs near 25%, and the math is brutal: a 25% return rate can cut a SKU's unit contribution margin by up to 70%. Processing a return costs $20 to $35 for apparel and $15 to $25 for home and electronics, and only about 48% of returned items resell at full price. Before you discontinue a returns-heavy SKU, attack the rate with better sizing content and sharper photography. It is often cheaper than the cut.
A losing SKU is rarely losing for a mysterious reason. Nine times out of ten it is a low-AOV item absorbing a full parcel cost that has quietly inflated on surcharges, or a high-return variant whose contribution margin has been gutted by a return rate you stopped watching. Find those two patterns and you have found most of the money.
A worked example: turning around the line
Take the high-return variant from the chart, sitting at minus 11% CM3. Say it sells for $45, with $16 landed cost, $2 payment, $5 fulfillment, $9 shipping (low AOV, free shipping eats it), an effective $4 of returns cost spread per unit, and $14 of allocated marketing. That is $50 of cost against $45 of revenue: minus $5 per order, or minus 11%.
Run the levers:
- Reprice to $52 (a 16% increase, justified by premium positioning). CM3 moves from minus $5 to plus $2.
- Re-source the landed cost from $16 to $13 on a renegotiated MOQ. Add $3. Now plus $5.
- Set a $60 free-shipping threshold so this SKU stops absorbing the full $9 parcel; assume it recovers $4 per order on average. Now plus $9.
- Attack returns with better sizing content and photography, cutting the per-unit return cost from $4 to $2. Add $2. Now plus $11 per order, roughly 21% CM3 on the new $52 price.
The SKU crossed from minus 11% to plus 21% without a single new customer, purely on margin recovery. That is the playbook: stack the levers, re-measure, and only reach for discontinue when the stack runs out. If this variant had stayed negative after all four moves, it would have earned the cut. This example is an illustrative Eightx model, not a specific client.
What to do about it
- Build per-SKU CM3 for the whole line. Sweep shipping, returns, and fulfillment out of opex and into the per-order waterfall where they belong.
- Rank by contribution dollars, not revenue. Flag every SKU below 20% CM3 and circle the negatives.
- Reprice the losers first. Run the markup-to-margin conversion so you do not under-price by accident.
- Pull the COGS and shipping levers on the SKUs with enough velocity to justify the work. Returns and free shipping are usually the biggest hidden costs.
- Bundle thin-margin SKUs that lift AOV or support a hero, instead of cutting them.
- Discontinue only the SKUs still below 20% CM3 after real fixes, and model the write-down and stranded overhead before you do.
- Re-run the whole line quarterly. Costs drift, and a winner can slip negative without anyone noticing.
This is the same discipline behind how to raise prices in ecommerce without losing customers, and it interacts directly with how you price wholesale versus DTC. For the full pricing system, see our ecommerce pricing strategy guide.
Sources and methodology
The CM1/CM2/CM3 waterfall and the thresholds (20% CM3 scalable, below 10% scaling losses, an 8 to 40% vertical range) are from the Eightx contribution margin by vertical benchmark, built from multi-channel operator work and cross-checked against published DTC margin studies.
The shipping data is primary-source. Courier and warehousing cost inflation is the BLS Producer Price Index series for couriers and messengers (PCU492110492110) and for warehousing and storage (PCU493110493110), pulled monthly from January 2022 to April 2026. The courier series rose from 289.4 to 399.9 (+38%) and warehousing from 135.0 to 179.1 (+33%). The diesel comparison is the EIA US retail diesel price (FRED series GASDESM), whose annual average fell from $5.00 in 2022 to $3.66 in 2025, down about 27%. April 2026 BLS values are preliminary and subject to revision.
The 2026 parcel cost ($18.80 all-in for a 3 lb residential Zone 5 shipment, with surcharges at 51% of that specific invoice) is from the Eightx free shipping index. The broader "surcharges are about a third of the average package cost" figure is the ShipperHQ 2026 carrier rate brief; the two measure different things (one specific parcel versus an average), so we cite both.
Return-rate data (2026 average 19 to 20.5%, apparel near 25%, the up-to-70% unit-CM reduction at a 25% return rate, and the roughly 48% full-price resale rate) is from the Eightx ecommerce return-rate index and supporting return-economics research. Markup-to-margin conversions are from the Eightx markup vs margin guide. The median DTC net margin of 3 to 10% and the 1.2%-of-revenue inventory write-down rate are from public DTC financial syntheses.
SKU revenue concentration (about 20% of SKUs driving roughly 80% of revenue and profit) and the sub-20% cut threshold are from SKU rationalization best-practice sources. The per-SKU CM3 chart and the $45-to-$52 worked example are illustrative Eightx models, not a specific client. Vertical CM3 bars use the midpoint of each published range; the table keeps the full ranges. For brands that want this run against their own data, that is the work we do as a fractional CFO.
Frequently Asked Questions
how do i know if a product line is actually unprofitable?
Blended gross margin will hide it. Measure CM3 per SKU: revenue minus COGS, payment processing, fulfillment, outbound shipping, returns, and the marketing allocated to that SKU. If a line or its core SKUs land below 10% CM3, you are scaling losses, not profit. A scalable DTC line runs 20% CM3 or higher.
should i reprice or discontinue an unprofitable sku?
Reprice first, discontinue last. Work the levers in order: reprice, re-source COGS, cut shipping and returns, then bundle. Discontinue only when the SKU is still below your 20% CM3 target after those fixes and has no strategic role as a hero, gateway, or basket builder.
what contribution margin is too low for a sku?
Below 20% CM3 a SKU is a cut-or-fix candidate unless it is strategic. Below 10% you are scaling losses on it. Negative CM3 means you lose money on every order, so discounting it or paying to acquire those buyers makes the line worse, not better.
how many of my skus actually make money?
Usually fewer than you think. Roughly 20% of SKUs drive about 80% of revenue and profit, and a long tail of break-even and loss SKUs hides behind them. Rank by contribution dollars, not revenue, because high-volume SKUs can still be money losers.
why is my shipping cost going up when fuel prices went down?
Surcharges. BLS courier prices are up 38% since January 2022 while retail diesel fell about 27% over the same window. Carriers now add residential, dimensional-weight, peak-season, and fuel surcharges that make up roughly a third of the average package cost, and those do not fall when diesel does.
how much do returns actually cost me per order?
More than the refund. Processing a return runs about $20 to $35 for apparel and $15 to $25 for home and electronics, and only about 48% of returned items resell at full price. A 25% return rate can cut a SKU's unit contribution margin by up to 70%, which is enough to sink an otherwise fine line.
does cutting a sku automatically improve profit?
Not automatically. Removing a SKU relieves its direct variable cost and frees working capital and warehouse attention, but shared overhead does not disappear with it. Cutting also forces inventory write-downs on remaining stock. Model the net effect, not just the gross margin you stop losing.
how often should i review per-sku margin?
Quarterly for a fast-moving DTC catalog, at minimum annually for a full assortment cleanup. Costs move constantly: supplier prices, carrier surcharges, FX, and return rates all drift, so a SKU that cleared 20% CM3 last year can quietly slip negative.