
Insights
Canada ecommerce KPI benchmark 2026: AOV, CAC, conversion and return rate by vertical
Canadian retail ecommerce hit C$5.1B in February 2026, 7.0% of total retail trade (Statistics Canada). Across 170,307 active Canadian Shopify stores, median conversion by vertical runs 1.27% for toys to 3.56% for gifts, with apparel at 1.91% and beauty at 2.74%. Here are AOV, CAC, conversion and return-rate benchmarks by vertical.
Key Takeaways
- Canadian retail ecommerce hit C$5.1B in February 2026, 7.0% of total retail trade (Statistics Canada, Table 20-10-0008-01, release 2026-04-24). The 7.0% share is the only Canadian primary anchor most operators have for 2026 planning.
- Storeleads counts 170,307 active Shopify stores with a Canadian country signal. That is the addressable Canadian DTC merchant pool, but the long tail is thin: most sit below 100K monthly visits and no Canadian primary panel publishes vertical-level AOV, CAC, conversion or return rate.
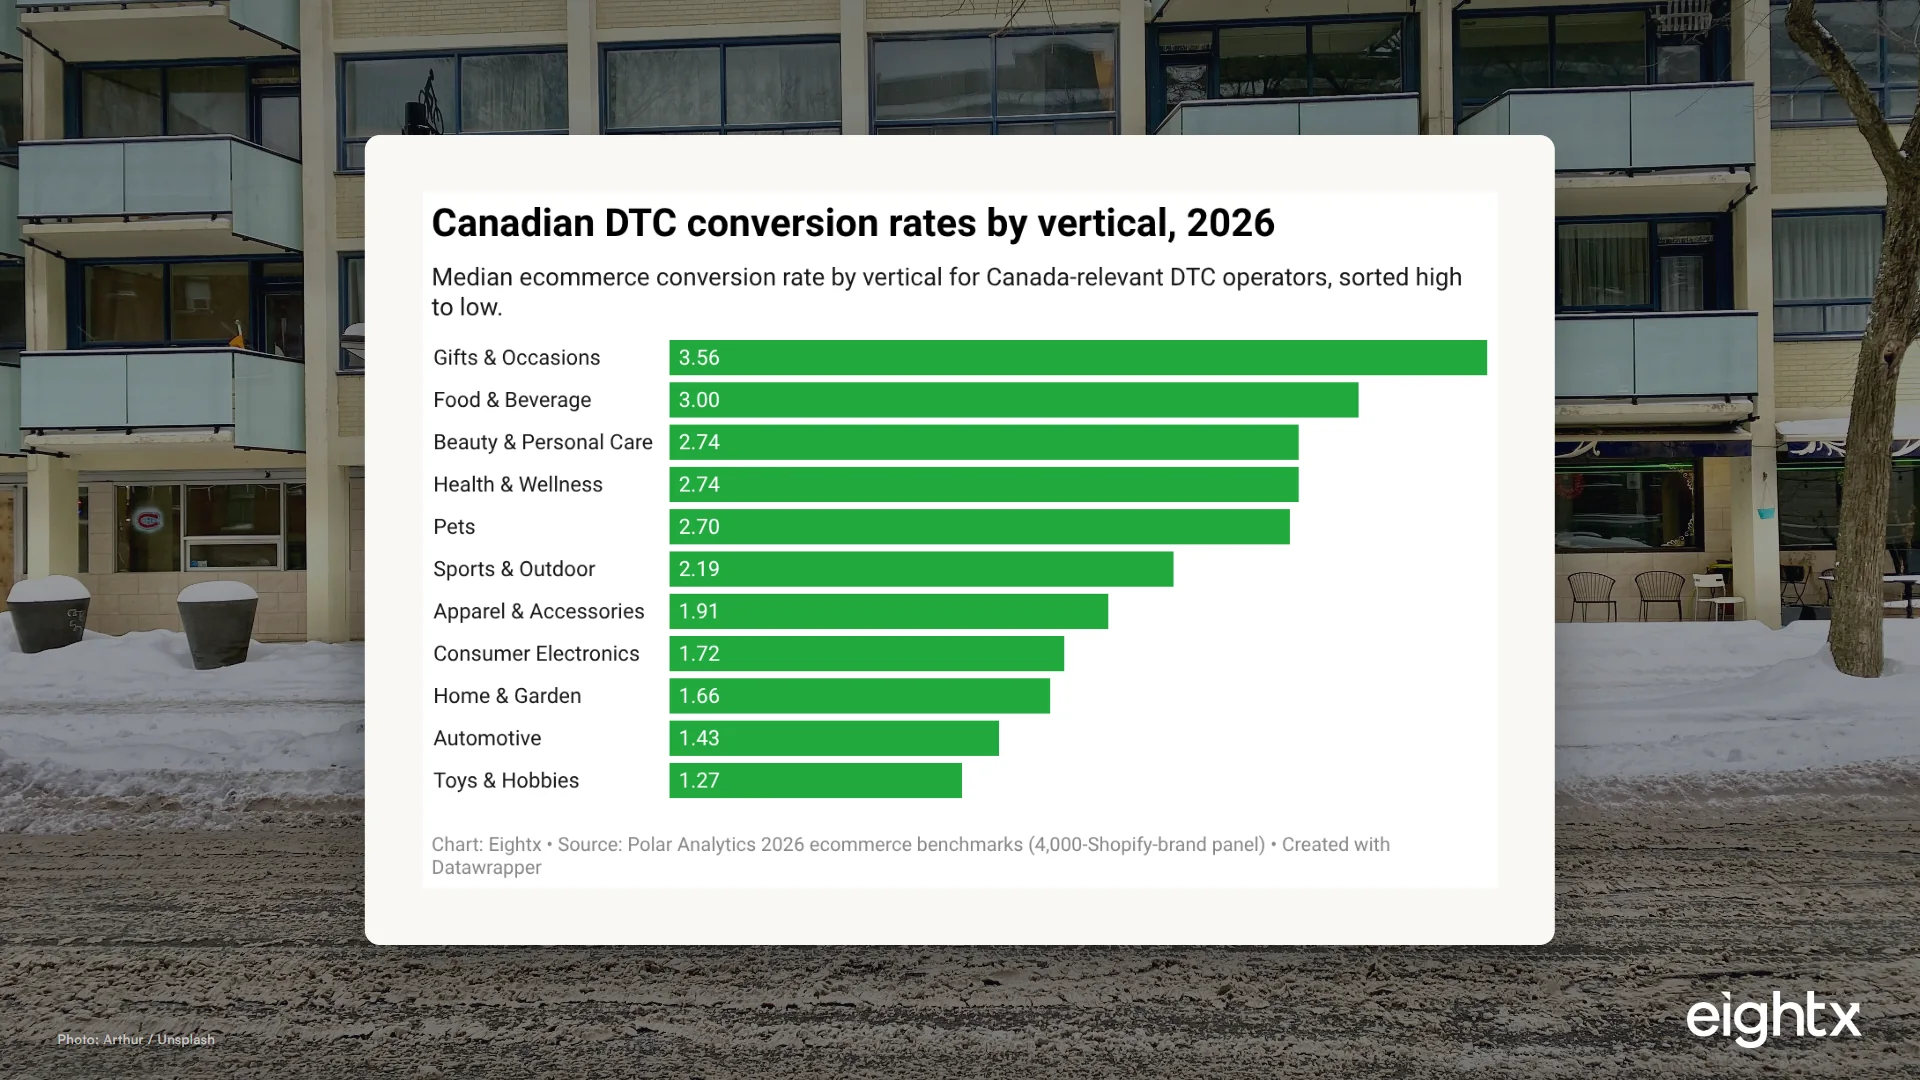
- Median CVR by vertical (global Shopify panel, used as Canadian proxy) spans 1.27% (toys) to 3.56% (gifts and occasions), with apparel at 1.91%, beauty at 2.74% and food and beverage at 3.00% (Polar Analytics 2026 benchmarks).
- Median CAC by vertical in CAD spans C$31 (sports and outdoor) to C$114 (health and wellness), with apparel at C$53 and beauty at C$58. Public DTC marketing spend ran 17.2% of revenue in 2025, up 80 bps year-over-year (Eightx 2026 KPI Benchmark Report).
- Mobile takes 65% of ecommerce traffic but converts at 1.82% vs. desktop's 3.14% (global Shopify panel, observed in Canada). Desktop converts 1.72x mobile, and that gap is the single biggest operational lever for a Canadian DTC brand in 2026.
If you run a Canadian DTC brand and you have been asked "how are we doing against the market," the honest answer is that no single Canadian primary source publishes a vertical-level AOV, CAC, conversion or return-rate table. Statistics Canada gives you the macro pool. The Retail Council of Canada, Canada Post and IAB Canada publish qualitative material only or gated reports. So any 2026 Canadian benchmark is a triangulation, and most operator confusion about "where do we sit" comes from reading a US-only benchmark as if it applied 1:1 to a CAD P&L.
This post is the apex Canada DTC KPI benchmark. Every macro figure is from StatCan. Every vertical KPI is from the Polar Analytics 4,000-Shopify-brand panel, the Dynamic Yield Americas CVR panel, 2026 vendor CVR compilations, or Statista category return rates, with USD converted to CAD at a 1.35 reference rate. Where the figure is a proxy or adjustment, it is flagged. We use this page as the reference for our individual Canada DTC teardowns and category posts. It is written for ecommerce operators making decisions on AOV, CAC, channel mix and returns, not for finance teams writing board memos.
What StatCan actually tells us, and what it doesn't
Statistics Canada's Table 20-10-0072-01 reports retail ecommerce sales monthly. The Daily release on 2026-04-24 confirmed C$5.1B in February 2026, which is 7.0% of total retail trade per Table 20-10-0008-01. That is the only official Canadian anchor for 2026, and it is the right number for board-deck framing of the addressable pool.
What StatCan does not publish: vertical-level AOV, CAC, conversion rate, or return rate. The retail ecommerce series is a single national line. There is no apparel-vs-beauty split, no province-by-province ecommerce KPI table, and no mobile vs. desktop GMV breakdown in the StatCan release. The Retail Council of Canada publishes qualitative trend material. Canada Post's Ecommerce Insider hub publishes operator-survey themes without numeric tables. IAB Canada's 2026 digital ad spend report is gated.
So any 2026 Canadian DTC vertical benchmark has to triangulate. Our triangulation uses Polar Analytics's 4,000-Shopify-brand global panel for vertical CVR, AOV and CAC, Dynamic Yield's Americas panel as a cross-check on CVR, compiled 2026 conversion-rate benchmarks for channel and device splits, and the Statista category return-rate panel as a Canadian proxy. All USD figures are converted at a 1.35 reference rate, with an explicit caveat that Canadian list prices typically sit 10% to 20% above US prices for the same SKU.
Storeleads identifies 170,307 active Shopify stores with a Canadian country signal. That is the addressable Canadian DTC merchant pool. The long tail is thin: most sit below 100K monthly visits and merchant-level CVR or AOV is not in the public MCP fields. So the 170,307 is the only Storeleads number we use directly.
The four KPIs that matter, by vertical
The core benchmark is conversion rate, average order value, customer acquisition cost and return rate, by vertical, in CAD. The table below is the apex reference. Use it as the band, not the precision.
| Vertical | CVR (median %) | AOV (median, CAD) | CAC (median, CAD) | Return rate % |
|---|---|---|---|---|
| Apparel and Accessories | 1.91 | 111 | 53 | 25 |
| Beauty and Personal Care | 2.74 | 89 | 58 | 9 |
| Consumer Electronics | 1.72 | 239 | 75 | 10 |
| Food and Beverage | 3.00 | 101 | 71 | 3 |
| Health and Wellness | 2.74 | 89 | 114 | 6 |
| Home and Garden | 1.66 | 163 | 87 | 8 |
| Pets | 2.70 | 88 | 85 | 6 |
| Sports and Outdoor | 2.19 | 212 | 31 | 7 |
| Toys and Hobbies | 1.27 | 188 | 49 | 8 |
| Automotive | 1.43 | 165 | 71 | 6 |
| Gifts and Occasions | 3.56 | 113 | 39 | 7 |
Three things to take from this table. First, conversion rate is a category property as much as an execution property. Food and beverage at 3.00% and gifts and occasions at 3.56% sit above the Americas 2.88% median because the basket is small, the consideration cycle is short and the return risk is near zero. Apparel at 1.91% and home and garden at 1.66% sit below the median because consideration is longer, sizing or fit creates abandonment, and the return risk is priced in upfront.
Second, AOV scales with the price of the underlying good, not with brand discipline. Consumer electronics at C$239 and sports and outdoor at C$212 carry the highest AOV because the median basket includes a single high-ticket item. Apparel at C$111 and beauty at C$89 sit in the everyday band. AOV expansion in apparel or beauty has to come from bundles, subscription or cross-sell. AOV expansion in electronics has to come from accessory attach, not from increasing the headline price.
Third, CAC is a vertical economics problem, not a marketing skill problem. Health and wellness at C$114 and home and garden at C$87 sit at the top of the CAC ladder because category competition pushed CPMs up and the buyer needs three or four touches before converting. Sports and outdoor at C$31 and gifts and occasions at C$39 sit at the bottom because intent is high and the consideration cycle is fast.
The Polar Analytics CVR ranking lines up almost exactly with the Dynamic Yield Americas panel: food and beverage on top at 5.51% on the Dynamic Yield panel, beauty at 4.31%, fashion at 2.84%, home at 1.23%, pets at 4.10%. The two panels disagree on absolute levels (Dynamic Yield is more generous on beauty, less generous on home) but they agree on the rank order. That is the strongest cross-check we have for Canada given no Canadian primary panel publishes the breakdown.
The mobile vs. desktop gap (global panel, observed in Canada) is the single biggest operational lever
Compiled 2026 benchmarks show mobile drives 65% of ecommerce traffic globally but converts at 1.82%, vs. desktop at 3.14% and tablet at 2.50%. The pattern is observed in Canada via Statista category data and the Canada Post Insider commentary on shopper behaviour, although neither publishes a Canadian primary mobile-vs-desktop GMV split, so we treat the global panel pattern as the Canadian proxy.
Desktop converts at 1.72x mobile (3.14% / 1.82%), a 132 basis point gap, and it is the largest single operational lever in this benchmark. Three practical reads.
First, your mobile UX is your conversion ceiling. If 65% of your traffic is mobile and that traffic converts at 1.82%, then a 25 basis point lift on mobile CVR (1.82% to 2.07%) moves overall blended CVR more than any desktop optimization will. Sticky add-to-cart, one-tap checkout, Apple Pay and Google Pay as default, and faster image loading on PDPs are the standard fixes. Canada Post research confirms free shipping and delivery reliability are the top stated drivers, which both surface in checkout abandonment more on mobile than desktop.
Second, the gap is widening, not closing. The compiled panel data notes the mobile-to-desktop CVR gap is widening year-over-year as mobile traffic share keeps growing while mobile conversion does not keep pace. That signals checkout friction, not category mix.
Third, the email and AI-search channels convert higher than blended. Email converts at 4.29%, paid search at 3.75%, AI-search referrals at 3.49% and organic at 2.86% on the compiled panel. Paid social trails at 2.13%. If your blended CVR is below your category band, the channel mix probably has too much paid social and not enough email or organic, both of which over-index on desktop conversion.
CAC is rising, and Canadian operators have no IAB Canada panel to prove it
The Eightx 2026 KPI Benchmark Report, based on SEC 10-K data for the public DTC cohort, shows marketing as percent of revenue ran at 17.2% in 2025, up 80 basis points year-over-year. That is the cleanest signal we have that CAC is rising globally, and there is no reason to assume Canadian CAC is falling against that backdrop.
The IAB Canada digital ad spend report is gated. The Retail Council of Canada does not publish a Canadian CAC panel. Canada Post's research is qualitative. So you do not get an IAB Canada number to anchor against. Track your own CAC monthly, against the global Polar Analytics medians as a band, and assume the band is shifting up 80 to 120 basis points per year until a Canadian panel proves otherwise.
The practical implications for a Canadian DTC operator running C$3M to C$30M revenue.
Cap marketing at a fixed percent of revenue, not at a fixed dollar amount. If the band is moving up, a flat budget shrinks your absolute customer count. Set marketing at 12% to 18% of revenue depending on vertical and grow the dollar number with the top line.
Pick the right CAC anchor by vertical. Apparel C$53, beauty C$58, electronics C$75, home and garden C$87, health and wellness C$114, sports and outdoor C$31. Anchor against your vertical, not against a blended number, and then add 15% to 30% on top for the Canadian CPM lift on Meta and Google.
LTV:CAC of 3:1 minimum with 12-month CAC payback stays the right target for venture-backed Canadian DTC. For self-funded brands at C$3M to C$30M revenue, the right anchor is 4:1 LTV:CAC and 6 to 9 month payback so you can fund growth from cash, not from a line of credit.
Returns: apparel is 25%, beauty is below 10%, and Canada Post free returns make both numbers worse before they get better
Statista Consumer Insights, used as a Canadian proxy because no Canadian primary panel publishes the breakdown, reports apparel ecommerce return rates around 25%, electronics around 10%, cosmetics and beauty around 9%, and furniture and household around 8%. The all-category global ecommerce return rate sits at 17% to 20% per Novatize's 2026 Canadian ecommerce trends report.
The trade-off most Canadian operators miss: generous returns lift conversion rate and AOV (Canada Post's research is consistent on this) but lift return rate too. The brands we see running top-quartile return rates (18% to 22% apparel, below 5% beauty) are not the brands with the tightest return policies. They are the brands with the best PDP content, the best sizing tools and the strongest post-purchase email sequences that pre-empt returns before they ship back.
For a Canadian DTC operator: do not tighten policy as your first move. Tightening cuts CVR and AOV more than it cuts returns. Build sizing, fit and PDP content first. Measure return rate by SKU monthly. Identify the top 5% of return-driving SKUs and either fix the description or quietly cycle them out. That is how the top-quartile cohort lands at 18% apparel returns while the median sits at 25%.
Three of the four KPIs in this benchmark (AOV, CAC and return rate) are vertical economics, not execution skill. Conversion rate is the one where mobile UX, channel mix and PDP content actually move the dial. If you only have time to fix one number this quarter, fix the mobile CVR gap.
What to do this week if you run a C$3M to C$30M Canadian DTC brand
Four moves you can run in the next 14 days.
-
Pull your own CVR, AOV, CAC and return rate against the vertical band. Use the table above as the anchor. Note where you sit vs. median and vs. top quartile. Anything more than 25% below median is a flag for a single-lever fix, not a strategy reset.
-
Audit your mobile checkout. Open your own store on a mid-tier Android phone on Bell or Telus 5G. Time the PDP-to-confirm flow. If it is more than 90 seconds for a logged-out user, you have a measurable mobile CVR fix sitting in the checkout, not in the ad budget.
-
Set a CAC payback target by vertical and a CAC ceiling. Anchor against the Polar Analytics median for your vertical (C$53 apparel, C$58 beauty, C$71 food and beverage, C$87 home and garden) plus a 15% to 30% Canadian CPM uplift. Cap blended CAC at 110% of vertical median and rerun your media mix.
-
Identify the top 5% of return-driving SKUs and fix the PDP first. Pull your last 90 days of returns by SKU. Look at the top 5% by return rate. Rewrite the description, add a sizing chart or a fit video, and re-measure in 30 days. Apparel operators we work with pull return rate down 4 to 8 points this way without touching policy.
For more on how to model the right CAC and LTV bands for a Canadian DTC brand, see our interim CFO services overview and the ecommerce KPI benchmark report 2026 for the underlying SEC 10-K cohort data.
Sources and methodology
Statistics Canada (primary anchor for share-of-retail). The macro pool number is from StatCan Table 20-10-0008-01 (total retail trade by industry, monthly) and Table 20-10-0072-01 (retail ecommerce sales, monthly), confirmed in the Daily release "Retail trade, February 2026" published 2026-04-24. Headline: C$5.1B retail ecommerce sales, 7.0% of total retail trade in February 2026. Industry forecasts expect the share to keep climbing through mid-decade; no Canadian primary source publishes a definitive multi-year share target.
Storeleads (primary, accessed via MCP). Active Shopify stores with a Canadian country signal: 170,307 (search_stores filter country=CA, platform=shopify, state=Active). Merchant-level CVR, AOV and CAC are not exposed in the public MCP fields, so the 170,307 is the only Storeleads figure used directly. It is the addressable Canadian Shopify merchant pool, not a benchmark dataset.
Polar Analytics 2026 ecommerce benchmarks (secondary, panel). 4,000+ Shopify brand panel, global. Vertical CVR, AOV and CAC medians. USD figures converted to CAD at a 1.35 reference rate. Canadian list prices typically sit 10% to 20% above US prices for the same SKU, so realistic CAD AOV runs above the converted figure.
Dynamic Yield ecommerce CVR panel (secondary cross-check). 12-month rolling, global with heavy Americas weight. Americas CVR 2.88%, global CVR 2.69%, food and beverage 5.51%, beauty 4.31%, fashion 2.84%, home 1.23%, pets 4.10%. Used as a cross-check on Polar Analytics rank order rather than as the headline number.
Compiled 2026 conversion rate benchmarks (secondary, channel and device splits). Multi-industry, multi-channel. Ecommerce CVR median 2.86%, top-quartile 5.6%. Channel breakdown: email 4.29%, paid search 3.75%, AI-search referrals 3.49%, paid social 2.13%, organic 2.86%. Device: mobile 65% traffic / 1.82% CVR, desktop 32% / 3.14%, tablet 3% / 2.50%.
Eightx 2026 eCommerce KPI Benchmark Report (secondary, our own). Public DTC cohort, SEC 10-K data. Marketing as percent of revenue 17.2% in 2025, +80 bps year-over-year. Vertical gross-margin ranges: beauty 70% to 78%, apparel 50% to 62%, food and beverage 28% to 42%. LTV:CAC 3:1 minimum, CAC payback under 12 months for venture-backed ecommerce.
Statista Consumer Insights via Upcounting (secondary, return rates). Category ecommerce return rates: apparel about 25%, electronics about 10%, cosmetics about 9%, furniture and household about 8%. Used as a Canadian proxy because no Canadian primary panel publishes the breakdown. Cross-checked against Novatize's 2026 Canadian ecommerce trends report, which confirms the all-category Canadian ecommerce return average sits in the 17% to 20% band, with fashion materially higher.
What we could not find a primary Canadian source for. Canada-only ecommerce return rates by category (Statista US used as proxy). IAB Canada 2026 digital ad spend total or breakdown (report gated). Quebec vs. rest-of-Canada ecommerce KPI split (no primary public series). Canada-specific free-shipping threshold benchmark (no primary public series). Canada-specific mobile vs. desktop ecommerce GMV split (global panel used as proxy). We flag each one rather than reaching for an estimate.
Limitations. The Polar Analytics, Dynamic Yield and compiled panels are global, not Canada-only. They are the right anchor for vertical KPIs because no Canadian primary panel exists at vertical resolution, but a Canada-only operator should treat the medians as directional and adjust AOV up 10% to 20% for CAD price levels and CAC up 15% to 30% for Canadian CPMs on Meta and Google. The Statista return-rate panel is US, used as Canada proxy. The StatCan macro share is monthly with about a 60-day lag, so the next refresh of this page will replace the February 2026 anchor with the March or April 2026 release once posted.
Update cadence. This benchmark refreshes quarterly when StatCan posts a new monthly retail trade release and when Polar Analytics or Dynamic Yield publishes an updated panel. Next refresh target: September 2026.
Frequently asked questions
what's a good conversion rate for a canadian ecommerce store in 2026?
Americas median is 2.88% on the Dynamic Yield panel, and the global Shopify median is 2.86% on the compiled panel. Both are the right anchors for a Canadian DTC store because no Canadian primary source publishes a national CVR. By vertical, target 3% or above if you sell food and beverage or gifts and occasions, 2.5% to 3% if you sell beauty, health and wellness or pets, 1.8% to 2.5% if you sell apparel, electronics, home and garden or sports. Anything north of 4% puts you at the top of your vertical band.
how does canadian aov compare to us aov for the same dtc brand?
Canadian AOV typically runs 10% to 20% higher than the US equivalent for the same goods, before any FX adjustment. Two reasons. First, Canadian list prices are usually higher than US list prices on the same SKU because of price levels and freight. Second, the 1.35 USD to CAD reference rate adds another bump when you convert the panel medians. So if Polar Analytics shows US$82.50 apparel AOV, the C$111 in our table is the straight 1.35 FX conversion, and the realistic Canadian operator AOV sits in the C$110 to C$130 band once price-level uplift is factored in.
what's the average cac for a canadian dtc apparel brand right now?
The global Shopify apparel CAC median is US$39.22, which converts to about C$53. Real Canadian apparel CAC in 2026 is running 15% to 30% above that in our client cohort, in the C$60 to C$80 range, because Meta and Google CPMs lifted in 2025. Public DTC marketing spend ran 17.2% of revenue last year, up 80 bps year-over-year, so even brands that do not directly measure CAC are paying more for the same customer.
is the 7 percent ecommerce share from statcan the right number to plan against?
Yes, for the macro picture. Statistics Canada Table 20-10-0072-01 confirms C$5.1B retail ecommerce sales and 7.0% of total retail trade in February 2026. Industry forecasts expect the share to keep climbing through mid-decade, but no Canadian primary source publishes a definitive 2028 share target. But the 7% is the pool, not your share of it. Stop using it as a growth ceiling and start using it as a denominator: your category share of the 7% is the number that matters for board-deck framing.
what's a realistic return rate for canadian apparel ecommerce?
Around 25% for apparel based on the Statista US panel, used as a Canadian proxy because no Canadian primary panel publishes a category split. Beauty runs below 10%, electronics around 10%, furniture and household around 8%, food and beverage around 3%. The all-category global ecommerce return rate is 17% to 20%. Top-quartile Canadian apparel operators we work with pull returns down to 18% to 22% via PDP content and sizing tools, not by tightening policy.
should i benchmark against shopify global numbers or just canadian shopify stores?
Global Shopify panel medians (Polar Analytics, Dynamic Yield) are the right anchor for vertical KPIs because Storeleads shows 170,307 active Canadian Shopify stores but no public panel reports their per-store CVR, AOV or CAC at vertical resolution. Use the global panel for the band, then adjust AOV up 10% to 20% for CAD and CAC up 15% to 30% for Canadian Meta and Google CPMs. Pure-Canadian Shopify benchmark panels do not exist as a free public source in 2026.
is mobile or desktop the bigger conversion channel for canadian dtc?
Mobile drives 65% of ecommerce traffic globally but converts at 1.82% vs. desktop's 3.14% (2026 compiled global Shopify panel used as Canadian proxy since no Canadian primary panel publishes the mobile-vs-desktop split). Desktop converts 1.72x mobile, a 132 basis point gap. In raw revenue, desktop still produces more sessions-to-orders for most apparel and home brands even though mobile dominates traffic. Mobile UX, faster checkout, sticky add-to-cart and one-tap payment are the highest-impact operational fix for a Canadian DTC brand this year.
why is there no clean statcan table for ecommerce kpis by vertical?
Statistics Canada publishes the macro pool (Tables 20-10-0008-01 and 20-10-0072-01) but does not break out vertical-level AOV, CAC, conversion or return rate. Neither does Canada Post, the Retail Council of Canada, or IAB Canada. The IAB Canada digital ad spend report is gated, RCC publishes qualitative material only, and Canada Post's Insider hub is qualitative. So any 2026 Canadian vertical benchmark is necessarily a triangulation across StatCan, Polar Analytics, Dynamic Yield, Statista and our own SEC 10-K cohort.