
Financial Strategy
Food Brand Financial Benchmarks 2026
For 2026, public food brands run gross margins of 21-38% (median ~33%), the bottom of CPG, with operating margins from roughly 1% to 15% for healthy operators. DTC food CAC is the category's lowest at $45-53, but with the thinnest first-order margin, repeat purchase decides everything.
Key Takeaways
- Public food brands post gross margins of just 21-38% (median ~33%), the bottom of the CPG table. Our cross-vertical SEC analysis puts the all-DTC median near 57%, so benchmarking your food brand against an all-DTC number sets a target you will never hit.
- Input-cost inflation is actively compressing the category. Hershey's gross margin fell from 47.3% to 33.5% in a single year as cocoa costs spiked, a 14-point drop on an $11.7B revenue base.
- Food has the lowest CAC of any DTC vertical (~$45-53) and the lowest first-order margin to pay it back. A food product almost never pencils on the first order, so repeat purchase and subscription conversion are the entire model.
- Trade spend is the silent margin killer. Grocery and FDM trade spend commonly runs 15-25% of revenue once a brand is promoted at retail, so a 45% list gross margin can net closer to 25% before any SG&A.
- Inventory turns range 4.5x-20x (18-82 days) and shelf life drives the spread. Every extra 30 days on a perishable, low-AOV SKU is cash locked up plus spoilage write-off risk.
Most food founders walk into a benchmarking conversation fixated on one number: gross margin. They have read that a healthy DTC brand runs 55-60%, they are sitting at 38%, and they assume something is broken. Nothing is broken. Food is the lowest-margin major category in DTC and CPG, full stop, and the headline gross-margin number everyone fixates on is the wrong benchmark to start with. This is the flagship financial benchmark for food brands: what a real food P&L looks like at every size, built from six public food pure-plays and the 2026 DTC unit-economics data, so you can stop comparing yourself to a snack giant and start fixing the one lever that is actually capping your growth.
Food is the lowest-margin category in DTC, so start there
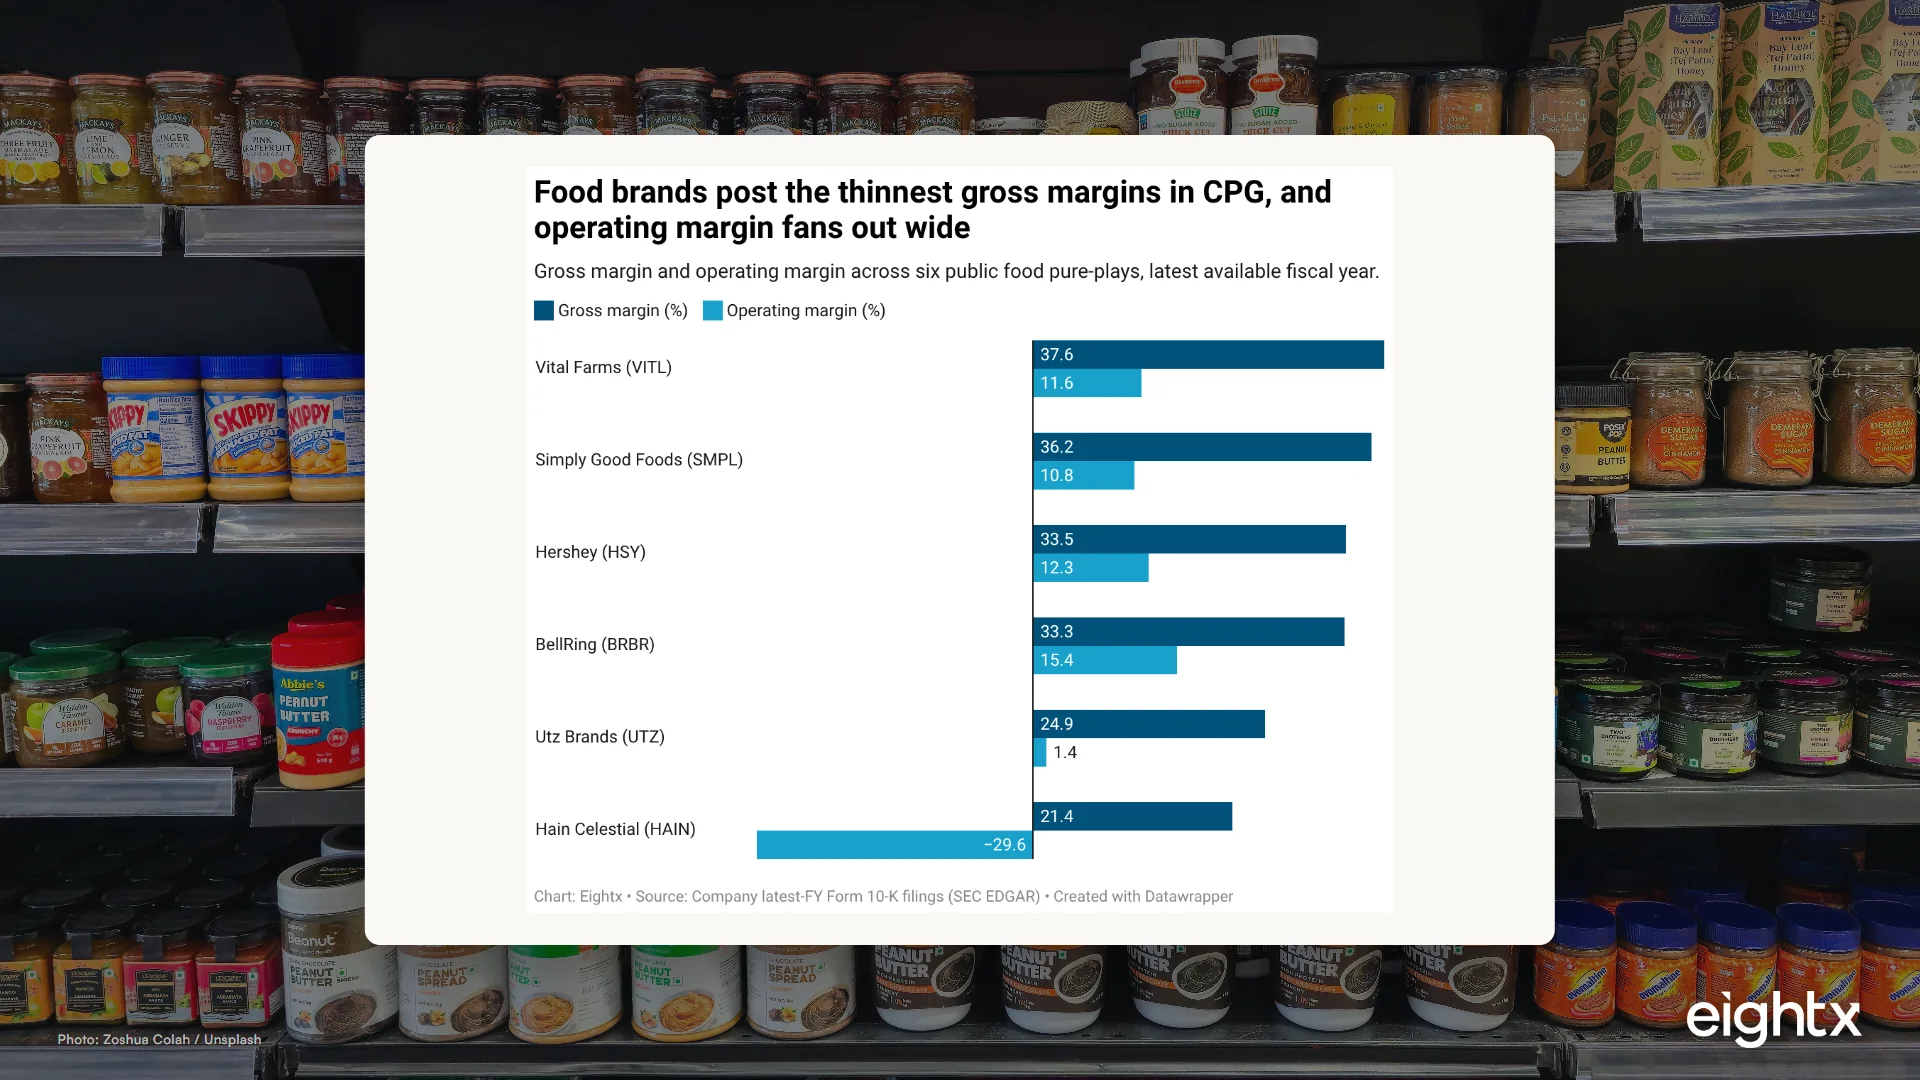
Across six public food pure-plays, gross margin spans 21.4% to 37.6%, with a median around 33%. Vital Farms sits highest at 37.6%, Simply Good Foods at 36.2%, Hershey at 33.5%, BellRing at 33.3%, Utz at 24.9%, and Hain Celestial at the bottom at 21.4%. For comparison, our cross-vertical SEC analysis puts the median across all DTC categories near 57%. Food sits at the bottom of the table, and it is not close.
That single fact reframes every benchmarking exercise. When I talk to founders running a food brand this size, the first thing I do is take the all-DTC 57% number off the table. If you anchor your target to a beauty or apparel brand, you have set a goal the category cannot hit, and you will spend a year chasing margin points that were never there to win.
It gets sharper when input costs move. Hershey's gross margin fell from 47.3% in FY2024 to 33.5% in FY2025, a 14-point drop in a single year, as cocoa costs spiked and cost of goods jumped from $5.9B to $7.77B while revenue rose only about 4%. That is a $11.7B business losing 14 points of gross margin to one commodity. If a brand that size, with that purchasing power and that hedging desk, can lose 14 points to cocoa, a $15M founder needs to treat input-cost exposure as a structural risk, not a line-item surprise.
The other thing the chart shows: operating margin fans out far wider than gross margin. BellRing runs 15.4%, Hershey 12.3%, Vital Farms 11.6%, Simply Good Foods 10.8%, against Utz at 1.4% and Hain at -29.6% (distorted by a goodwill impairment, not operating reality). Gross margin is not where food brands win or lose. The spread underneath it is.
What "good" looks like at each stage
Public-company margins are the ceiling, not your target. For a private food brand at $5M-$150M, the realistic, fully-loaded benchmarks are 40-50% gross margin on DTC revenue and 35-45% on retail-channel revenue. Operating margin for healthy operators in this band lands in the 0-10% range, with the upper end requiring real SG&A discipline as you scale.
The pattern we see again and again is that the gap between a 28% brand and a 44% brand is rarely the headline recipe cost. It is co-packer conversion cost on small production runs, packaging, and freight on a heavy, low-value product. A sub-$5M brand often runs 20-35% gross margin purely because minimum runs and weak purchasing power inflate per-unit co-packing cost. Move into $5M-$50M with better co-packer bids and pack-format work and 30-45% becomes reachable; premium ambient and DTC-heavy brands can push to 50-55%.
For cross-vertical context on how these bands compare, see our apparel financial benchmark and beauty financial benchmark. Food sits below both, which is exactly why the playbook is different.
The DTC unit economics that actually decide it
Here is the paradox at the center of food. It has the lowest CAC of any DTC vertical, roughly $45-53 per new customer, well under the $50-100 all-DTC blended range. And it has the lowest single-purchase margin to pay that CAC back. A cheap customer you cannot make money on is not a cheap customer.
Run the math the way the data forces you to. AOV sits at $30-60. At a 35% contribution margin, a $45 order throws off about $16 of contribution. If your CAC is $50, your first order is underwater. You do not have a profitable business until the second or third order, which is why a food product almost never pencils on the first order and repeat purchase is the entire model.
That is where LTV and retention carry everything. Healthy LTV:CAC is 3:1 or better, the cross-industry median is 3.4:1, and the top quartile is 5.6:1. The DTC repeat-purchase rate averages 25-30%. The single biggest lever is subscription conversion, and the retention gap inside subscriptions is brutal: replenishment products like coffee and pantry staples churn 4-7% per month, while curation and discovery boxes churn 12-18% per month. Same CAC, triple the churn, and the LTV that results is a different business.
When I talk to founders who cannot figure out why a low CAC is not turning into profit, it is almost always this. They built acquisition before they built the repeat-purchase machinery, so every cheap first order is a small loss they never recover. The StoreLeads data backs this up at the category level: of roughly 212,000 Shopify Food & Drink stores tracked globally, only about 4.2% run a subscription app. The economics demand repeat purchase, and most of the category has not built for it.
The silent margin killer: trade spend and channel mix
The lever that surprises founders most when they move into retail is trade spend. Promotions, slotting fees, and in-store support commonly run 15-25% of gross revenue once a brand is actively promoted in mainstream grocery and mass. That is not marketing you choose. It is the cost of being on the shelf and moving velocity.
The arithmetic is unforgiving. A 45% list gross margin, minus 20% of revenue in trade, nets closer to 25% realized gross margin before a single dollar of SG&A. Indie brands consistently under-report this early, booking 5-10% of revenue to trade while they are small, then watching it ramp toward 15-20%+ as they scale into conventional retail and the buyers start demanding programs.
This is why channel mix is a margin decision, not just a distribution decision. DTC fully-loaded gross margin (40-50%) sits above retail-channel margin (35-45%) precisely because trade spend and retailer economics eat the difference. When we have struggled to make a retail-heavy food P&L work, what worked was treating trade spend as a named line item with its own owner and target from day one, not a mystery deduction that shows up in the quarterly actuals after the fact.
The working-capital clock: inventory turns and spoilage
The last lever is the one that strangles small food brands even at a healthy margin: working capital tied up in perishable inventory. Inventory turns across the public comps range from 4.5x to 20x, and shelf life drives almost all of the spread.
Vital Farms turns inventory 20x, about 18 days, because eggs have a short shelf life and move fast. Utz runs 10.7x (34 days), while broad-portfolio Hain sits at 4.5x (82 days) carrying a wide ambient range. Eightx benchmarks food at roughly 38 days of inventory versus about 168 for non-perishables. For a small brand, every extra 30 days on a perishable, low-AOV SKU is cash locked up, and on a perishable it is also spoilage write-off risk. A slow-turning frozen or fresh SKU does not just trap working capital. It quietly throws product in the bin.
Food is the only major DTC category where the headline gross margin lies to you. The number you fixate on sits at the bottom of the table, and the real outcome is decided by the three things underneath it: trade spend that nets a 45% margin down to 25%, a CAC you can only pay back on the second order, and a working-capital clock set by shelf life. Fix the worst of those three and the P&L moves. Chase the headline margin and you chase the wrong number.
Both data tables below carry the full reference detail behind the charts.
| Company | Ticker | Revenue ($M) | Gross margin | Operating margin | Inventory turns | Days inventory |
|---|---|---|---|---|---|---|
| Hershey | HSY | 11,693 | 33.5% | 12.3% | 6.2x | 59 |
| BellRing Brands | BRBR | 2,317 | 33.3% | 15.4% | 5.4x | 68 |
| Simply Good Foods | SMPL | 1,451 | 36.2% | 10.8% | 6.5x | 56 |
| Hain Celestial | HAIN | 1,560 | 21.4% | -29.6% | 4.5x | 82 |
| Utz Brands | UTZ | 1,439 | 24.9% | 1.4% | 10.7x | 34 |
| Vital Farms | VITL | 759 | 37.6% | 11.6% | 20.0x | 18 |
| Metric | Benchmark band | Source |
|---|---|---|
| DTC fully-loaded gross margin | 40-50% | Eightx / Foundry CRO |
| Retail-channel fully-loaded gross margin | 35-45% | Eightx |
| CAC (DTC food & beverage) | $45-$53 | Foundry CRO 2026 |
| 12-month LTV (food & beverage) | $100-$200 | Attn Agency 2026 |
| LTV:CAC (healthy) | 3:1 to 5:1 | Attn Agency 2026 |
| AOV (DTC food / snack) | $30-$60 | Operator pricing data / Foundry |
| Repeat purchase rate (DTC avg) | 25-30% | Vendor composite 2026 |
| Subscription monthly churn (replenishment) | 4-7% | Foundry CRO |
| Subscription monthly churn (curation) | 12-18% | Foundry CRO |
| Retail trade spend (% of revenue) | 15-25% | CPG operator data |
| Inventory days (food) | ~38 days | Eightx spoilage benchmark |
How to use these benchmarks
Do not read this report as a scorecard to feel good or bad about. Read it as a diagnostic. Pick your revenue band and channel mix, line your numbers up against the right band (not the all-DTC one), and find your single worst lever. For most food brands it is one of three things: trade spend that has crept past 20% of revenue unnoticed, a CAC payback that stretches past the second order because repeat purchase is too thin, or inventory turns slow enough to trap cash and risk spoilage.
Fix that one lever before you touch anything else. A 14-point cocoa shock is outside your control, but the trade-spend line, the subscription-conversion rate, and the working-capital clock are not. When we sit down with a food brand that feels stuck, the win is almost never a heroic margin rebuild. It is naming the one number that is quietly capping the business and moving it. If you want a CFO read on which lever that is for your brand, that is exactly what our interim CFO services are built for.
Sources and methodology
The public-company benchmarks are computed from the latest available fiscal-year Form 10-K filings of six public food pure-plays, pulled via SEC EDGAR: Hershey (HSY, FY ended 2025-12-31), BellRing Brands (BRBR, FY ended 2025-09-30), The Hain Celestial Group (HAIN, FY ended 2025-06-30), The Simply Good Foods Company (SMPL, FY ended 2025-08-30), Utz Brands (UTZ, FY ended 2025-12-28), and Vital Farms (VITL, FY ended 2025-12-28). Gross margin is gross profit divided by revenue, operating margin is operating income divided by revenue, inventory turns is cost of revenue divided by inventory, and days inventory is 365 divided by turns.
Three caveats matter. First, Hain's FY2025 operating income (-$461.6M, a -29.6% operating margin) is driven by a large goodwill and intangible impairment, not operating reality; its prior-year operating margin was roughly -1.1%. We keep it in the chart as a cautionary negative outlier and flag it rather than letting it set the category bar. Second, Hershey's FY2025 gross margin of 33.5% is depressed by cocoa-cost inflation, with COGS jumping to $7.77B from $5.90B while revenue rose only about 4%, cutting gross margin from 47.3% the year before. We present that as the single most important data point in the report, not a footnote. Third, inventory and balance-sheet values use the most recent reported figures, and fiscal-year ends differ across the comps (December, September, August, June), so this is a "latest available fiscal year" snapshot, not a uniform calendar year.
The DTC unit-economics bands (CAC, LTV, AOV, repeat rate, churn, conversion) are a synthesis of 2026 benchmark sources including Foundry CRO and Attn Agency, triangulated against Eightx's own category benchmarks. Where a figure is reported for "food and beverage" rather than food alone, it is labeled as such; beverage-specific economics are covered separately. These are planning ranges, not guarantees, and your own AOV, category, and channel mix will move you within the bands.
The category-size and technology-adoption figures come from StoreLeads Food & Drink aggregates: roughly 212,895 Shopify Food & Drink stores globally (82,297 US) and 312,660 on WooCommerce, with about 2.9% on Shopify Plus, 16.7% on Klaviyo, and 4.2% running a subscription app. The StoreLeads category filter is Food & Drink-wide and includes beverages, so treat those counts as a Food & Drink proxy rather than a food-only census. Trade-spend ranges are an industry-standard planning benchmark synthesized from CPG operator data and the selling-expense loads visible in public filings, not a single reported line item.
Frequently asked questions
what is a good gross margin for a food brand?
For a packaged food brand, a fully-loaded gross margin of 40-50% on DTC revenue and 35-45% on retail-channel revenue is a healthy 2026 target. Public food pure-plays run 21-38% at the corporate level, so anything in the low 40s after fulfillment is genuinely good for the category.
is a 35% gross margin good for a food brand?
At the public-company level, yes. 35% would sit near the top of the public food comps, where the median is about 33%. For a small DTC brand it is acceptable but tight, because you still have to fund CAC out of a thin first-order margin, so your repeat rate has to carry the model.
what is the average cac for a food and beverage dtc brand in 2026?
Roughly $45-53, the lowest CAC of any DTC vertical. The catch is that food also has the lowest single-purchase margin, so a low CAC does not mean easy payback. You usually need the second or third order before acquisition pays back.
what ltv to cac ratio should a food cpg brand target?
Aim for 3:1 or better on a 12-month basis, with payback under 12 months. The cross-industry median is about 3.4:1 and the top quartile is 5.6:1. Below 2:1 is dangerous in food because there is no first-order cushion to absorb a slow payback.
why is my food brand not profitable even though gross margin looks fine?
Usually trade spend and CAC payback. A 45% list gross margin can net closer to 25% after 15-25% of revenue goes to retail trade promotions and slotting, and then a thin first-order margin has to fund acquisition. The headline margin looks fine while the stack underneath it eats the profit.
how many inventory turns should a food ecommerce brand have?
It depends on shelf life. Public food comps range from 4.5x (broad ambient portfolio, ~82 days) to 20x (eggs, ~18 days). Ambient and shelf-stable brands should target roughly 6-10 turns; perishable and frozen run lower. Below about 5 turns on a perishable SKU, you are carrying spoilage risk.
how much does trade spend eat into food brand margins at retail?
Commonly 15-25% of gross revenue once a brand is actively promoted in mainstream grocery and mass. Indie brands often under-report it early at 5-10%, then watch it ramp as they scale into conventional retail. It is the single biggest reason retail-channel margin lands below DTC.
what's a good repeat purchase rate for a food or snack brand?
The DTC average is 25-30%. For a consumable that almost never pays back on the first order, you want to be at or above that, and replenishment subscriptions (coffee, pantry staples) churn 4-7% per month versus 12-18% for curation and discovery boxes, a 3x retention gap that decides whether the model works.
Related Eightx benchmarks: Celsius vs Vital Farms vs Beyond Meat and Food and Bev Shelf-Life and Spoilage Cost.