
Inventory
Food and Bev Shelf-Life and Spoilage Cost: The Margin Tax Other CPG Brands Never Pay (2026)
Perishability is a margin tax unique to food and beverage. Total grocery shrink runs about 3 percent of sales, but fresh departments lose 4 to 9 percent, and short shelf life plus retailer date-code rejection caps how much you can safely buy. Food turns inventory in about 38 days versus 168 for beauty, so reorder discipline is the whole game.
Key Takeaways
- Total US grocery shrink runs about 3 percent of sales, but fresh departments lose 4 to 9 percent, with deli and fresh-prepared at 9 percent and bakery at 7.1 percent (FMI 2022).
- Food and beverage turns inventory in about 38 days, versus 140 for apparel and 168 for beauty, the fastest of any consumer vertical, because shelf life forces it.
- Retailers want roughly two-thirds of shelf life remaining at the DC door (the one-third / two-thirds rule), so a 90-day product can be rejected with 50 days left.
- Food and bev gross margin runs 30 to 49 percent for public brands and 40 to 55 percent for indie, less than half of beauty, so every point of spoilage hurts more.
- Shelf life sets a hard ceiling on your safe inventory buy: if you can only sell 30 days of stock before code rejection, do not buy 60.
Most consumer brands get to ignore time. A pallet of phone cases sits in a 3PL for three years and ships out fine. A pallet of cold-pressed juice does not. Somewhere inside its shelf-life window it goes from sellable to a write-off, and if it ships late, a retailer's receiving dock rejects it before it even reaches a shelf. That single fact is the defining economic feature of food and beverage, and it shows up as a tax on your margin that beauty, apparel and electronics brands never pay.
Call it what it is: a perishability tax. It has three lines. Spoilage and shrink eat a real percentage of what you make. Short shelf life caps how much you can safely buy in one go. And retailer date-code rules can reject perfectly good product just for arriving with too little life left. Add it up and food and beverage runs the tightest inventory clock in all of consumer, by necessity, not by choice. Here is how to put numbers on each line and how to buy around them.
Spoilage and shrink: what the margin tax actually costs
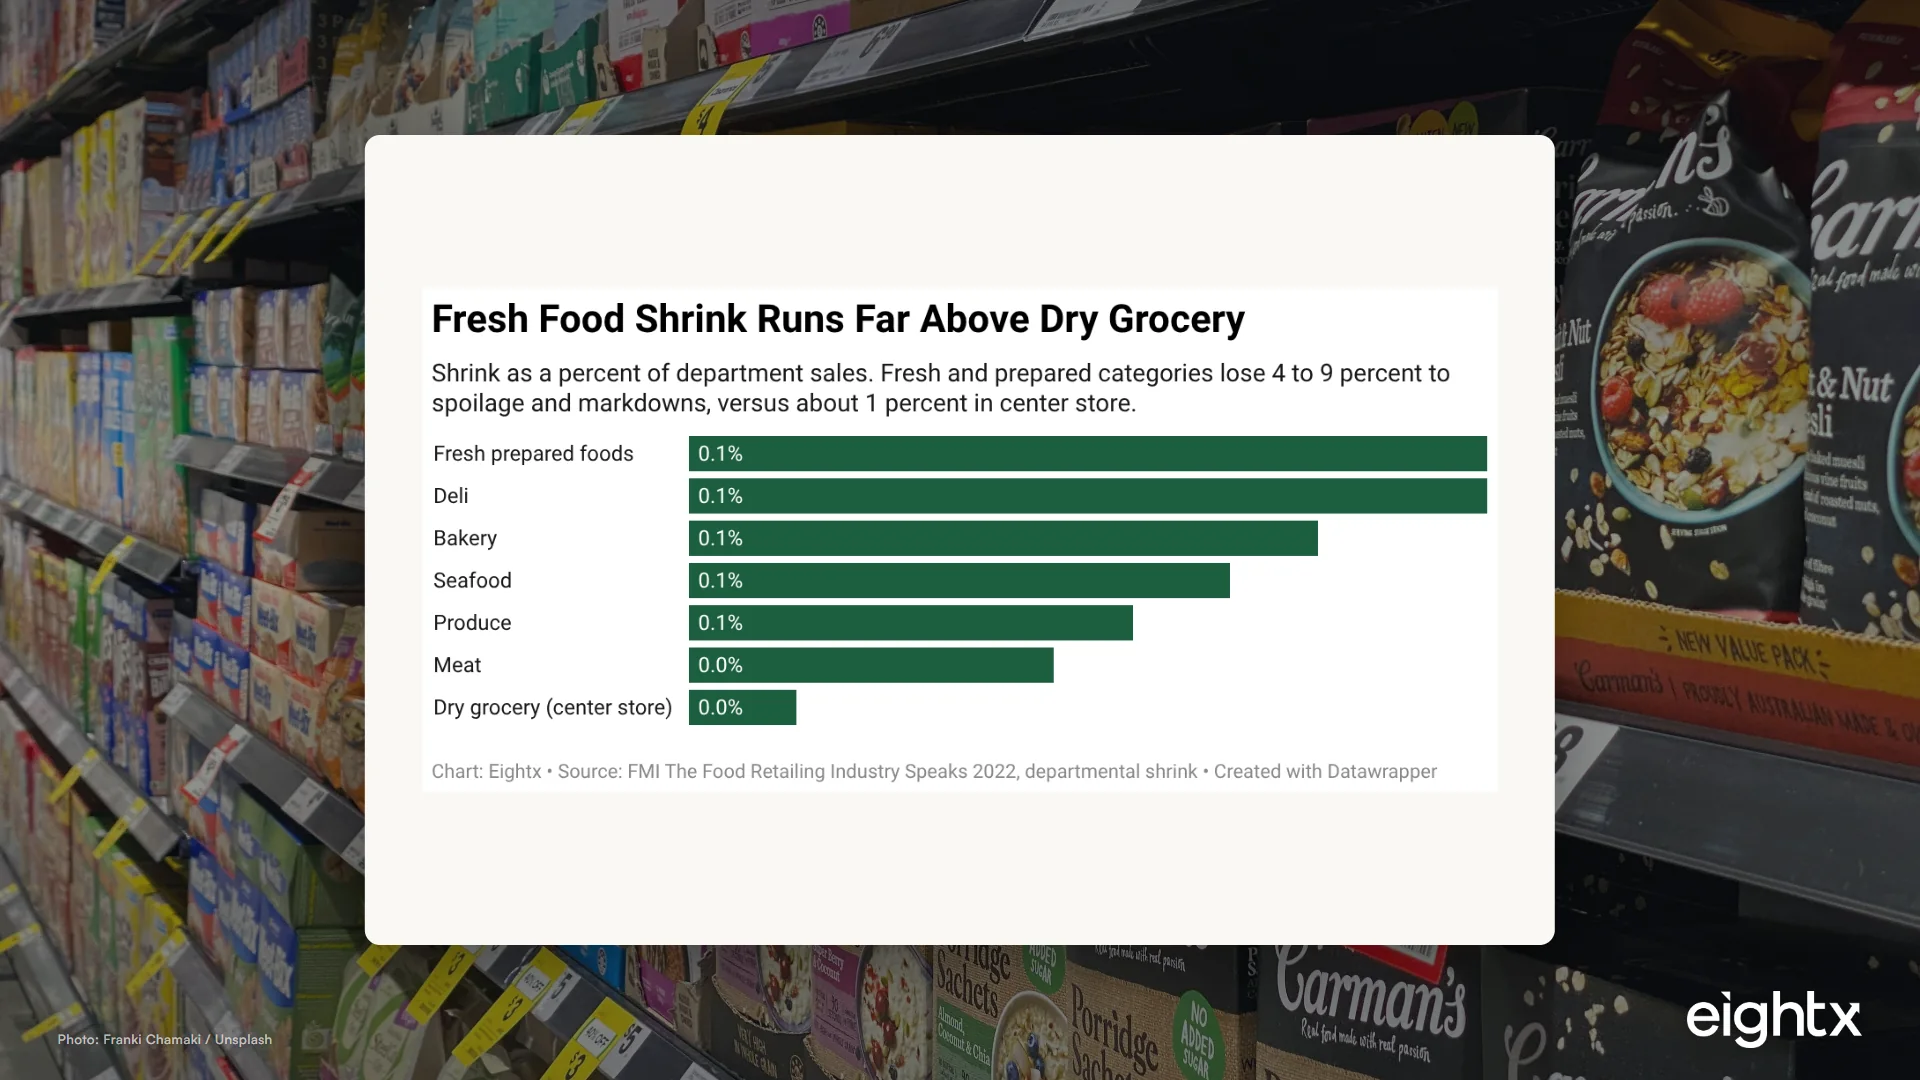
Start with the retail data, because it is the cleanest. Total US grocery store shrink runs about 3 percent of sales, with a typical range of 1 to 5 percent depending on the banner. But the store average hides where the damage happens. Fresh and perishable departments run far hotter. The FMI Food Retailing Industry Speaks data puts deli and fresh-prepared foods at 9 percent shrink, bakery at 7.1 percent, seafood at 6.1 percent, produce at 5 percent and meat at 4.1 percent, against roughly 1 percent for dry center-store grocery.
The department spread matters because perishables punch well above their weight in the shrink ledger. Fresh categories are roughly 38 percent of store sales but, by FMI-derived estimates, account for about 65 percent of total store shrink. Here is the full picture, with each department's shrink rate next to its approximate share of the store's total shrink dollars.
| Department | Shrink (% of department sales) | Share of total store shrink |
|---|---|---|
| Deli / fresh-prepared | 9.0% | ~14% |
| Bakery | 7.1% | ~6% |
| Seafood | 6.1% | ~5% |
| Produce | 5.0% | ~16% |
| Meat | 4.1% | ~18% |
| Dry grocery (center store) | 1.0% | ~14% |
When I talk to founders running a fresh or chilled brand, the thing they keep saying is that nobody warned them spoilage would be its own line in the P&L. They priced the product off a clean gross margin and never modeled the tail of stock that ages out in the back of a DC. That gap between the margin on the spec sheet and the margin in the bank account is the perishability tax, and it is almost always bigger than they guessed.
Physical loss is even higher than the financial shrink number suggests. USDA Economic Research Service measures supermarket shrink in weight and volume, and finds average physical loss of 12.6 percent for fresh fruit and 11.6 percent for fresh vegetables, with some items running far higher. A meaningful slice of every produce buy is destined for the bin before anyone buys it.
If you manufacture rather than retail, your number is different but the principle holds. Ambient packaged food typically carries 0.5 to 1 percent of net sales in unsaleables, while chilled, direct-store-delivery and short-code products commonly run 1 to 2 percent or higher, especially under strict retailer acceptance rules. Do not anchor on these averages, though. The only spoilage number that matters is the one you pull from your own write-off ledger, by SKU. Most food founders have never calculated it, which is exactly why it quietly bleeds margin.
Short shelf life caps your safe inventory buy
Here is the part operators miss most often. Shelf life is not a quality footnote. It is a hard ceiling on how much inventory you can responsibly own. The math is simple and unforgiving: your safe buy equals how fast you can sell through the code window, not how big an MOQ discount your co-packer dangles.
Say a product has a 90-day shelf life and your retailer wants two-thirds of that life remaining at the receiving dock. That leaves you roughly 30 days to actually ship it. If your sell-through is 30 days of stock, a 30-day buy is fine. A 60-day buy guarantees that half of it ages past the acceptance threshold and turns into a charge-back or a write-off. The discount you captured on the bigger PO gets eaten by the tail, and then some. We walk founders through this same trade-off on the manufacturing side in co-manufacturing cost and MOQ planning, where the MOQ that looks cheap per unit is often the most expensive decision in the P&L for a short-life SKU.
This is the structural reason food and beverage carries so little inventory. Our analysis of public 10-K filings puts the food, beverage and grocery median at just 38 days of inventory, against 140 days for apparel and 168 for beauty, more than a 4x spread across the slowest and fastest verticals. Food does not turn fast because operators are disciplined geniuses. It turns fast because the product would spoil if it did not, and retailers would reject it if it sat.
The smartest move we see operators make is to stop fighting the unit cost and start fighting the balance. The pattern we see again and again: a founder decides to hell with shaving another few points off the per-unit price, and instead drops the dollar amount of inventory sitting on hand. One operator we worked with ran bi-weekly orders for an entire year and held a tiny inventory balance the whole time. The answer that most founders do not want to hear is that the fix is to order more often. Weekly or bi-weekly POs are a time killer, but for a short-life SKU they give you the best chance to keep stock fresh without running out.
Retailer date-code rules: rejected before it sells
Even if your product is fresh and in spec, a retailer can refuse it for arriving with too little shelf life left. This is the rule most new food brands learn the hard way at a DC door. The industry convention is the one-third / two-thirds rule: the manufacturer is responsible for the first third of shelf life, and the retailer expects to sell inside the remaining two-thirds. In practice, that gets translated into category-specific minimums, often 70 to 75 percent of shelf life remaining at receipt, with charge-backs for product that arrives short.
The mechanics run on GS1 standards. Cases carry application identifiers for the best-by date (AI 15), sell-by date (AI 16) and expiration or use-by date (AI 17), and GS1 guidance requires that a case code reflect the shortest-shelf-life item inside it. DCs scan those codes on receipt and reject short-coded cases automatically. For a sense of how strict this can get, the federal GSA and DoD shelf-life program requires at least 85 percent of shelf life remaining at receipt, even tighter than typical grocery.
On the labeling side, the rules are looser than most founders assume. Under FDA, only infant formula carries a federally required use-by date. USDA FSIS date labeling on meat, poultry and eggs is generally voluntary. Sell-by and best-by are quality dates the manufacturer sets, not federal safety dates. But do not mistake "voluntary by law" for "optional in practice." Your retail partners enforce their own minimum-remaining-life rules contractually, and those are the dates that determine whether your truck gets unloaded or sent back.
| Product | Federal date-label status | Authority |
|---|---|---|
| Infant formula | Required (Use By, month/year) | FDA |
| Meat, poultry, eggs | Voluntary | USDA FSIS |
| Most packaged food and beverage | Voluntary (quality date) | FDA |
| Retailer acceptance (any product) | Contractual, not federal | Retailer / GS1 codes |
When we have worked through a first rejection with a brand, the lesson always lands the same way: the federal label was never the point. The date that gets your pallet turned away is the one in your retailer's vendor agreement, and most founders have never actually read that clause until a truck comes back.
Why thin margins make the spoilage tax bite harder
A point of spoilage costs a beauty brand far less than it costs a food brand, because the margin behind it is twice as thick. Average gross margin for food and beverage runs 30 to 49 percent for public brands and 40 to 55 percent for indie, versus 64 to 74 percent for beauty and 55 to 70 percent for supplements. Hershey is the cautionary tale: its reported gross margin collapsed from 47.3 percent to 33.5 percent in 2025 under a cocoa input shock. When your starting margin is already in the 30s, a 2-point spoilage hit is a much larger share of your gross profit than the same 2 points would be at a 70 percent margin.
There is a second cost on the other side of the same coin. Buy too cautiously to avoid spoilage and you stock out, and stock-outs are the largest source of preventable revenue loss in CPG. The healthy out-of-stock target is 2 to 5 percent, the all-retail average is 8 percent, and promoted items run 10 percent. On a $20M brand, running at the industry-average stock-out rate gates roughly $1.1M to $1.2M of revenue a year. So food and beverage operators are squeezed from both ends: buy too much and it spoils, buy too little and you stock out inside a code window you cannot extend. The art is sizing the buy to the shelf-life ceiling and the demand floor at the same time. The channel you sell through changes that math too, which we map in the CPG channel margin map. The good news from the retail side is that the margin is often better than founders fear: with a strong product, even after trade spend, 30 to 40 percent contribution through grocery is very doable, and 30 percent is roughly the lower bound in wholesale retail.
Spoilage is not a cost of goods footnote. It is a tax with three lines: the product that dies before it sells, the shelf life that caps how much you can safely buy, and the retailer date code that rejects good product for arriving too late. Food and beverage runs the tightest inventory clock in consumer because every one of those lines is metered by time, and time is the one input you cannot reorder.
What to do about it
- Calculate spoilage as a percent of COGS, by SKU, from your actual write-offs. Not the industry average. Your own ledger. You cannot manage a tax you have never measured.
- Cap each buy at what you can sell inside the code window. Take shelf life, subtract the retailer's minimum-remaining-life requirement, and that is your real selling window. Never order more than that window can move.
- Buy short-life SKUs in smaller, more frequent lots. Yes, you pay more per unit. You pay far less in spoilage and charge-backs, and you free up cash. Run both sides of the math before you sign the bigger PO.
- Run FEFO, first expired first out, not just FIFO. Lot and date-code tracking lets your 3PL or DC ship the oldest stock first so nothing quietly ages out in a back corner.
- Map every retail account's minimum-remaining-shelf-life rule before you ship. Build the 70 to 75 percent (or stricter) threshold into your production scheduling so you are never producing into a window you cannot deliver against.
- Model expected spoilage on each PO and let it, not the MOQ discount, set the order size. This is the single highest-impact change for most food brands.
This is the same working-capital discipline that sits at the center of our work as a fractional CFO for food and beverage brands: we treat shelf life as a financial constraint, not an ops detail, and we build it directly into the reorder model.
Sources and methodology
Inventory days figures are from Eightx analysis of public 10-K filings via SEC EDGAR, summarized in our average CPG inventory days by vertical study (food and beverage median 38 days, n=5; pooled median 127 days across 26 brands). Gross margin bands and the Hershey figure are from our average gross margin by CPG category work, drawn from public filings and client data. Stock-out benchmarks are from our average stock-out rate by vertical study. Departmental shrink rates are from FMI The Food Retailing Industry Speaks 2022. Produce physical-shrink figures are from USDA Economic Research Service. Date-code standards and case-labeling rules are from GS1 US guidance, and date-labeling law reflects FDA (infant formula use-by requirement) and USDA FSIS (voluntary meat, poultry and egg dating) policy. Manufacturer spoilage ranges are trade-practice estimates and should be treated as order-of-magnitude planning anchors, not precise figures. Confirm shelf life and retailer acceptance rules for your specific products with your co-manufacturer and your retail partners.
Frequently Asked Questions
what percent of cogs does food spoilage cost?
On the retail side, total grocery shrink runs about 3 percent of sales, and fresh departments run 4 to 9 percent. For food and beverage manufacturers, spoilage and unsaleables commonly run 0.5 to 1 percent of net sales for ambient products and 1 to 2 percent or more for chilled, DSD and short-code items. Build your own number from actual write-offs rather than the average.
how does shelf life limit how much inventory i can buy?
Shelf life is a hard ceiling on safe inventory. If a product has 90 days of life and a retailer wants two-thirds remaining at receipt, you have roughly 30 days to ship it before it gets rejected. Buying 60 days of stock guarantees write-offs. Your safe buy is capped by sell-through speed inside the code window, not by MOQ discounts.
what is the one-third two-thirds shelf life rule?
It is an industry convention where the manufacturer is responsible for the first one-third of shelf life and the retailer expects to sell within the remaining two-thirds. In practice retailers and distributors set category-specific minimums, often 70 to 75 percent of shelf life remaining at the DC, and reject and charge back product that arrives short.
do food and beverage products legally require expiration dates?
Mostly no. Under FDA rules only infant formula carries a federally required use-by date. USDA FSIS date labeling on meat, poultry and eggs is generally voluntary. Sell-by and best-by are quality dates set by the manufacturer, not federal safety dates, but retailers enforce them strictly through their own acceptance rules.
why does food and beverage carry so much less inventory than beauty?
Shelf life forces it. Food and beverage turns inventory in about 38 days versus 168 for beauty because product spoils and retailers reject short-coded stock. Beauty can hold long because its products last 12 to 36 months and 60 to 75 percent gross margins fund the carry. Food has thinner margins and a faster clock, so it cannot sit on stock.
how do i reduce spoilage cost in a food brand?
Cap each buy at the volume you can sell inside the code window, reorder in smaller and more frequent lots, run FEFO so the oldest stock ships first, and track lot and date codes against retailer minimums. Model expected spoilage on each PO and let that, not the MOQ discount, set order size. Treat spoilage as its own line in the inventory model.