
Financial Strategy
Helen of Troy (HELE) Teardown: A Roll-Up's Reckoning
Helen of Troy (Nasdaq: HELE) is a $1.8B consumer-products roll-up - OXO, Hydro Flask, Osprey, Drybar, Curlsmith, Olive & June - in two segments: Home and Outdoor (46.6%) and Beauty and Wellness (53.4%). FY2026 ended Feb 28, 2026 with a -$899M net loss driven by $885.9M in non-cash impairment charges. Adjusted operating income was still positive at $148.6M (8.3% margin). The real risk is $786M of debt against $19M cash and a FY2029 refinancing wall.
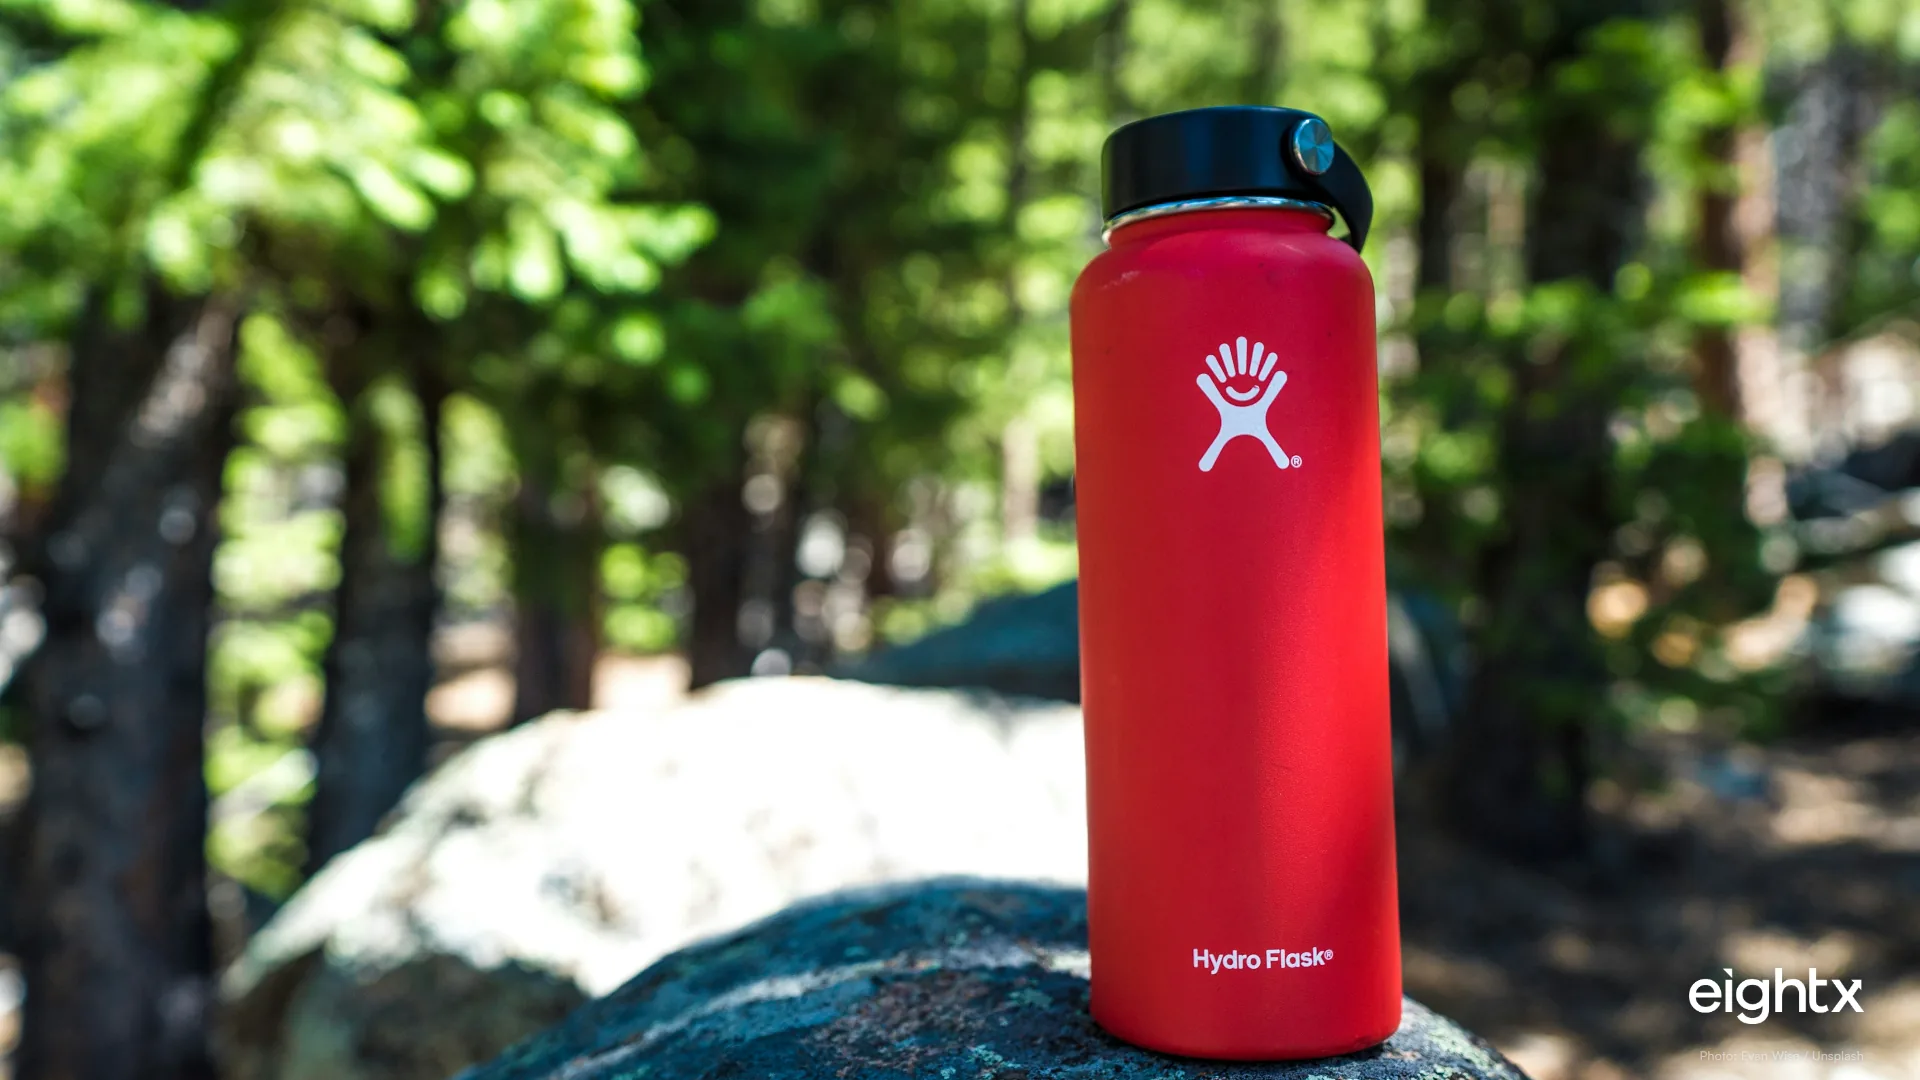
Key Takeaways
- FY2026 produced a -$899M GAAP net loss, but adjusted operating income was still positive at $148.6M: the entire GAAP loss is driven by $885.9M of non-cash goodwill and intangible impairment charges taken in every quarter of FY2026. Organic revenue declined -12.2% and gross margin compressed 220bps to 45.7% as $50.7M in tariff costs hit COGS directly. Source: HELE 10-K FY2026.
- Goodwill collapsed from $1,183M to $472M in a single fiscal year - a $706.5M write-down: impairments covered all four reporting units: Hydro Flask and Osprey in Home and Outdoor ($332.6M), and Health/Wellness, Drybar, Curlsmith, and Revlon in Beauty and Wellness ($553.3M). The trigger was HELE's own stock price declining so far that carrying value exceeded the company's entire enterprise value for all four quarters. Source: HELE 10-K FY2026.
- The balance sheet carries $786M of debt against $19M cash, with $735.5M due in FY2029: the credit facility was amended in November 2025 to extend the net-debt-to-EBITDA covenant holiday after GAAP metrics were destroyed by impairments - covenant stress is explicit. Net debt to adjusted EBITDA is approximately 3.8x. Source: HELE 10-K FY2026, credit facility amendment press release November 25, 2025.
- Tariffs added $50.7M to FY2026 COGS and triggered mass retailer order cancellations: China represented 57% of finished goods in FY2026 (down from 63% in FY2025). Retailers cancelled direct-import orders from China across beverageware, fans, and beauty appliances. Management targets reducing China-tariff-exposed COGS to 15-20% by end of FY2027. Source: HELE 10-K FY2026 MD&A.
- FY2027 guidance underwrites adjusted EPS of $3.25-3.75 - below FY2026's $3.55: the company issued its first public guidance in FY2026, and it does not signal a return to FY2024's $8.91 adjusted EPS. The operational thesis rests on Project Pegasus tail savings, sourcing diversification, and new CEO G. Scott Uzzell's FY2027 plan. Source: HELE Q4 FY2026 earnings release, April 23, 2026.
$885.9 million in impairment charges. A net loss of -$899 million. A goodwill balance that collapsed from $1,183 million to $472 million in twelve months. That is Helen of Troy's FY2026 (ended February 28, 2026) in three numbers.
The temptation with a number like -$899M net loss is to read it as a company in freefall. The reality is more surgical: the loss is almost entirely non-cash impairment charges triggered by a stock price that fell so far that HELE's own accounting rules required it to write down the brands it had paid peak multiples for during the 2020-2023 acquisition spree - Osprey, Drybar, Curlsmith, all of them. Strip out the impairments and adjusted operating income was still positive at $148.6M (8.3% margin). Operating cash flow was $171.1M. The business generates cash. The impairments are backward-looking; they tell you what those acquisitions were worth at the peak, not what the going business earns today.
That distinction matters enormously - but so does what it obscures. The real stress in this story is not the accounting. It is $786M of debt against $19M of cash, a $735.5M refinancing wall in FY2029, and organic revenue that declined -12.2% in FY2026 against a backdrop of $50.7M in tariff costs hitting the cost of goods sold directly. Three forces at once: a roll-up model tested by growth assumptions that did not hold, a China-sourcing base blindsided by tariff escalation, and a debt structure that leaves almost no room for error. This teardown reads all three.
Section 1 - The snapshot
Note: HELE's fiscal year ends on the last day of February. FY2026 = March 1, 2025 through February 28, 2026. FY2025 = March 1, 2024 through February 28, 2025. Adjusted operating income, adjusted EBITDA, and adjusted diluted EPS are non-GAAP measures per HELE's definition, excluding impairment charges, restructuring costs, and certain other items.
| Metric | FY2026 | Q4 FY2026 (most recent) | Q4 FY2025 (prior year) |
|---|---|---|---|
| Revenue | $1,786.3M | $470.0M | $485.9M |
| Revenue YoY | -6.4% reported / -12.2% organic | -3.3% | n/a |
| Gross margin | 45.7% | 44.6% | 48.6% |
| GAAP operating income (loss) | -$782.1M (-43.8%) | -$51.0M (-10.8%) | $2.0M (0.4%) |
| Adjusted operating income | $148.6M (8.3%) | n/a | n/a |
| GAAP net income (loss) | -$899.0M | ~-$54M (implied) | n/a |
| GAAP diluted EPS | -$39.08 | -$2.41 | $2.22 |
| Adjusted diluted EPS | $3.55 | $0.83 | $2.33 |
| Adjusted EBITDA | $185.8M (10.4%) | $48.5M (10.3%) | $84.3M (17.4%) |
| Operating cash flow | $171.1M | $111.3M | n/a |
| Total debt | $785.5M | $780.8M | n/a |
| Cash | $18.9M | $18.9M | n/a |
| Goodwill | $472.3M | $472.3M | $1,182.9M |
The five-year arc shows the GAAP/adjusted divergence precisely:
| Fiscal year | Revenue | YoY growth | Gross margin | GAAP op. margin | GAAP net income | Adj. diluted EPS |
|---|---|---|---|---|---|---|
| FY2022 (ended Feb 2022) | $2,223.4M | +5.9% | 42.9% | 12.3% | n/a (XBRL gap) | n/a |
| FY2023 (ended Feb 2023) | $2,072.7M | -6.8% | 43.4% | 10.2% | $143.5M (est.) | n/a |
| FY2024 (ended Feb 2024) | $2,005.1M | -3.2% | 47.3% | 13.0% | $168.6M | $8.91 |
| FY2025 (ended Feb 2025) | $1,907.7M | -4.9% | 47.9% | 7.5% | $123.8M | $7.17 |
| FY2026 (ended Feb 2026) | $1,786.3M | -6.4% | 45.7% | -43.8% | -$899.0M | $3.55 |
| Segment | FY2024 revenue | FY2024 % | FY2025 revenue | FY2025 % | FY2026 revenue | FY2026 % | FY2026 organic growth |
|---|---|---|---|---|---|---|---|
| Home and Outdoor | $916.4M | 45.7% | $906.3M | 47.5% | $832.9M | 46.6% | -8.6% |
| Beauty and Wellness | $1,088.7M | 54.3% | $1,001.3M | 52.5% | $953.4M | 53.4% | -15.6% |
| Total | $2,005.1M | 100% | $1,907.7M | 100% | $1,786.3M | 100% | -12.2% |
Section 2 - The business model: how they actually make money
Helen of Troy is not a DTC company. Approximately 74% of FY2026 net sales moved through traditional retail channels - mass merchandisers, drug chains, grocery, sporting goods, specialty retailers, and beauty supply. Online channels, including retailer-fulfilled e-commerce and direct brand-website sales, represented approximately 26% of revenue. Amazon was the largest customer at approximately 20% of consolidated FY2026 net sales, followed by Walmart at approximately 13% and Target at approximately 12%; the top five customers combined were approximately 50%.
That wholesale-first structure matters for understanding the impairment and the tariff story. When retailers like Target cancel direct-import orders from China in response to tariff uncertainty - which they did, across beverageware, fans, and beauty appliances in FY2026 - HELE has limited ability to reroute those orders through other channels. The company cannot pivot a Hydro Flask order from Target's Chinese import program to its own DTC website overnight. The revenue falls.
The two-segment model is built on three distinct margin engines. First, owned premium brands: OXO (kitchen tools with genuine design differentiation and broad retail shelf presence), Hydro Flask (premium insulated beverageware, though currently under competitive pressure), and Osprey (technical and lifestyle packs where demand held up even through FY2026). These generate the highest brand-level gross margins in the portfolio. Second, acquired prestige brands: Drybar, Curlsmith, and Olive & June - all three carry premium retail prices and higher gross margins than mass product, but all three required significant acquisition premiums and are now partially or fully impaired. Third, licensed brands: Braun, Revlon, Honeywell, and Vicks provide low-capital cash flow - HELE pays royalties and manufactures product under those names, keeping capex near zero while accessing established brand equity. The licensed model provides predictable cash margins but limited upside and still carries goodwill/intangible risk if the category underperforms.
Gross margin comes from brand pricing power and the absence of owned manufacturing. HELE sources 100% of products from third-party manufacturers, primarily in Asia. The no-capex model is a structural asset in normal times; in a tariff environment it becomes a liability because there is no manufacturing footprint to shift and every cost escalation passes through to COGS immediately.
Here is what the brands look like at the consumer level - including the brands under real competitive pressure. These videos are category and sentiment signals, not load-bearing financial facts.
@anngeliiika Hit or miss? 🤔💭 #drybar #drybarhair #hairtok #hairstyle #blowout
♬ Succession Main Theme (From "Succession") - Geek Music
@anngeliiika, 3.8M plays, 299.8K likes, 1,344 comments. The "hit or miss?" format is a social-proof signal for Drybar tools - 3.8M plays means the brand has active organic conversation at the consumer level even as the financial results show impairment. Social signal only.
@senystyn shoutout @OXO with a solid industrial design case study #design #designer #kitchen #cooking
♬ Quiet vlog fashionable chill out(1501557) - Yu Yaguchi
@senystyn, 122.9K plays, 11.6K likes, 352 comments. An organic design-community video praising OXO's industrial design - demonstrating the brand's continued cultural relevance outside of influencer-paid content. OXO is the portfolio brand not flagged as an impairment driver. Social signal only.
@keekswrld first dry bar experience did not disappoint 🤭🤭🤭 i asked for bouncy blowout with curled ends and pin curls!! #drybarhair #blowout
♬ original sound - ★
@keekswrld, 675.1K plays, 120.3K likes, 121 comments. A first-time Drybar salon experience going viral - the salon-side brand still generates enthusiastic organic content even as HELE's Drybar tools business is impaired. The salon brand (Drybar salons, a separate franchise entity from HELE's tool business) drives discovery for HELE's at-home tools. Social signal only.
Returns are quietly eating your margin. See by how much.
Get our Real Cost of Returns calculator: plug in your numbers, see the true hit per return.
Check your inbox. We'll send the Real Cost of Returns calculator shortly.
Section 3 - Strengths: the moat that is real
1. OXO and Osprey are genuine franchise brands with durable retail positions. OXO kitchen tools were not called out as an impairment driver in any quarterly or annual filing during FY2026. The brand occupies broad retail shelf in mass, specialty, and food/beverage channels. Osprey, despite its goodwill being impaired (reflecting acquisition-price overpayment, not brand health), was specifically described in the FY2026 10-K as showing "strong demand for technical, travel and lifestyle packs" - management's own language in a year where they were otherwise delivering bad news on every other brand. OXO and Osprey are the two assets in the portfolio most likely to hold value in a divestiture or sum-of-parts analysis. Source: HELE 10-K FY2026, MD&A segment commentary.
2. The no-capex sourcing model generates real adjusted cash earnings. Because HELE owns no manufacturing, adjusted operating income of $148.6M in FY2026 is largely unencumbered by maintenance capex on plant and equipment. Free cash flow was $131.9M for FY2026 and $103.1M in Q4 alone. Interest expense was $57.7M in FY2026 - the cash is covering debt service with room to spare even in the worst GAAP earnings year in the company's history. The model is capital-light in a way that many brand portfolios are not, and that matters when you are trying to service $786M of debt from operating cash flow. Source: HELE Q4 FY2026 earnings release (BusinessWire, April 23, 2026).
3. Project Pegasus delivered real margin expansion before the tariff shock reversed it. From FY2023 to FY2025, gross margin expanded from 43.4% to 47.9% - 450 basis points - on a revenue base that was declining. That is not commodity luck alone; it reflects real supply chain and SG&A restructuring. Approximately 15% of Pegasus's $75M-$85M in targeted savings are still expected to flow through in FY2027. The restructuring is done; the tail savings are a free option on the expense line. Source: HELE 10-K FY2026, Project Pegasus disclosure.
4. Olive & June is the genuinely DTC-native asset in an otherwise wholesale-first portfolio. Acquired for net initial cash consideration of $224.7M plus up to $15M contingent on EBITDA targets through 2027 (December 2024), Olive & June contributed $106.7M of revenue in its first ~41 weeks of HELE ownership (FY2026 inorganic contribution). The brand launched on Amazon in June 2025, expanding beyond its DTC roots into the largest e-commerce channel. Nail care is a category with structural tailwinds - high repeat-purchase frequency, low average ticket ($10-20 per product), and social commerce velocity. Olive & June is the brand in this portfolio most aligned with where consumer engagement and DTC economics are heading. Source: HELE FY2026 segment notes; Olive & June Amazon launch (Beauty Independent, June 2025).
Section 4 - Weaknesses: the cracks in the 10-Q
1. The roll-up model paid peak multiples and the goodwill became the liability when growth stalled. This is the defining fact of the FY2026 filing. HELE spent over $800M acquiring Osprey (~$414M), Drybar (~$255M), and Curlsmith (~$150M) between FY2021 and FY2023, plus Hydro Flask in FY2020 (~$410M) and Olive & June in FY2024 ($224.7M net cash + up to $15M earnout). Each acquisition was underwritten on growth assumptions that reflected the demand environment at time of purchase - a peak-era consumption backdrop that did not persist. The FY2026 10-K documents the consequence verbatim: "During each quarter of fiscal 2026, we concluded a goodwill impairment triggering event had occurred due to a further sustained decline in our stock price, resulting in our carrying value (excluding long-term debt) exceeding the Company's total enterprise value (market capitalization plus long-term debt). Additional factors that contributed to these conclusions included downward revisions to our internal forecasts and strategic long-term plans, which reflect the tariff policies in effect." The result: $885.9M of charges. Goodwill fell from $1,182.9M at February 28, 2025 to $472.3M at February 28, 2026. This is not accounting noise - it is a permanent write-down of the premium paid above intrinsic value on brands whose earnings did not meet the acquisition-time forecast. Source: HELE 10-K FY2026, goodwill impairment notes.
2. Hydro Flask is losing the insulated beverageware battle in real time. Four consecutive quarters of management calling out the brand by category: "cancellation of direct import orders in response to higher tariffs in the insulated beverageware category" (Q2 FY2026, October 2025); "the Organic business decrease was primarily driven by a decline in insulated beverageware" (Q3 FY2026, January 2026); "a net distribution loss year-over-year" in beverageware (Q2 FY2026). The competitive picture is well-documented: YETI continued growing at low-single-digit rates in 2025 while Hydro Flask was declining. The Stanley Quencher became a viral category moment that HELE did not own. Hydro Flask's impairment in H&O ($332.6M total, shared with Osprey, with Hydro Flask the primary driver per MD&A commentary) is the financial acknowledgment of a brand losing shelf space and consumer relevance at the same time. Source: HELE 10-K FY2026; HELE Q2 and Q3 FY2026 earnings releases.
3. $786M of debt against $19M cash, with a $735.5M refinancing wall in FY2029. The debt maturity schedule is the single most material structural risk in the credit story. Per the FY2026 10-K and prior filings: approximately $25M matures in FY2027, $25M in FY2028, and $735.5M in FY2029 - a single-year event larger than the company's estimated full-year adjusted EBITDA of approximately $202M. The average effective interest rate during FY2026 was 6.3% (5.7% at year-end per the 10-K) on $786M of debt, generating approximately $50-57M in annual interest expense. HELE has $432.3M of revolver availability, which provides near-term liquidity, but the revolver cannot be the answer to a $735.5M bullet. The real options are: sustained organic earnings recovery, a brand divestiture (the Southaven distribution facility sale - agreement signed Feb 27, 2026, closing in Q1 FY2027 on April 14, 2026 for $82M proceeds, with the ~$54.9M gain recognized in Q1 FY2027 - is a precedent), or a debt refinancing at rates that reflect whatever the credit market thinks of this portfolio in calendar 2028. The FY2026 10-K explicitly notes the credit facility was amended to extend the net-debt-to-EBITDA covenant waiver period because GAAP-based covenant metrics were destroyed by impairments. That is not a stable long-term credit structure. Source: HELE 10-K FY2026, Note on long-term debt; credit facility amendment press release (investor.helenoftroy.com, November 25, 2025).
4. China-sourcing concentration makes tariffs a structural headwind, not a one-time shock. HELE sources 100% of finished goods from third-party manufacturers - 57% of which came from China in FY2026, down from 63% in FY2025 but still the single largest country concentration. The FY2026 10-K Item 1A states verbatim: "All of our products are manufactured by unaffiliated manufacturers, most of which are located in China, Vietnam and Mexico; therefore, we face risks of significant tariffs or other restrictions continuing to be placed on imports from China, Vietnam or Mexico... Recently imposed tariffs have increased our cost of goods sold in fiscal 2026 and may continue to unfavorably impact our costs." The $50.7M direct COGS impact in FY2026 is the known number. The revenue cascade - retailers cancelling Chinese-origin orders across beverageware, fans, and beauty appliances to avoid tariff-loaded inventory - is harder to quantify but visible in every segment's organic revenue decline. Management's target of 15-20% China-tariff-exposed COGS by end of FY2027 is achievable but is a multi-year margin drag during the transition. Source: HELE 10-K FY2026, Item 1A Risk Factors and MD&A.
Section 5 - Opportunities and threats
The clearest opportunity in the HELE portfolio today is the brand divestiture pathway. The company's sum-of-parts valuation is obscured by the impaired goodwill and the GAAP loss - but the individual brands still have terminal values. OXO is a genuinely durable housewares franchise with broad retail distribution and no impairment flag. Osprey's pack business has "strong demand for technical, travel and lifestyle packs" per management's own FY2026 disclosure, even while the goodwill was written down. A strategic acquirer paying a sum-of-parts price for OXO alone would plausibly pay $400-500M+ given comparable consumer brand multiples. HELE has already demonstrated asset monetization discipline: the Southaven distribution facility sale (agreement signed Feb 27, 2026, closed April 14, 2026 in Q1 FY2027, $82M proceeds, with the ~$54.9M gain recognized in Q1 FY2027) is a tangible precedent. A brand divestiture would reduce the debt load and remove the FY2029 refinancing pressure more decisively than any operational improvement.
Olive & June is the second organic opportunity. The brand is the most DTC-native, most socially engaged, and most category-aligned with where consumer attention is flowing in beauty. McKinsey's 2026 State of Beauty projects approximately 5% annual growth through 2030 for the beauty sector. Nail care is a high-repeat, accessible price-point category where social commerce (TikTok, Instagram) generates organic demand efficiently. The Amazon launch in June 2025 opens a new distribution channel without requiring wholesale negotiation. If HELE can fund the brand without the portfolio debt dragging it down, Olive & June has the profile of a compounder.
The threats are concentrated in two areas. First, the FY2027 adjusted EPS guide of $3.25-3.75 is below FY2026's $3.55 - meaning management itself does not believe the bottom is in yet. The guide implies adjusted earnings will decline further before they recover. Second, the consumer trade-down environment was described by management as "expected to persist" in the Q3 and Q4 FY2026 releases - which is notable language because it means HELE's management is not modeling a consumer recovery as their base case. The brands most exposed to trade-down are the premium price-point SKUs: Hydro Flask, Drybar, Curlsmith, and Osprey. These are exactly the brands that drove the acquisition spree and carry the most remaining intangible value on the balance sheet.
The tariff trajectory is the wildcard that neither HELE's management nor any outside analyst can model with precision. The FY2026 10-K notes: "Some tariffs have been temporarily paused or adjusted, but the scope, magnitude and timing of future policies remain uncertain. In response to U.S. actions, other countries have imposed retaliatory tariffs on a broad range of goods, and further tariffs could be enacted by the U.S. or in response to international trade measures." If the China-to-US tariff regime stabilizes or partially reverses, the $50.7M annual COGS headwind becomes a potential gross margin tailwind in FY2027-FY2028. If it escalates, the sourcing diversification plan (target: 15-20% China-exposed COGS by FY2027 year-end) becomes more urgent and more expensive.
Section 6 - The macro environment
Helen of Troy is flying through four macro forces in FY2026-FY2027, and they do not point in the same direction.
The most immediate is tariff policy on US-China trade. HELE's entire product portfolio is manufactured by third parties in Asia - 57% in China as of FY2026. This is not a DTC brand with a domestic manufacturing story to tell; it is an asset-light wholesale business whose cost structure is fully exposed to import cost changes. The $50.7M in direct COGS from FY2026 tariffs is the documented first-order effect. The second-order effect - retailer order cancellations for Chinese-origin product - may be the larger revenue impact and is harder to see in any single line of the P&L.
Consumer spending on discretionary goods is the second force. Premium insulated beverageware (Hydro Flask), premium hair tools (Drybar, Curlsmith), and premium outdoor packs (Osprey) are all discretionary purchases. When consumers trade down - and management's language is that this is "expected to persist" - these are precisely the categories that see volume pressure first. YETI, the direct competitor in premium outdoor beverageware, showed more resilience in calendar 2025 (low-single-digit sales growth in Q3 2025) partly because its channel mix and price architecture differ from Hydro Flask's. The trade-down environment that hurt HELE did not hurt YETI at the same rate - a signal that the issue is partly brand-specific, not purely macro.
The retail channel consolidation is the third force. With approximately 50% of revenue concentrated in the top five customers, HELE's revenue trajectory is largely a function of three or four large retailers' open-to-buy decisions. When those retailers rebalance inventory - which they did explicitly in FY2026, citing "softer demand trends" - HELE's sell-in volume falls independent of end-consumer demand. This is a structural feature of wholesale-first consumer brands: the sell-in volatility is always larger than the sell-through volatility, especially at the extremes.
The beauty and wellness category growth trend is the tailwind that partially offsets the others. Industry projections for the global beauty sector remain approximately 4-5% annual growth through 2030. HELE's Beauty and Wellness segment is now 53.4% of revenue, and the DTC-native brands in the segment (Curlsmith, Olive & June) are in categories with structural demand growth. If the tariff and wholesale headwinds stabilize, the beauty mix shift gives HELE a genuine category-level tailwind to recover into.
Section 7 - The CFO verdict and the operator bridge
Here is the read on Helen of Troy from a CFO's vantage point.
Where the Street's read sits. Sell-side analyst coverage on HELE is sparse and bearish. The FY2027 adjusted EPS guide of $3.25-3.75 (midpoint $3.50) came in below FY2026's $3.55 actuals - and management has a history of guiding cautiously in a tariff-volatile environment rather than optimistically. No formal analyst consensus price target is anchored on a recovery model; the stock de-rated sharply through FY2026 as impairments triggered each quarter. The bull thesis from sell-side research notes: the sum-of-parts of the brand portfolio is worth more than the current equity market cap implies; OXO and Osprey are undervalued inside the consolidated structure; adjusted EPS of $3.55 covers interest expense several times over; and the impairments are non-cash and backward-looking. The bear thesis: the FY2029 refinancing wall is a hard constraint, the goodwill has already been written down by $885.9M but that does not mean more write-downs cannot occur if FY2027 results miss, and the Hydro Flask competitive thesis has not yet been resolved.
Where I agree and where I differentiate. The bulls are right that the impairments are non-cash and backward-looking. The $885.9M charge is the financial statement's acknowledgment of acquisition prices that were too high, not evidence that the operating business destroyed $885.9M of cash. Adjusted operating cash flow of $171.1M in FY2026 is the real number that matters for debt service. The bears are right about the FY2029 wall and about Hydro Flask. The insulated beverageware category did not get easier for Hydro Flask in FY2026 - it got harder, with distribution losses compounding the tariff and trade-down headwinds. The bears are right that more write-downs are possible if FY2027 misses the guide.
Where I differentiate from both: the actual open lever in this story is not operational improvement - it is the balance sheet. At $786M of debt and $19M of cash, the company has almost no room to make an acquisition mistake or absorb another tariff shock. The operational levers (Pegasus tail savings, sourcing diversification) are real but incremental; they do not change the FY2029 refinancing math. The lever that actually changes the credit story is a brand divestiture. HELE has already demonstrated willingness to monetize assets (Southaven distribution facility sale, $82M proceeds, agreement signed Feb 27, 2026, closed Q1 FY2027). A sale of OXO or Osprey - both genuinely durable franchises with no impairment flags - would generate cash that reduces the FY2029 wall and gives new CEO Scott Uzzell optionality that operating improvement alone cannot provide. Saying "just pay down debt from FCF" does not work here: at $131.9M of free cash flow against $786M of debt, organic deleveraging alone does not solve the FY2029 event. The math requires a capital event.
The operator bridge. Your $5-80M brand almost certainly has a version of the HELE pattern in miniature. Here it is clearly stated, because the tell is visible early in the numbers before it becomes the headline.
The HELE pattern is this: a business builds a house of brands through acquisition, paying multiples that assume the growth environment at time of purchase will persist. The goodwill accumulates on the balance sheet as a percent of total assets. Then the growth environment shifts - consumer demand normalizes, a tariff shock arrives, a competitor takes share in the hero category - and the earnings assumptions that justified the acquisition price are revised downward. When the earnings miss the acquisition-time model by enough, the impairment test fails. The goodwill write-down follows. The pattern is: goodwill as a percent of total assets was a leading indicator of the write-down risk; organic growth deceleration was the inflection point that revealed it.
I see a smaller version of this pattern in clients who have acquired a second or third brand to round out their portfolio. The second acquisition is almost always purchased when the first brand is performing well - so the acquirer's own earnings and the market's appetite for premium brands are both at an elevated point. The acquisition price reflects that elevated moment. When the first brand slows, the acquired brand is suddenly carrying more of the revenue expectations than it can support. The goodwill on the acquired brand starts to look uncomfortable relative to its actual earnings contribution.
The tell in your own numbers: what is goodwill (or purchase price allocation for intangibles) as a percent of your total funded assets? If it is above 30-40%, you are in a position where a meaningful earnings miss on the acquired brand produces impairment risk. Cross that against organic growth on the acquired brand for the last two years. If organic growth is decelerating while goodwill is above 30% of assets, you are running the HELE pattern in miniature - and you should model the impairment scenario before your auditors surface it.
The second tell is the cash balance against debt. HELE ran $19M of cash against $786M of debt for most of FY2026. That is not a net-debt-to-EBITDA ratio - it is a structural fragility. When your cash balance is less than one week of revenue and your debt is more than 3x adjusted EBITDA, a single bad quarter turns a debt-load problem into a covenant conversation. The covenant amendment that HELE required in November 2025 is what that conversation looks like in public; your version happens in a bank call that does not get disclosed in an 8-K.
Early-warning scorecard - five lines that catch the roll-up goodwill pattern 12 months early:
- Goodwill and intangibles as a percent of total funded assets, cross-referenced against organic growth by acquired brand: when goodwill exceeds 35% of total assets and the acquired brand is growing organically below 3%, run a simplified DCF sensitized to -10% revenue. If that scenario breaks your carrying value, the impairment test will eventually catch up to you. Do this before your auditors do it first.
- Organic revenue trend by brand, not consolidated: HELE's consolidated revenue decline of -6.4% in FY2026 masked an organic decline of -12.2% after excluding Olive & June's inorganic contribution. The inorganic revenue from new acquisitions will always make the consolidated number look better than the underlying business. Separate organic from inorganic, and track organic by acquired brand individually.
- Cash balance versus total debt on the day you sign the next acquisition: HELE's FY2025 year-end balance sheet showed $918M of debt and $19M of cash - a day before the Olive & June acquisition contribution started. The question is not whether you can fund the acquisition; it is whether the post-acquisition balance sheet can absorb a bad year without a covenant conversation. If cash is below 2% of revenue and debt is above 3x EBITDA, you cannot afford an acquisition miss.
- Gross margin trend on the acquired brand versus the acquisition thesis: HELE's gross margin fell 220bps in FY2026 from $50.7M in tariff costs. That is the extreme version. The pattern starts earlier: if the acquired brand's gross margin is below the thesis-model assumptions in year 2 of ownership, the DCF supporting the goodwill carrying value is already at risk. Check the acquired brand's gross margin independently - not blended into the consolidated P&L.
- Retailer concentration vs. open-to-buy lead time: when 50% of revenue sits with five customers, a single large-retailer inventory rebalancing decision becomes a double-digit revenue event for a quarter. HELE's Q1 FY2026 revenue was -10.8% year-over-year; the primary driver was retailer destocking, not end-consumer demand collapse. Know your top-5 customer concentration, and model what happens to your quarterly revenue if the largest one cuts open-to-buy by 20%. If the answer is a covenant breach, you need more customer diversification before the next acquisition.
If you want to run this scorecard against your own numbers - particularly if you are considering an acquisition or carrying meaningful goodwill from a prior deal - that is a fractional CFO conversation. The work takes a few hours. The cost of discovering the impairment risk in a bank conversation rather than proactively is the covenant amendment, the credit facility reductions, and the press release you would rather not be writing.
Related teardowns and live indexes
For more CFO-grade breakdowns of consumer-products brands, read our teardowns of YETI, Church & Dwight, and Kenvue. To see where Helen of Troy sits against the broader public-DTC universe and where its margin pressure shows up first, track the Public DTC Leaderboard, the DTC Cost-of-Goods Index, and Public DTC Inventory Days, the signal behind a roll-up's working-capital strain.
Sources and methodology
SEC EDGAR is the primary source for every financial figure in this post. Helen of Troy Limited (CIK 0000916789) files on SEC EDGAR. The specific filings used: 10-K FY2026 (filed 2026-04-23, accession 0000916789-26-000048); 10-K FY2025 (filed 2025-04-24, accession 0000916789-25-000012); 10-K FY2024 (filed 2024-04-24, accession 0000916789-24-000015); 10-K FY2023 (filed 2023-04-27, accession 0000916789-23-000017); 10-Q Q3 FY2026 (filed 2026-01-08, accession 0000916789-26-000009). Revenue, gross margin, operating income, net loss, operating cash flow, goodwill, segment figures, impairment breakdowns, and all balance sheet items are taken directly from these filings.
Impairment figures and triggers are quoted verbatim from the FY2026 10-K goodwill impairment notes and MD&A. The $885.9M total ($332.6M Home and Outdoor: Hydro Flask and Osprey reporting units; $553.3M Beauty and Wellness: Health/Wellness, Drybar, Curlsmith, and Revlon Businesses reporting units) is stated in the FY2026 10-K. The breakdown by asset type (goodwill $706.5M, indefinite-lived intangibles $97.0M, definite-lived intangibles $82.4M) is per the 10-K note disclosures. The triggering mechanism - "a further sustained decline in our stock price, resulting in our carrying value (excluding long-term debt) exceeding the Company's total enterprise value" - is quoted verbatim from the FY2026 10-K.
The credit facility amendment (reduction from $1.0B to $750M revolver; extension of the net-debt-to-EBITDA covenant waiver; change to interest coverage ratio covenant; effective November 25, 2025) is sourced to the HELE press release published at investor.helenoftroy.com on November 25, 2025. The $735.5M FY2029 debt maturity is from the FY2026 10-K debt schedule note. The average effective interest rate of 6.3% is the full-year FY2026 average per the 10-K; the year-end weighted average rate was 5.7% as of February 28, 2026.
Tariff costs of $50.7M are stated verbatim in HELE's FY2026 10-K MD&A: "Our cost of goods sold during fiscal 2026 included $50.7 million of additional pre-tax costs related to the changes in tariffs enacted." This is a management-disclosed figure, not an independent estimate. The China sourcing percentages (57% FY2026, 63% FY2025, 62% FY2024) are from the respective 10-K filings.
Project Pegasus savings estimates ($75M-$85M annualized, 60% COGS/40% SG&A) and the savings recognition cadence (25%/35%/25%/15% across FY2024-FY2027) are from the HELE 10-K FY2026. Restructuring charges by year are from the respective 10-K filings.
Analyst and sell-side commentary on HELE's FY2027 guide ($3.25-3.75 adjusted EPS midpoint vs. FY2026 $3.55 actuals) is sourced to the Q4 FY2026 earnings release (BusinessWire, April 23, 2026) and aggregated sell-side research notes and dated financial press (linked below). Q4 FY2026 adjusted EPS beat of $0.83 vs. Zacks consensus of $0.66 is from Yahoo Finance (April 24, 2026).
Olive & June acquisition (net initial cash consideration of $224.7M plus up to $15M contingent earnout on EBITDA targets through 2027, December 16, 2024; $106.7M FY2026 inorganic revenue contribution) is from the HELE FY2026 10-K Note 6 and the Olive & June acquisition press release (investor.helenoftroy.com, December 16, 2024). Amazon launch in June 2025 is sourced to Beauty Independent (June 20, 2025).
Social signals are colour only. The three TikTok embeds in Section 2 are brand and category sentiment signals. @anngeliiika (3.8M plays, 299.8K likes) is an organic consumer review of Drybar tools. @senystyn (122.9K plays, 11.6K likes) is a design-community video praising OXO industrial design. @keekswrld (675.1K plays, 120.3K likes) is a first-time salon experience video. All three are category and sentiment indicators, not evidence of any revenue or margin figure.
Limitations. HELE does not disclose brand-level revenue (Hydro Flask revenue as a standalone line is not in the 10-K). Adjusted operating income, adjusted EBITDA, and adjusted diluted EPS are non-GAAP measures per HELE's definition; year-over-year comparisons use HELE's own reconciliation tables. The net-debt-to-adjusted-EBITDA ratio of approximately 3.8x is an independent estimate using HELE's disclosed adjusted operating income ($148.6M) plus estimated D&A ($53.3M) as an EBITDA proxy; HELE does not state this ratio explicitly in filings. FY2022 net income is not reliably available from XBRL - EDGAR returned stale period tags, and the estimate is flagged accordingly in the multi-year arc table. The FY2029 refinancing math reflects debt maturities as of the FY2026 10-K; actual maturities will reflect any paydowns or refinancings completed after February 28, 2026. This post reflects filings and disclosures current through June 25, 2026.
Frequently asked questions
what caused helen of troy's $899 million loss in fy2026?
The loss is almost entirely non-cash. Helen of Troy recorded $885.9M in goodwill and intangible impairment charges across all four quarters of FY2026, triggered each time the company's stock price declined to the point where carrying value exceeded enterprise value. The underlying adjusted operating income was still positive at $148.6M. Organic revenue also fell -12.2% and $50.7M in tariff costs hit gross margin, but neither accounts for the scale of the GAAP loss. Source: HELE 10-K FY2026.
how much debt does helen of troy have?
At February 28, 2026, Helen of Troy had $785.5M in total debt against $18.9M in cash - net debt of approximately $767M. The debt is primarily term loans and revolving credit under an amended credit agreement. The revolver was reduced from $1.0B to $750M capacity in November 2025. The critical maturity is $735.5M due in FY2029 - a single-year refinancing event larger than the company's full-year adjusted EBITDA of approximately $202M. Source: HELE 10-K FY2026 and credit facility amendment.
is hydro flask losing market share?
The filings indicate Hydro Flask is under significant competitive pressure. Every quarter of FY2026, management cited insulated beverageware as a drag - "continued competition, a net distribution loss year-over-year and cancellation of direct import orders in response to higher tariffs" (Q2 FY2026). The Home and Outdoor segment, which houses Hydro Flask, received $332.6M in impairment charges. The brand faces pressure from YETI, Stanley (Quencher), and private label across mass retail. Source: HELE 10-K FY2026, Q2 FY2026 earnings release.
what is project pegasus helen of troy?
Project Pegasus was Helen of Troy's multi-year restructuring program, initiated in FY2023 and completed in Q4 FY2025. It targeted $75M-$85M in annualized savings (60% COGS, 40% SG&A). Total restructuring charges were $18.7M in FY2024 and $14.8M in FY2025. The savings helped gross margin expand from 43.4% (FY2023) to 47.9% (FY2025). The brutal irony: Pegasus completed just as tariff escalation began in calendar 2025, erasing most of the margin gains. Tail savings of approximately 15% of the target are expected in FY2027. Source: HELE 10-K FY2026.
what segments does helen of troy operate?
Helen of Troy operates two segments. Home and Outdoor ($832.9M, 46.6% of FY2026 revenue): OXO kitchen tools, Hydro Flask insulated beverageware, Osprey packs, and licensed Honeywell/Vicks/PUR products. Beauty and Wellness ($953.4M, 53.4%): Drybar hair tools, Curlsmith hair care, Hot Tools, licensed Braun and Revlon hair tools, licensed Vicks/Honeywell wellness, and Olive & June nail care (acquired December 2024). Source: HELE 10-K FY2026.
why was helen of troy's credit facility amended?
HELE amended its credit facility on November 25, 2025 to extend the net-debt-to-EBITDA covenant waiver and change the interest coverage ratio covenant. The amendment was necessary because the $885.9M in FY2026 impairment charges destroyed GAAP-based financial ratios used in covenant calculations. The amendment reduced revolver capacity from $1.0B to $750M and allowed impairment charges to be excluded from covenant calculations. The filing explicitly cites "continuation of negative sales trends and the unfavorable impact of tariffs" as context. Source: HELE credit facility amendment press release, November 25, 2025.
how much of helen of troy's sourcing comes from china?
In FY2026, approximately 57% of finished goods were manufactured in China (down from 63% in FY2025 and 62% in FY2024). All products are manufactured by unaffiliated third-party manufacturers - Helen of Troy owns no production facilities. Total Asia-sourced finished goods represented approximately 83% in FY2026 and 79% in FY2025 per the filings. Management targets reducing China-tariff-exposed COGS to 15%-20% by end of FY2027. The FY2026 10-K explicitly states tariffs added $50.7M to cost of goods sold. Source: HELE 10-K FY2026 and 10-K FY2025.
what is helen of troy's channel mix - is it a dtc brand?
Helen of Troy is primarily a wholesale brand, not a DTC company. Approximately 74% of FY2026 net sales ran through traditional retail channels - mass merchandisers, drug chains, grocery, sporting goods, specialty, and beauty supply. Online channels (including retailer-fulfilled online plus direct brand-site sales) represented approximately 26%. Amazon was the largest customer at approximately 20% of FY2026 net sales, followed by Walmart at approximately 13% and Target at approximately 12%; the top five customers combined were approximately 50% of revenue. Source: HELE 10-K FY2026.