
Financial Strategy
Home Goods Unit Economics: A CFO's Margin Playbook
Home-goods gross margin runs 30-56% (median ~42%), but the real number is CM3, your per-order profit after fulfillment, returns, and paid acquisition, which lands at just 10-20%. With CAC at $60-120 and 7-15% repeat purchase, payback usually has to clear on the first order's contribution margin.
Key Takeaways
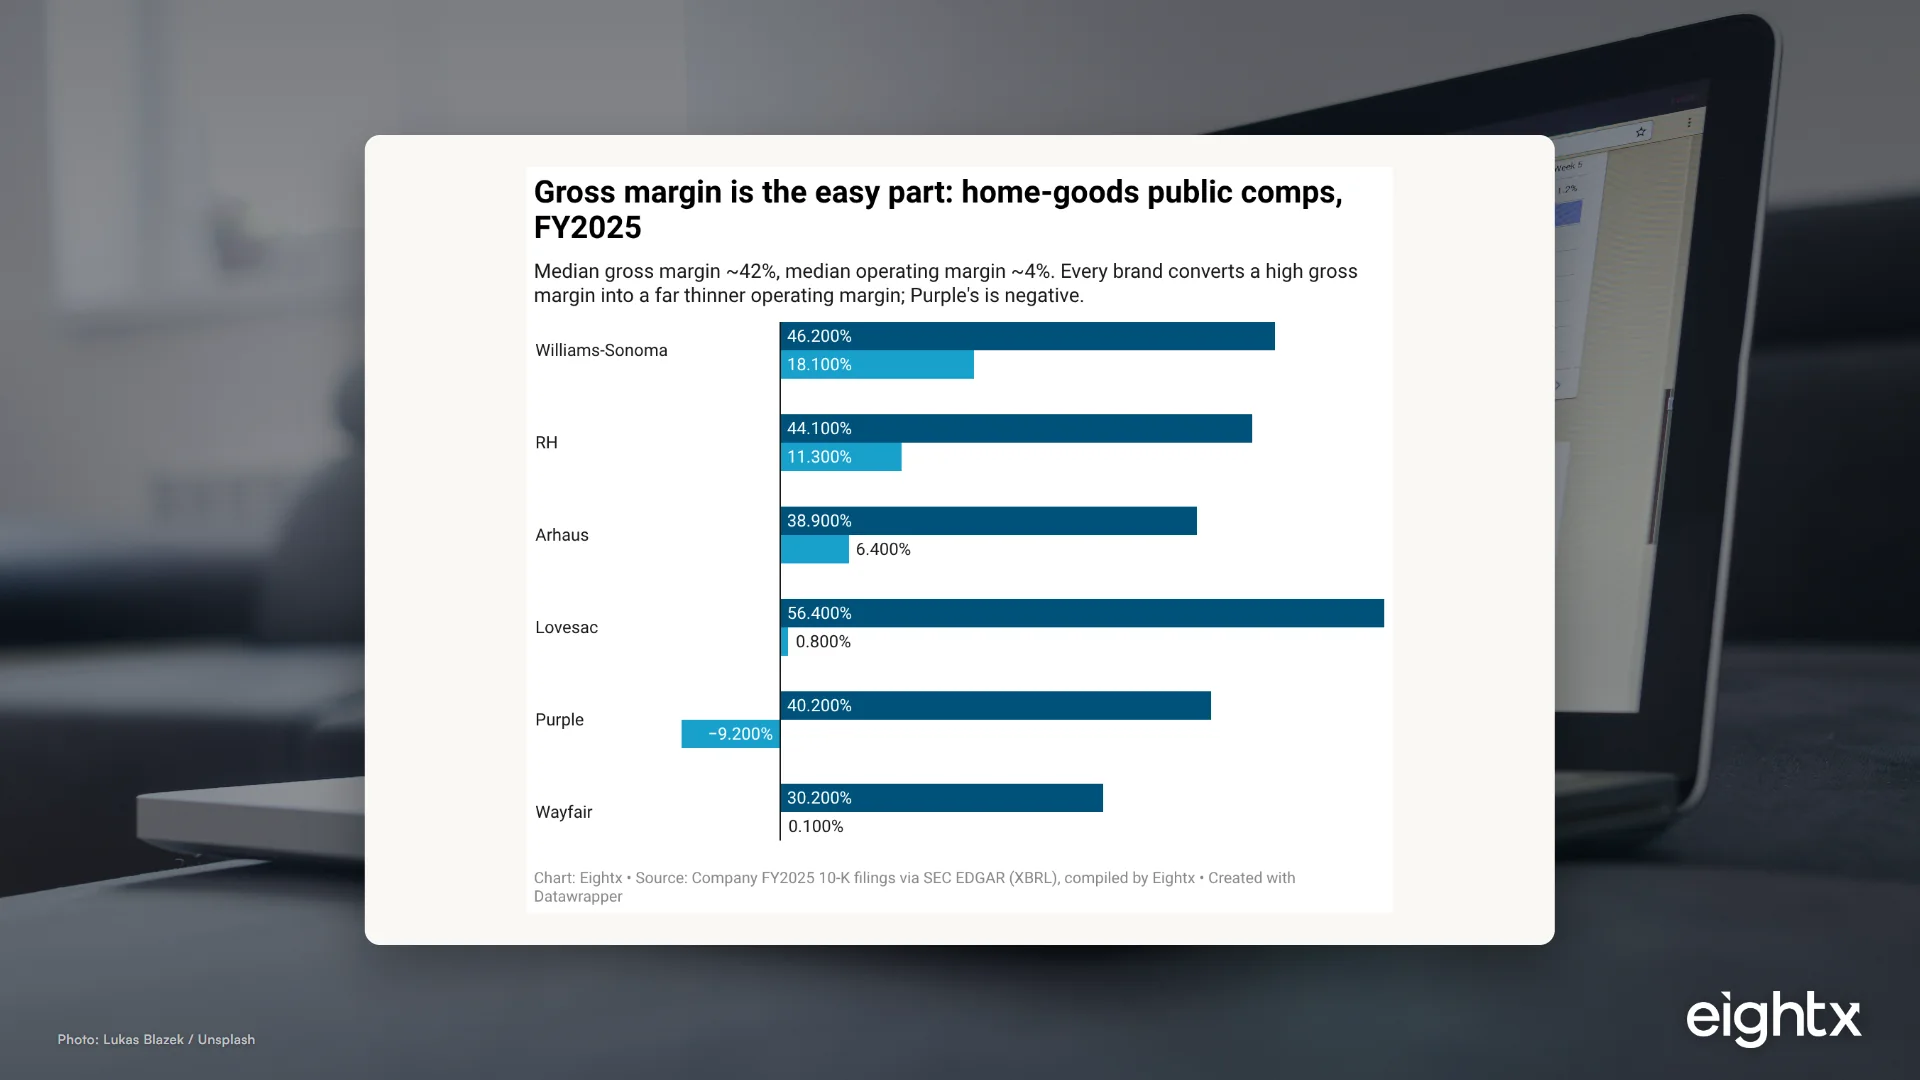
- Home goods gross margin runs 30-56% with a ~42% median across six public comps (FY2025 10-Ks): Lovesac 56.4%, Williams-Sonoma 46.2%, RH 44.1%, Purple 40.2%, Arhaus 38.9%, Wayfair 30.2%. Gross margin is the easy, answerable part.
- Median operating margin is only ~4% despite that 42% gross-margin median. Williams-Sonoma converts 46% gross into 18.1% operating; Purple converts 40% gross into -9.2%. The whole story lives below the gross line.
- The contribution-margin waterfall is where you live or die: CM1 40-55%, CM2 28-40%, CM3 just 10-20%. CM3 (real per-order profit after paid acquisition) is the number that decides whether the brand survives.
- CAC runs $60-120 on a category with 7-15% repeat purchase. Low frequency means CAC payback usually has to clear on the first order's contribution margin, not a fast second order.
- AOV (~$264 furniture-weighted) is the saving grace; returns (22.7% furniture) are the silent CM2-killer. One big-and-bulky return can cost more than the product's gross margin.
Most home-goods founders ask one question first: "is my 45% gross margin healthy?" It is the right instinct and the wrong place to stop. In this vertical, gross margin is the easy line. The six public comps run from 30% to 56% with a roughly 42% median, yet the median operating margin across those same companies collapses to about 4%. The entire unit-economics problem lives in the lines underneath gross margin, in a contribution-margin waterfall that bleeds 20-30 points of margin between the gross line and real per-order profit. This guide hands you the five numbers to compute, the 2026 benchmark band for each, and the decision each one drives.
Gross margin is the question every founder asks, and the wrong one to stop at
Gross margin (CM1, revenue minus the landed cost of goods and discounts) is the most answerable number in home goods. The FY2025 10-Ks give you a clean comp set: Lovesac at 56.4%, Williams-Sonoma at 46.2%, RH at 44.1%, Purple at 40.2%, Arhaus at 38.9%, and Wayfair at 30.2%. The median lands near 42%, and for an owned-inventory DTC brand the operating target band is 40-55%. If you are inside that band, gross margin is not your problem.
Here is why it is the wrong place to stop. That ~42% gross-margin median converts to roughly a 4% operating-margin median, a gap of about 38 points. Williams-Sonoma keeps 18.1% of its 46% gross margin as operating margin; Purple turns a 40% gross margin into a -9.2% operating margin, a $43M operating loss on $469M of revenue. Same category, similar gross margins, a 27-point operating-margin spread. When I talk to founders running a home-goods brand this size, the thing they keep saying is "my margins are fine," and they are right about the gross line and missing the whole story below it.
So the real unit-economics work in home goods is not defending gross margin. It is understanding what happens between the gross line and the bottom line, which is exactly what the contribution-margin waterfall measures.
The contribution-margin waterfall: CM1 to CM2 to CM3
The waterfall is the single most useful frame for a home-goods brand, because it shows you where the margin actually goes. You start at CM1, your gross margin. You subtract variable fulfillment, freight, returns, and payment fees to get CM2. Then you subtract paid acquisition to get CM3, the real per-order profit. In home goods the bands are CM1 40-55%, CM2 28-40%, and CM3 just 10-20%.
Walk the steps. CM1 to CM2 is where big-and-bulky hurts: outbound freight on furniture and bulky decor, the cost of returns, and payment fees pull a 47% gross margin down to roughly 34%. CM2 to CM3 is paid acquisition: a $60-120 CAC spread across your orders pulls that 34% down to roughly 15%. That ~15% is the number that decides whether the brand survives. When we talk to operators about this, the line that lands is simple: gross margin is the easy part, and CM3 is the real per-order profit. Almost everyone tracks CM1. The brands that scale profitably are the ones watching CM3.
| Layer | What it is | Typical home-goods band | What it subtracts |
|---|---|---|---|
| CM1 (gross margin) | Revenue minus COGS and discounts | 40-55% | Product cost + discounts |
| CM2 | CM1 minus variable fulfillment | 28-40% | Fulfillment + freight + returns + payment fees |
| CM3 | CM2 minus paid acquisition | 10-20% | Customer acquisition cost (paid media) |
The practical takeaway: if your CM3 is negative, no amount of gross-margin defense fixes it. You fix it by moving CM2 (fulfillment, freight, returns) or CAC, and the order you attack them in is the rest of this guide.
Returns are quietly eating your margin. See by how much.
Get our Real Cost of Returns calculator: plug in your numbers, see the true hit per return.
Check your inbox. We'll send the Real Cost of Returns calculator shortly.
CAC, payback, and the low-frequency trap
DTC home-goods CAC clusters at $60-120, with the Home & Garden median sitting near $60 across 4,000-plus Shopify brands (Polar Analytics). Growth brands leaning hard on Meta and TikTok routinely run $80-100 or more, and DTC CAC overall has risen 25-40% since 2021. None of that is unusual. What makes home goods different is what happens after the first order.
Repeat purchase rate for durable goods and home decor is just 7-15%, against a cross-DTC average near 18.8% (BS&Co). That low frequency is the structural fact of the category. You are not selling a consumable that comes back every six weeks. You are selling a couch, a rug, a bed frame, and most customers do not buy again for years. The practical consequence is that CAC payback in home goods usually has to clear on the first order's contribution margin, not on a fast second order. The generic "3-6 month payback" benchmark you read elsewhere quietly assumes repeat purchases that this category does not produce.
That changes how aggressively you can scale paid. The pattern we see again and again is a brand that scales spend assuming a healthy 12-month LTV, then runs out of cash because the second order never shows up at the rate the model assumed. On LTV:CAC, the 3:1 floor still holds as the consensus minimum, but home-goods sources cluster at 2-3x, below the 3.4:1 cross-vertical median and well below the 5.6:1 top quartile, because low repeat caps lifetime value. If you want the cross-vertical comparison in detail, our average ecommerce LTV:CAC ratio by vertical breakdown sits right next to this. The rule of thumb: in home goods, price the customer as if the first order is most of the relationship, because statistically it is.
AOV and returns: the two levers that actually move CM2 and payback
Two levers do the heavy lifting in home goods, and they pull in opposite directions. The first is AOV, and it is the structural advantage that makes the math survivable. Furniture-weighted DTC AOV runs about $240-270 (Mida puts Home & Furniture at $264; Flowium puts Home & Garden at $240-260), while small decor and textiles run far lower at $50-150. A high AOV is exactly what lets a home-goods brand absorb a $90 CAC that an otherwise identical $40-AOV supplement brand could never carry. Run the math: $264 AOV at a 34% CM2 throws off about $90 of first-order contribution, which is precisely enough to cover a $90 CAC on order one. AOV is the lever that fixes CAC payback when repeat cannot.
The second lever is returns, and it cuts the other way. Furniture online return rates run about 22.7%, bedding and bath 21.3%, and home decor 19.4% (Eightx 2026). On big-and-bulky, reverse logistics on a single couch can cost more than the product's entire gross margin once you count freight back, inspection, repackaging, and write-downs on opened goods. That is why a 22.7% return rate quietly moves a brand from a healthy CM2 to a broken one. When we talk to operators here, the figure that stops the room is that one couch return can erase the margin on the product entirely. The fixes are unglamorous and they work: better PDP sizing and dimension content, room-scale visualizers, stricter (clearly communicated) return windows on bulky SKUs, and bundling or sets to lift AOV at the same time.
| Sub-category | Online return rate (%) |
|---|---|
| Furniture | 22.7 |
| Bedding & bath | 21.3 |
| Home decor | 19.4 |
| Kitchen appliances | 15.8 |
| Garden equipment | 14.2 |
Why you're profitable on paper but cash-poor
Plenty of home-goods brands run a healthy CM3 and still feel broke, and that is not a contradiction. It is working capital. Inventory turns in this category run about 2.5-3.3x, which is slow, and that is before you add supplier deposits and the long lead times that come with overseas manufacturing of bulky goods. You are paying for inventory months before you sell it, financing the gap out of your own cash, and the slower the turns the bigger that gap gets.
When I talk to founders at this stage, the version I hear most is "we're profitable, the P&L says so, but every dollar is tied up in a container on the water or a pallet in the 3PL." That is the structural cash trap of home goods: even at a healthy CM3, slow turns plus deposits plus lead times tie up cash. The fix is not a margin fix, it is a planning fix: tighter demand forecasting to avoid overbuying slow SKUs, negotiated supplier terms to shrink the deposit drag, and a cash-flow model that plans around the turn cycle rather than the P&L. The underlying topic carries across categories, which is why ecommerce unit economics and inventory planning are the sister reads to this one.
The CFO scorecard: benchmark your brand in five numbers
Here is the action list. Pull these five numbers for your own brand and compare each to the 2026 home-goods band.
- Gross margin (CM1). Target 40-55%. If you are inside it, move on. If you are below 40%, fix landed cost or pricing before anything else.
- Contribution margin (CM2). Target 28-40%. This is gross margin minus fulfillment, freight, returns, and payment fees. If CM2 is below 28%, returns or freight are your leak.
- Real per-order profit (CM3). Target 10-20%. This is CM2 minus paid acquisition. If CM3 is negative, you cannot scale spend until you fix CM2 or CAC.
- CAC payback. In home goods, check whether first-order CM2 covers your CAC, because 7-15% repeat means you cannot lean on a second order. If it does not clear on order one, the model is fragile.
- LTV:CAC. Target 2-3x for home goods (3:1 is the universal floor). Below 2x you are buying unprofitable customers; above ~5x you are likely under-investing in growth.
Gross margin is the easy part of home-goods unit economics. The whole story lives in the waterfall underneath it: a 47% gross margin that becomes 34% after fulfillment and returns, then 15% after paid acquisition. CM3 is the number that decides whether you survive, and it is the one almost no founder is watching.
Find your binding constraint, the single number furthest below its band, and fix that one first. For most home-goods brands it is returns dragging CM2 or CAC outrunning a low repeat rate, not gross margin. If you want a second set of eyes on which constraint is actually binding for your brand, that is exactly the conversation a fractional CFO is built for, and the home goods financial benchmark report is the full vertical data set behind every number here.
Sources and methodology
The vertical-specific figures in this guide come from the published Eightx Home Goods Financial Benchmark report, which computed its numbers from SEC EDGAR XBRL FY2025 10-K filings for six public home-goods companies. Gross margin (gross profit divided by revenue) and operating margin (operating income divided by revenue) were pulled directly from those filings: Williams-Sonoma 46.2% / 18.1%, RH 44.1% / 11.3%, Arhaus 38.9% / 6.4%, Lovesac 56.4% / 0.8%, Purple 40.2% / -9.2%, and Wayfair 30.2% / 0.1%. The median gross margin is ~42% and the median operating margin is ~4%.
The contribution-margin bands (CM1 40-55%, CM2 28-40%, CM3 10-20%) are Eightx 2026 operator bands, also published in the benchmark report. The illustrative waterfall (47% to 34% to 15%) uses midpoints inside those bands for a single clean read; the table beside it shows the full ranges.
The CAC figure of $60-120 (Home & Garden median near $60) comes from Polar Analytics' 2026 benchmark set across more than 4,000 Shopify brands. AOV bands come from Mida 2026 (Home & Furniture $264) and Flowium 2026 (Home & Garden $240-260). Repeat purchase rate of 7-15% comes from BS&Co's 2026 repeat-purchase benchmarks (cross-DTC average ~18.8%). LTV:CAC figures (home goods 2-3x; 3.4:1 cross-vertical median; 5.6:1 top quartile) come from compiled 2026 benchmarks, surfaced via the live Eightx LTV:CAC-by-vertical post.
Return rates by sub-category (furniture 22.7%, bedding and bath 21.3%, home decor 19.4%, kitchen appliances 15.8%, garden equipment 14.2%) are from Eightx's 2026 return-rate analysis, built on NRF 2025 data plus carrier and 3PL inputs. Inventory turns of 2.5-3.3x are from the benchmark report.
The operator-voice framing in this post is anonymized Eightx house perspective from working with DTC home-goods founders, not any single client. No brand or client is named, and no per-store data was fabricated. Where a number could not be re-derived, this guide cites the published benchmark pillar rather than restating a raw filing.
Frequently asked questions
what is a good gross margin for a home goods brand?
For owned-inventory DTC home-goods brands, target a gross margin of 40-55%. The six public comps run 30-56% with a ~42% median (Lovesac 56.4%, Williams-Sonoma 46.2%, Wayfair at the low end with 30.2%). If you are inside 40-55%, gross margin is not your problem. The problem is almost always below the gross line.
what should contribution margin be for a home goods dtc brand after fulfillment and returns?
That is CM2, and the band is 28-40%. You start from gross margin (CM1, 40-55%) and subtract variable fulfillment, freight, returns, and payment fees. In big-and-bulky home goods, freight and returns eat the most, which is why CM2 lands a good 10-15 points below gross margin.
what is a healthy ltv:cac ratio for a home goods ecommerce brand?
3:1 is the consensus floor. Home-goods sources cluster at 2-3x because low repeat purchase caps lifetime value, against a 3.4:1 cross-vertical median and a 5.6:1 top quartile. If you are above ~5:1 in home goods you are probably under-investing in growth.
how long is the cac payback period for a home goods brand?
The generic cross-DTC benchmark is 3-6 months, but in home goods that framing misleads. With 7-15% repeat purchase, you usually cannot count on a fast second order, so CAC payback realistically has to clear on the first order's contribution margin. If first-order CM2 does not cover CAC, the math does not work no matter how patient you are.
what are the typical cogs components for a home goods brand selling dtc?
Landed product cost (manufacturing plus inbound freight and duties) is the big one, then discounts and promotions. Everything else (outbound fulfillment, big-and-bulky freight, returns, payment fees) is variable cost that sits below gross margin in CM2, not inside COGS. Keeping that line clean is what lets you read the waterfall correctly.
why is my home goods operating margin so much lower than my gross margin?
Because the gap between gross and operating margin in this vertical is huge: a ~42% gross-margin median collapses to a ~4% operating-margin median. Fulfillment, freight, returns, paid acquisition, and overhead all sit between those two lines. Williams-Sonoma keeps 18.1% of a 46% gross margin; Purple turns a 40% gross margin into a -9.2% operating margin. Same category, the difference is everything underneath gross.
what is cm1 vs cm2 vs cm3 and which one actually matters for home goods?
CM1 is gross margin (revenue minus COGS and discounts). CM2 is CM1 minus variable fulfillment, freight, returns, and payment fees. CM3 is CM2 minus paid acquisition: it is your real per-order profit. CM3, typically 10-20% in home goods, is the one that decides whether you survive.
how much does a furniture return actually cost me in margin?
On big-and-bulky, a single return can cost more than the product's entire gross margin once you count reverse freight, inspection, repackaging, and write-downs on opened goods. With a 22.7% furniture return rate, returns quietly move a brand from a healthy CM2 to a broken one, which is why returns are the single highest-impact CM2 fix in home goods.
what aov do i need to make a $90 cac work in home goods?
AOV is the lever that fixes CAC payback when repeat cannot. A ~$264 AOV at a 34% CM2 generates about $90 of first-order contribution, which is exactly enough to absorb a $90 CAC on the first order. A $40-AOV brand cannot do that, which is why high AOV is the structural advantage that makes home-goods math survivable.