
Insights
Is your DTC category recession-proof? 2008 vs 2020 PCE data by vertical
Some DTC categories held volume through 2008 and 2020. Others dropped 20 to 40 percent. PCE data by vertical shows which categories are discretionary in a downturn and which behave like staples. Find your category to see how demand moved in both recessions and what that implies for your planning buffer.
Key Takeaways
- Apparel real spending fell 27.5% in the 2020 COVID drawdown vs 7.1% in 2008-09 (BEA PCE chain-type quantity indexes via FRED). The depth was 4x worse in COVID; the recovery was 6x faster.
- Restaurants and hotels lost 38.6% of real spending in Q2 2020. The most recession-exposed category in PCE. In 2008-09 it lost 5.3%.
- Furniture crashed 15.9% in 2008-09 but rose 13% by Q3 2020. Same category, opposite outcome. Credit-driven recessions kill big-ticket; behavior-driven recessions redirect into it.
- Food at home, household supplies, and pet products never dropped more than 5% in either recession. Real recession resistance. Food at home rose 6.6% in COVID.
- Major banks put US recession odds at 25-35% over the next 12-18 months (Goldman 25%, JPM 35%). Soft landing is still the base case but the band is too wide to operate without a stress scenario.
The Bureau of Economic Analysis (BEA) publishes real, inflation-adjusted consumer spending by category every quarter, and the May 2026 update gives us a clean look at how the 2008 and 2020 recessions actually hit different DTC verticals. This matters because the major banks are putting US recession odds at 25 to 35 percent over the next 12 to 18 months (Goldman Sachs 25 percent, J.P. Morgan 35 percent). That is not the base case, but the band is too wide to operate without a stress scenario. Below are the eight consumer categories that map most closely to ecommerce, the peak-to-trough drawdown in each recession, the recovery time, and what we are watching next.
"Recession-proof" depends on which recession you're picturing
When operators say "we sell something recession-resistant," they are usually anchored to one mental model of a recession (typically 2008 or 2020) and assuming the next one will rhyme. The data does not support that. 2008-09 and 2020 were structurally different events: 2008 was a credit and jobs shock, 2020 was a behavior shock with massive offsetting stimulus. The same category can look opposite across the two.
There is a useful sidebar mental model here.
The rest of this post walks through both shapes with the actual PCE drawdown numbers, then maps them to a three-question diagnostic for your category.
The actual drawdowns by category (peak to trough)
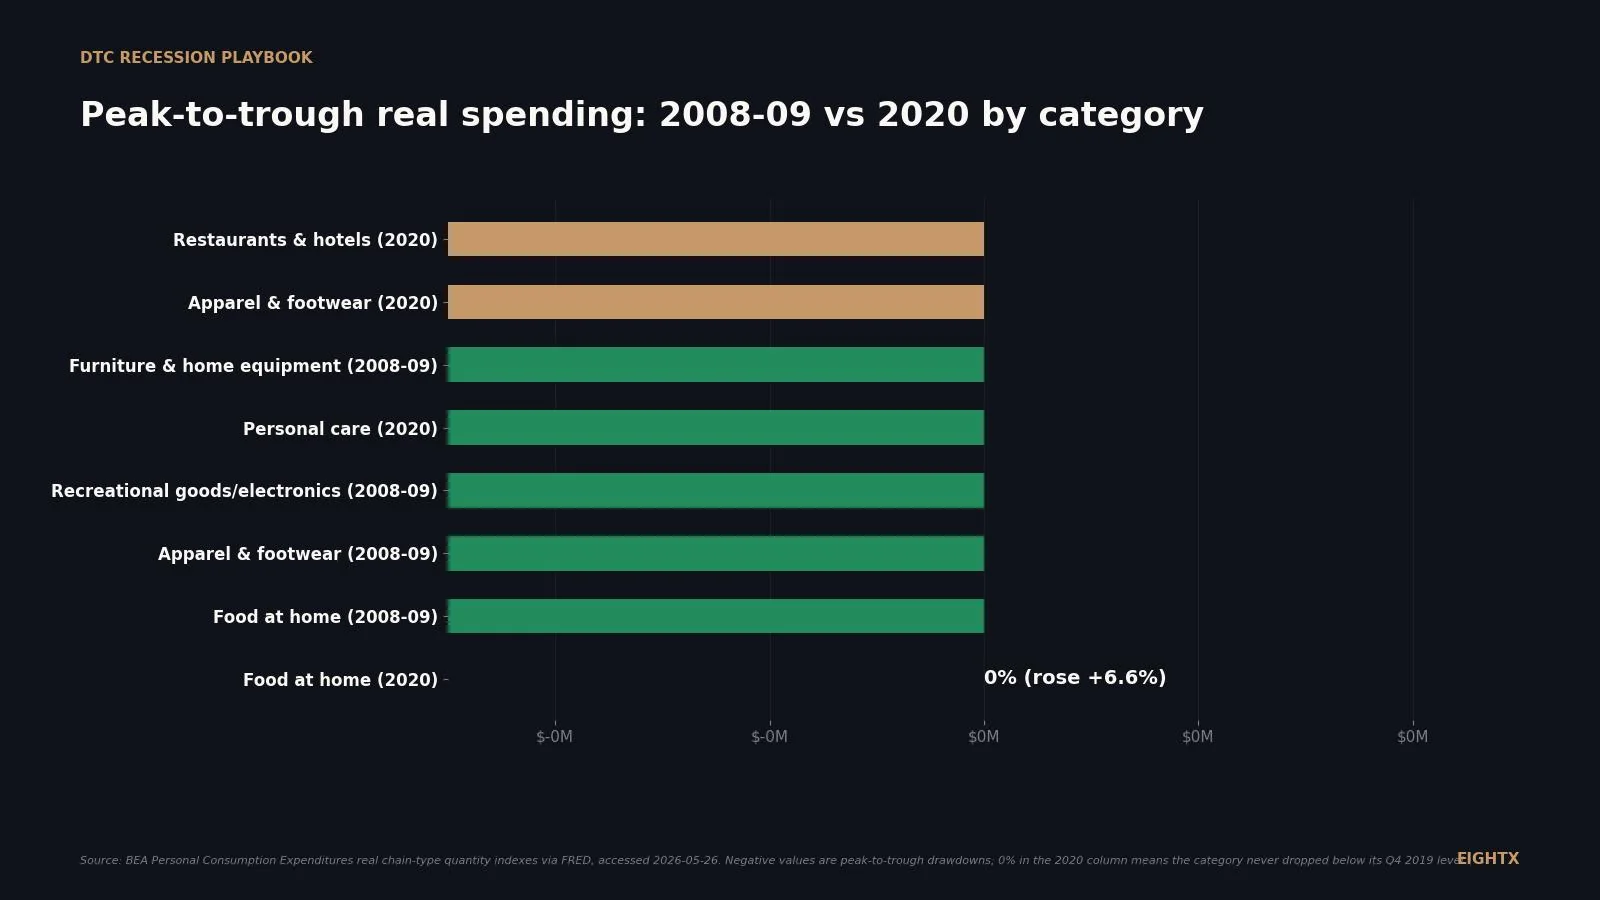
The clearest single chart is the comparison across both recessions. A zero in the 2020 column means the category never went below its pre-COVID level. For the goods categories, 2020 was not a drawdown at all; it was a demand surge.
Three patterns jump out.
First, restaurants and hotels (DFSARA in FRED) is the most recession-exposed category in PCE, and it gets worst in a behavior recession (down 38.6 percent peak-to-trough in Q2 2020). In a credit recession (2008-09) it lost a relatively modest 5.3 percent.
Second, big-ticket durables (furniture, recreational goods, electronics) flip almost completely between the two recessions. Furniture fell 15.9 percent in 2008-09 and rose 13 percent above peak by Q3 2020. Recreational goods (which includes electronics, sporting goods, RVs, musical instruments) fell 8.1 percent in 2008-09 and rose 27 percent in COVID. If your category is big-ticket and deferrable, your 2008-style scenario should look nothing like your 2020-style scenario.
Third, the genuinely defensive categories cluster at the bottom of both columns: food at home (-3.8% in 2008-09, +6.6% in 2020), household supplies (-5.0% in 2008-09, +6.8% in 2020), pet products (-6.8% in 2008-09, +9.3% in 2020). None of them ever lost more than 5 percent in real spending.
The 2008-09 playbook: durable goods crash hardest
This is the recession shape that almost matters more for 2026 and 2027 planning, because the macro setup (no large fiscal transfer, sticky inflation, rate uncertainty) looks more like 2008 than 2020 if it does happen.
Furniture and household equipment (DFDHRA) was the worst-performing category in the BEA data, down 15.9 percent peak-to-trough. The 2009 trough did not recover until 2014 in this series, which is a five-year underwater period. Recreational goods and apparel both fell in the 7 to 8 percent range and took roughly three years to recover. Restaurants lost about 5 percent and food at home barely budged.
The mechanism is the one Goldman and the Bank of America card data are flagging for the current cycle: lower-income and credit-constrained households cut deferrable big-ticket purchases first, then trade down on discretionary services and apparel. Necessities like grocery, household paper goods, and pet food keep moving.
The 2020 COVID playbook: services crash, goods boom
This is the recession shape DTC operators remember most viscerally, because most current operators built their P&L during it.
The chart is the cleanest visual proof we have that "recession" is not a single thing. In Q2 2020 the lines diverge by more than 50 index points (restaurants at 61, recreational goods at 112). Apparel collapsed 27.5 percent in a single quarter (the worst quarterly drop in the entire DCLORA series) and was back above pre-COVID by Q3. Furniture dipped 1.7 percent in Q2 and surged 13 percent above peak by Q3 as households built home offices. Food at home rose 6.6 percent and stayed elevated for two years.
The CARES Act stimulus is the key variable. Without it, the goods-side surge does not happen and 2020 looks more like a brutal version of 2008 plus a service-sector collapse. A 2026 or 2027 downturn is highly unlikely to ship with a CARES-sized fiscal transfer.
What the 2022 mini-recession showed in DTC public-company data
PCE category data gives us 2008 and 2020. But the recession most operators actually lived through and ran their P&L against was the 2022 inflation slowdown, which was not officially a recession but stress-tested DTC the same way. Public-company filings line up cleanly with the PCE category split.
Company Category 2022 result What management blamed Wayfair Home goods "Core recipe weakened" mid-2022 Housing cool-down; post-pandemic demand normalization Peloton Connected fitness Material revenue decline COVID at-home fitness surge over; inventory and margin reset RH Premium furniture Premium segment pressure Post-pandemic boom unwind Allbirds Apparel/footwear +7% to $297.8M (sharply decelerated) Tougher YoY comps; softer discretionary Warby Parker Eyewear/apparel +10.6% to $598.1M (decelerated) Same; shifted to ARPC and profitability Chewy Pet (subscription) +13.4% to $2.71B (resilient) Subscription model; non-discretionary pet spend Bark Pet +33.9% in Q3 fiscal 2022 (resilient) Retention; non-discretionary pet spend e.l.f. Beauty Value beauty Strong resilience and cash generation Value positioning during trade-down Olaplex Premium beauty +9.2% Q3 2022 then slowed Macro headwinds; channel-mix shift
The pattern: pet and value beauty held up, big-ticket home goods and connected fitness cratered, apparel decelerated. The PCE history said this would happen, and a mid-cycle inflation slowdown was enough to surface it. 2022 was the live stress test.
Current 2025-26 data is showing the same split surface again: Best Buy cut its fiscal 2026 forecasts (May 2025) citing tariffs and weak demand for appliances and home theater; Smith Leonard reported new furniture orders down 9 percent year-over-year in April 2025; RH had "its worst day ever on Wall Street" in 2025 on tariff and debt pressure; Chipotle has cut sales forecasts repeatedly through late 2025; Chewy reported plus 8.3 percent net sales in fiscal 2025. The cyclical categories are already showing 2026 stress; the defensive ones are not.
Recovery time matters more than drawdown depth
Apparel fell harder in COVID (27.5 percent) than in the GFC (7.1 percent), but recovered in 6 months versus 3 years. The shape of the recovery curve is the operator-decision variable, not just the trough. A short, sharp drawdown is a cash-flow problem you can borrow through. A long, shallow drawdown is a business-model problem that eats your equity.
Category 2008-09 drawdown 2020 COVID drawdown 2008-09 recovery time 2020 COVID recovery time Restaurants and hotels -5.3% -38.6% ~5 years ~2 years Apparel and footwear -7.1% -27.5% ~3 years ~6 months Personal care (annual series) -3.3% -14.7% ~3 years ~2 years Furniture and home equipment -15.9% no decline (+13%) ~5 years n/a Recreational goods and electronics -8.1% no decline (+27%) ~3 years n/a Pet products (annual series) -6.8% no decline (+9%) ~4 years n/a Household supplies (annual series) -5.0% no decline (+7%) ~3 years n/a Food at home -3.8% no decline (+7%) ~2 years n/a
Economists predict ten of the last five recessions, so do not anchor your 2027 plan on the forecast. Anchor it on the category. Build two scenarios: one where things keep growing, one where there is a pullback in the second half. Reality is between them. You do not need to know which one is right; you need to be able to act on either.
What to do with this if you run a DTC brand in 2026
Three questions to ask about your category before you lock the 2027 buy.
Is your category demand-elastic or inelastic? Food, household supplies, and pet products are inelastic and barely move in either recession shape. Apparel, furniture, electronics, restaurants are elastic. If you are elastic, the question is not "will demand drop" but "by how much." Use the peak-to-trough numbers in the table as your downside scenario.
Is your average order value above 100 dollars (deferral risk) or below 50 (replacement purchase)? High-AOV categories get cut first in a credit-driven recession because the buyer has more time to defer. Low-AOV consumable replacements (toothpaste, dog food, household supplies) keep moving because the buyer is replacing something that ran out, not making a new acquisition.
Is your demand tied to a behavior that gets disrupted in a behavior recession? Travel-adjacent categories (luggage, travel gear), restaurant-adjacent (food delivery hardware, hospitality uniforms), gym-adjacent (athleisure, supplements), and event-adjacent (formalwear, party rental) all get hit hard in a 2020-shape recession even though they would be fine in a 2008-shape one.
Map your answers to a two-scenario plan, not a single number. Goldman's 25 percent and J.P. Morgan's 35 percent are giving you a one-in-three to one-in-four probability of needing to execute the recession plan over the next 12 to 18 months. That is not your base case but it is high enough to be worth the planning effort.
For the labor-cost side of stress-testing, see the DTC layoff and hiring tracker. For the cost-of-goods side, see average COGS by ecommerce vertical and our interim CFO services for a 30-minute scenario-modeling call.
Sources and methodology
Primary source. Bureau of Economic Analysis, Personal Consumption Expenditures (PCE), real chain-type quantity indexes by category, accessed via the Federal Reserve Economic Data (FRED) on 2026-05-26.
Series used (quarterly, seasonally adjusted, base 2017=100). DCLORA3Q086SBEA (clothing and footwear), DFXARA3Q086SBEA (food and beverages purchased for off-premises consumption), DFSARA3Q086SBEA (food services and accommodations), DFDHRA3Q086SBEA (furnishings and durable household equipment), DREQRA3Q086SBEA (recreational goods and vehicles, which includes consumer electronics, sporting goods, RVs, and musical instruments).
Series used (annual only). DPCRRA3A086NBEA (personal care services), DPETRA3A086NBEA (pets, pet products, and related services), DHOURA3A086NBEA (household supplies). These categories do not have a quarterly equivalent at this NAICS level so the within-recession trough granularity is coarser. We show them in tables and prose rather than mixing annual and quarterly series on the same line chart, which would mislead readers.
Indexing methodology. All charts re-index to the pre-recession peak quarter = 100 for visual comparison. Peak quarters: Q4 2007 for the Great Financial Crisis (NBER business-cycle peak was December 2007), Q4 2019 for COVID (NBER peak was February 2020 but Q4 2019 is the cleanest quarterly comparator). Recovery time = quarters until the index re-attained the pre-recession peak value.
2022 mini-recession data. Public-company revenue trajectories and management attribution come from each company's 2022 annual report, Q3 press release, or 2023 shareholder letter (Wayfair 2023 Shareholder Letter; Chewy fiscal 2022 results; Bark Q3 fiscal 2022 release; Allbirds 2022 10-K; Warby Parker SEC filing; Olaplex Q4 2022 release). Triangulated via Parallel.ai on 2026-05-26.
Forecaster recession-probability sources. Goldman Sachs 2025 Tariff-Induced Recession Risk report (25 percent base case for US recession). J.P. Morgan 2026 outlook (approximately 35 percent). Bank of America Consumer Checkpoint, July 2025 (defensive grocery, cooling restaurants for sub-100K households). McKinsey State of Fashion 2026. Best Buy May 2025 fiscal 2026 forecast cut. Furniture Today (Smith Leonard April 2025 order data). Reuters (Chipotle October 2025 forecast cut).
Limitations. (1) BEA PCE measures total US consumer spending, not specifically ecommerce or DTC. DTC dynamics in any category typically amplify the underlying signal because deferrable purchases get cut harder online than in-store, but the direction is the same. (2) The 2020 COVID drawdown was paired with massive fiscal transfer (CARES Act) that arrived by Q2 2020 and rescued the goods-side categories. A 2026 or 2027 recession without that transfer would likely look more like 2008-09 than 2020. (3) Pet, personal care, and household-supplies series are annual only at this level of detail. (4) Pet data ends at 2024 in FRED; 2025 not yet posted. (5) Sporting goods is combined into recreational goods and vehicles (DREQRA) because there is no clean sporting-goods-only quarterly series.
Update cadence. BEA releases real PCE quarterly with the third estimate of GDP (typically 90 days after quarter close). Next refresh target is the Q2 2026 release in September 2026.
Sequel post. We are tracking private DTC sales trajectories via Storeleads and the public-company 10-K recession trajectory data (Wayfair, Chewy, RH, Peloton 2008-2010 and 2020-2022 revenue curves) as a follow-up post on category-by-category private-DTC recession behavior.
Frequently asked questions
is my dtc category recession-proof or am i fooling myself?
Probably fooling yourself a little. Only food at home, household supplies, and pet products have stayed within 5 percent of peak in both 2008-09 and 2020. Everything else, including beauty and personal care, took a real hit in at least one of those recessions. The right question is not whether your category is recession-proof but which recession shape it survives and which one it does not.
how much did apparel spending actually drop in the 2008 recession?
Real apparel and footwear spending fell 7.1 percent peak-to-trough between Q4 2007 and Q2 2009 (BEA PCE chain-type quantity index DCLORA via FRED). The bigger surprise is recovery time. Apparel did not reattain its pre-2008 spending level until late 2010. That is roughly three years underwater for the category, which is a much longer planning horizon than most operators assume.
why did furniture sales boom in 2020 but crash in 2008?
Different recession shapes. 2008 was credit-driven, jobs went away and lending tightened, so households deferred big-ticket purchases. Furniture is exhibit A: real spending fell 15.9 percent peak-to-trough. 2020 was behavior-driven, lockdowns plus stimulus redirected the travel and restaurant budget into home goods, so furniture rose 13 percent above its pre-COVID level by Q3 2020. Same category, opposite outcome depending on what triggers the recession.
what's the most recession-resistant ecom category by the actual data?
Food and beverages purchased for off-premises consumption, what most operators would call grocery DTC. It fell 3.8 percent peak-to-trough in 2008-09 and rose 6.6 percent in 2020. No other PCE category has stayed inside a 5-point band in both major recessions in the BEA data. Household supplies (paper goods, cleaning) is the runner-up: never down more than 5 percent in either recession.
how long did clothing brands take to recover from the 2008 recession vs covid?
Roughly 3 years versus 6 months. After the 2008-09 trough in Q2 2009, apparel did not reattain its Q4 2007 level until Q4 2010. After the COVID trough in Q2 2020, apparel was back above pre-COVID by Q3 2020. The shape of the recovery curve matters more for cash planning than the depth of the trough, because depth determines the worst quarter and shape determines how many quarters you need to fund.
if a recession hits in 2026, which categories should i be most worried about?
Three groups of forecasters (Goldman, JPM, BofA card data) converge on the same answer for the current cycle: big-ticket interest-sensitive durables (furniture, appliances, home improvement), cyclical discretionary services (restaurants, hotels, leisure), and apparel for households under 100K in income. The PCE history says the same thing. If your AOV is above 200 dollars and your customer is making a deferrable choice, build a 25 to 30 percent downside scenario.
is selling pet products recession-proof?
Closer to recession-resilient than recession-proof. Real pet spending fell 6.8 percent in 2008-09 (peak 2007 to trough 2009 in the annual BEA series). In 2020 it rose 9 percent. Chewy reported plus 8.3 percent net sales in fiscal 2025 and Bark grew 33.9 percent in their Q3 2022 during the inflation slowdown. The subscription model and the 'pets as family' positioning explain the resilience, but a credit-driven recession would still take a few points off your top line.
what's the difference between a demand-driven and a behavior-driven recession for dtc?
A demand-driven recession (2008-09) is a credit and jobs shock. People still go out, they just buy less of everything, and big-ticket deferrable purchases get cut hardest. A behavior-driven recession (2020) is a shock to where and how people spend, often with offsetting stimulus. Services collapse, goods boom. The 2008 playbook and the 2020 playbook are almost opposite for DTC, which is why a generic recession plan tends to be wrong for at least half the categories you sell into.