
Australian Market
NAB Online Retail Sales Index Hit +12.5% YoY (Sep 2025) — What It Means for AU DTC 2026
Key Takeaways
- The latest NAB Online Retail Sales Index reading (September 2025) shows AU online retail up +12.5% year-on-year and +0.5% month-on-month, seasonally adjusted.
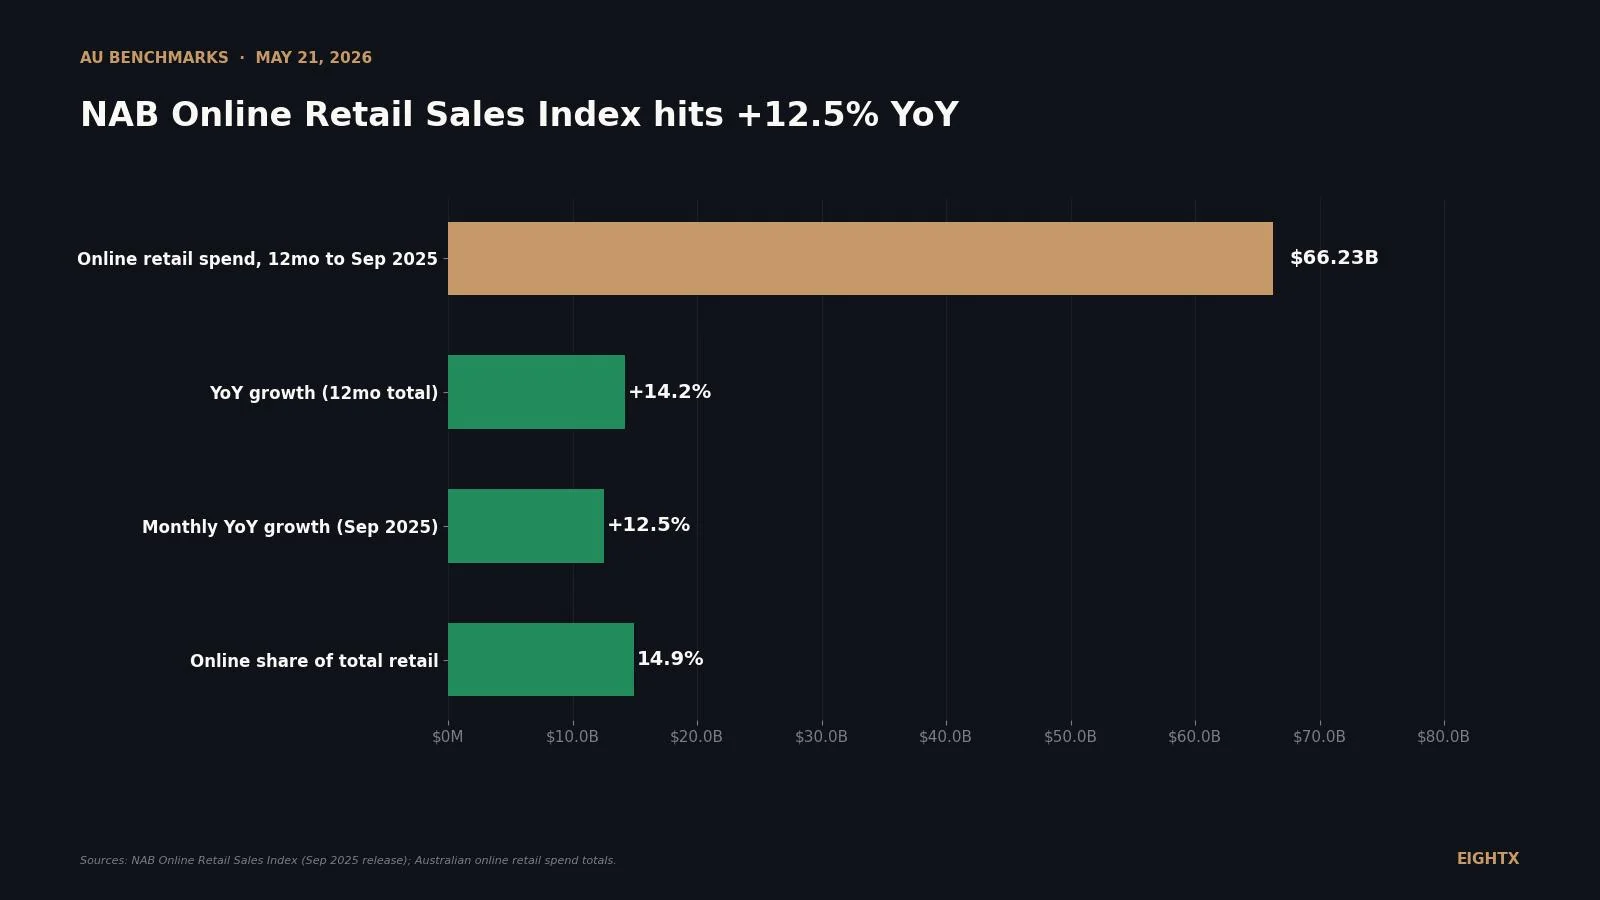
- Twelve-month online retail spend to September 2025: $66.23 billion AUD (+14.2% YoY). Online now represents 14.9% of total Australian retail trade per NAB's definition.
- Online is growing roughly 3x faster than total retail — ABS Monthly Household Spending Indicator put total retail growth at just +3.7% YoY in August 2025. The online share is still gaining ground every month.
- Department stores online grew fastest at +20.8% YoY, followed by Games & Toys (+17.2%) and Takeaway Food (+17.1%). Slowest: Homewares & Appliances (+5.6%) and Grocery & Liquor (+7.8%).
- State growth: WA +17% (fastest), VIC +13%, NSW +12%, SA +12%, TAS +12%, QLD +11%. The WA-leads-the-east-coast pattern is now consistent across both NAB and Aus Post data sources.
Australia Post's annual eCommerce Report is the deep-dive every Australian ecom commentator quotes once a year. NAB's Online Retail Sales Index is the monthly counterpart — less rich on demographic detail, but updated 12 times a year and 35 days after each month-end, which makes it the right tool for tracking what's actually happening now in Australian online retail.
The September 2025 reading (the most recent published) is straightforward: online retail grew 12.5% year-on-year, the month-on-month figure ticked up 0.5%, and the 12-month rolling spend hit $66.23B. Both numbers are healthy; both are slightly slower than the Aus Post annual figures, which is partly definitional and partly real deceleration.
This post pulls the NAB Online Retail Sales Index data (extracted directly from the September 2025 PDF report), cross-references it against the Aus Post annual figures and ABS total retail trade, and explains how a $5M–$50M Australian DTC brand should use the monthly cadence as an early-warning system rather than just a once-a-year benchmark.
Why this index matters: Aus Post tells you what happened last year. NAB ORSI tells you what's happening this month. For active decision-making — inventory orders, paid-acquisition reallocation, forecast revisions — the monthly index is the more useful signal.
The Headline Numbers
| Metric | September 2025 | Notes |
|---|---|---|
| Online retail growth, YoY (SA) | +12.5% | Seasonally adjusted |
| Online retail growth, MoM (SA) | +0.5% | Modest monthly lift |
| 12-month online spend (to Sep 2025) | $66.23B AUD | +14.2% YoY |
| Online share of total retail trade | 14.9% | NAB's definition is narrower than Aus Post's |
| ABS total retail growth (Aug 2025, MHSI) | +3.7% | For cross-reference: online is >3x total retail growth |
Three things worth highlighting:
1. Online is still gaining share every month. Online grew 12.5% YoY. Total retail (per ABS) grew 3.7% YoY. The gap of ~8.8 percentage points is online's monthly share gain, and the gap has stayed roughly stable for the last 18 months. That tells you the channel shift from offline to online is not slowing — it's just running at a structural rate.
2. The NAB number is narrower than Aus Post. NAB's 14.9% online share vs. Aus Post's 24% is a definitional gap, not a contradiction. NAB ORSI is derived from bank transaction data and tracks a specific online-retail definition. Aus Post includes more categories. Both are useful; just don't average them.
3. The slight deceleration (Aus Post +14% annual vs. NAB +12.5% September) is real. The September NAB figure is more recent than the Aus Post CY2025 average, and 12.5% suggests the trailing growth rate is softening modestly. Not a crisis, but worth tracking month-to-month.
Category Breakdown (September 2025)
| Category | Share of online spend | YoY Growth (NAB ORSI) | vs. category headline |
|---|---|---|---|
| Department Stores | 21.1% | +20.8% | Fastest-growing |
| Homewares & Appliances | 18.7% | +5.6% | Slowest, by a lot |
| Grocery & Liquor | 14.5% | +7.8% | Below average |
| Personal & Recreational | 11.7% | +8.7% | Below average |
| Fashion | 10.0% | +10.6% | Below average, close to Aus Post's 11.5% |
| Games & Toys | 8.3% | +17.2% | 2nd-fastest |
| Takeaway Food | 8.2% | +17.1% | 3rd-fastest |
| Media | 7.6% | +7.7% | Below average |
The pattern: Department stores online and "fun" categories (Games & Toys, Takeaway Food) are running well above the 12.5% headline. Practical-purchase categories (Homewares, Grocery, Personal) are running well below. The implication: Australian consumers are spending discretionary dollars online faster than they're shifting essential purchases — suggesting the next leg of channel growth is going to come from the boring categories playing catch-up, not the exciting ones accelerating further.
Cross-checking against Aus Post's annual data:
- Fashion: NAB ORSI September 2025 +10.6%, Aus Post CY2025 +11.5%. Close match.
- Homewares: NAB +5.6% vs. Aus Post Home & Garden +10.5%. Bigger gap, partly because NAB's "Homewares & Appliances" is narrower than Aus Post's "Home & Garden."
- Department stores: NAB +20.8% vs. Aus Post +19.5%. Close match again; both sources are flagging this as the fastest-growing big category.
When the two sources agree (fashion, department stores), the underlying signal is robust. When they diverge sharply (homewares), it usually points to category-definition differences rather than data contradictions.
State-by-State (September 2025)
| State | YoY Growth (NAB ORSI) | Aus Post Annual (CY2025) |
|---|---|---|
| Western Australia | +17% | +18% |
| Victoria | +13% | +13% |
| NSW | +12% | +13% |
| SA | +12% | +14% |
| TAS | +12% | +13% |
| Queensland | +11% | +15% |
The WA-leads-the-pack pattern is consistent across both NAB monthly and Aus Post annual sources, which makes it about as robust as Australian ecommerce signals get. The QLD divergence (NAB +11% vs Aus Post +15%) suggests some monthly softening in Queensland that the annual figure doesn't yet show — worth monitoring in the October and November ORSI prints.
For a $5M–$50M brand, the state-level read:
- WA continues to be the fastest-growing market. If you're east-coast-default in your acquisition strategy, the share opportunity is real.
- QLD softening is a fresh signal worth checking against your own AU geo-split data. If your QLD revenue grew slower in Q3 2025 than your VIC or NSW revenue, you're seeing the same trend NAB is.
- The TAS, SA, NT, ACT minor-states cluster all grew 12% in line with mid-range — small in absolute terms but not under-served.
How to Use the NAB Index as an Early-Warning System
This is the operational angle most brands miss. Aus Post comes out once a year; by the time you're benchmarking against it, the data is already 6–18 months old. NAB ORSI updates monthly, ~35 days after each month-end, which gives you a fresher signal — but only if you're set up to use it.
The two practical applications:
1. Watch the YoY trajectory month-by-month. If the YoY decelerates from 12.5% (September 2025) to, say, 9% across two consecutive months in late 2025 or early 2026, you have a category-softening signal with two months of lead time before it shows up in your annual planning cycle. Reasonable response: tighten Q1 2026 forecast, slow inventory orders for slow categories, reallocate paid budget from prospecting to retention.
2. Cross-check your category against NAB's category-level YoY. If your fashion brand grew 9% in Q3 2025 and NAB ORSI fashion grew 10.6%, you're 1.6 points behind the category — a meaningful share loss, surfaced quickly enough to take action before the annual review. If you grew 14% and the category grew 10.6%, you took share, and the question is how to capitalise on it.
One Australian beauty brand we work with reviews the NAB ORSI prints monthly. In Q2 2025, they noticed Personal & Recreational growing only 8.7% YoY while their own brand was running 16% — a clear share-take. They lifted their performance-marketing budget by 25% on the next quarterly cycle. Q4 2025 closed with the brand 22% above prior year vs. category at 9% — the lean-in worked. Without the monthly trend visibility, they'd have made the budget decision on annual data 6 months late.
NAB ORSI vs. Aus Post: When to Use Which
| Question | Use this source |
|---|---|
| How big is the Australian online retail market? | Aus Post (deeper definition, $82.6B figure) |
| How is the market changing this month? | NAB ORSI (monthly cadence) |
| How does my brand's category compare? | Both — Aus Post for annual, NAB for monthly trend |
| What's the state-by-state breakdown? | Either (both agree directionally) |
| What's the demographic / household behavioural detail? | Aus Post (much richer) |
| What's my early-warning signal for category softening? | NAB ORSI (2-month lead time) |
| What's the AU Shopify competitive landscape? | Storeleads (neither Aus Post nor NAB covers this) |
The mistake we see most often is brands treating the two as interchangeable. They're not. Aus Post is the strategic-planning data set; NAB ORSI is the operational-monitoring data set. The brands that build both into their finance review cadence end up reacting to category shifts months ahead of the brands that don't.
What Likely Happens Next in the Index
Three things to watch in the November 2025 and December 2025 NAB ORSI prints:
1. Whether the YoY trajectory holds at 12.5% or decelerates. A move to 10% or below over two consecutive months would suggest the category softening that the basket-value compression in Aus Post's annual data hinted at. Conversely, a hold at 12–13% says the trend is structural and stable.
2. Whether Department Stores +20.8% keeps leading category growth. Department stores online has been the standout category for two quarters. If that decelerates, watch for which category picks up the slack — that's where the next growth narrative gets written.
3. Whether Queensland recovers from the NAB +11% reading. The QLD divergence (NAB +11% monthly vs. Aus Post +15% annual) is the cleanest "watch this" signal in the recent data. If QLD comes back to 14–15% in November and December, the September reading was noise; if it stays at 11% or below, there's a real Queensland-specific softening to plan against.
Frequently Asked Questions
What is the NAB Online Retail Sales Index?
The NAB Online Retail Sales Index (ORSI) is a monthly index that tracks Australian online retail spending growth, published free by National Australia Bank since 2012. It uses NAB's anonymised customer-transaction data plus third-party data to estimate online retail spend across categories and states, and is widely cited alongside Australia Post's annual eCommerce Report. ORSI is the closest thing Australia has to a monthly equivalent of the US Census Bureau's monthly retail trade release.
What was the latest NAB Online Retail Sales Index reading?
September 2025 (most recent published data) showed online retail sales up 12.5% year-on-year and +0.5% month-on-month, both seasonally adjusted. The 12-month total to September 2025 was $66.23 billion AUD, up 14.2% YoY. Online retail now represents 14.9% of total Australian retail trade, with the broader retail category growing 3.7% YoY per the ABS Monthly Household Spending Indicator — meaning online is growing roughly 3 times faster than total retail.
Which category is growing fastest in the NAB Online Retail Sales Index?
Department stores online led category growth in the September 2025 NAB ORSI at +20.8% year-on-year, followed by Games & Toys (+17.2%) and Takeaway Food (+17.1%). The slowest categories were Homewares & Appliances (+5.6%), Media (+7.7%), and Grocery & Liquor (+7.8%). Fashion grew 10.6% — broadly in line with Australia Post's annual 11.5% category figure, providing useful cross-validation between the two sources.
Which Australian state has the fastest online retail growth in the NAB index?
Western Australia led state-level growth in the September 2025 NAB ORSI at +17% year-on-year, followed by Victoria (+13%), NSW (+12%), SA (+12%), TAS (+12%), and Queensland (+11%). This is consistent with the Australia Post annual data, which also showed WA as the fastest-growing state. The pattern: mining-economy states with stronger household income growth and lower density (which pushes more shopping online by default) outpacing east-coast metros for the second year running.
How does the NAB Online Retail Sales Index compare to Australia Post's eCommerce Report?
Aus Post's eCommerce Report is the annual deep-dive ($82.6B / +14% / 24% online share for CY2025) with rich demographic, suburb, and category detail. NAB's ORSI is the monthly trend tracker ($66.23B 12-month / +12.5% in September 2025 / 14.9% online share) updated 35 days after each month-end. The two figures don't reconcile perfectly because they use different definitions of "online retail" — NAB ORSI is a narrower bank-transaction-derived measure. Use Aus Post for category sizing and demographic context; use NAB for month-by-month trend monitoring and early-warning signals.
What does the NAB Online Retail Sales Index trend mean for a $5M-$50M Australian DTC brand?
The monthly cadence makes ORSI the right tool for early-warning signals. If the YoY growth rate decelerates from 12.5% to 8% across two consecutive months, you're seeing the start of a category softening before it shows up in your own data — that's two months of lead time to adjust forecast, inventory orders, or paid acquisition. The category breakdown also lets you cross-check your own YoY against your category's monthly path, not just the annual headline.
Where can I find the NAB Online Retail Sales Index data?
NAB publishes the Online Retail Sales Index monthly as a free PDF, available at business.nab.com.au under Business Research & Insights. Reports are typically released about 35 days after each month-end. The September 2025 edition cited here is the most recent at the time of publication; new monthly editions are added each month with category and state breakdowns.
The NAB Online Retail Sales Index is the data set most Australian DTC operators don't use enough. Aus Post gets the annual headlines and the citations; NAB ORSI gets ignored, even though its monthly cadence is far better suited to operational decision-making.
The brands that incorporate ORSI into their monthly finance review cycle catch category shifts 2 months earlier than brands relying on the annual data. That lead time is the difference between proactively reallocating budget and reactively explaining why Q1 missed plan.
If you'd like a CFO to walk through your category against the latest NAB ORSI print, build the monthly trend into your forecasting cadence, and surface the early-warning signals your data is showing — that's exactly the work the first 60 days of an Eightx Growth Economics Audit covers.
Further Reading
- Australian Online Retail Hit $82.6B in 2025 — the annual Aus Post deep-dive on headline spend, state mix, and household participation.
- Australian Online Retail Category Share 2026 — the full annual category breakdown and the top AU Shopify brands per category.
- How Australian DTC Brands Scale to $10M — the 3PL costs and seasonal cash-flow management.
- AU vs US Ecommerce Finance — how Australian unit economics differ from US benchmarks.
- RBA Cash Rate 2026 — the macro context behind consumer spending behaviour and DTC financing costs.
- Fractional CFO for Australian Ecommerce — what an Australian fractional CFO actually does at 60–80% less than a full-time hire.
Sources & Methodology
Primary source: NAB Online Retail Sales Index, September 2025 edition (published October–November 2025, free PDF). Available at business.nab.com.au under Business Research & Insights. All headline growth, share, category, and state figures cited above are extracted directly from the published report.
Cross-reference sources: Australia Post 2026 eCommerce Report (annual, CY2025 data) for the broader category and state context; ABS Monthly Household Spending Indicator for total retail-trade comparison.
Inclusion & Exclusion
NAB ORSI uses a bank-transaction-derived definition of online retail that is narrower than Aus Post's. The two are not directly comparable on absolute dollar terms ($66.23B NAB vs $82.6B Aus Post) but are highly comparable directionally on growth rates and category mix.
Refresh Cadence
NAB publishes the Online Retail Sales Index monthly, ~35 days after each month-end. This page will be refreshed against the most recent published edition. The Aus Post and ABS cross-references will be refreshed at their own cadences (annual and monthly respectively).