
Financial Strategy
National Beverage (FIZZ) Teardown: The Ad-Light Model
National Beverage Corp. (NASDAQ: FIZZ), the maker of LaCroix, posted FY2026 revenue of $1.181B with a 37.0% gross margin and a 19.5% operating margin. It gets there by spending just $46.6M on marketing, about 3.9% of revenue, and running total SG&A at 17.5%, roughly half what growth-stage beverage peers spend, while leaning on digital, social, sponsorships, and cooperative advertising rather than mass-media buys.
Key Takeaways
- SG&A runs at 17.5% of revenue, structurally below every named peer: National Beverage's selling, general and administrative expense held between $207.2M (FY2026) and $210.1M (FY2023) while revenue sat near $1.18B. That is 17-18% of sales, versus roughly 28% at Monster Beverage, 24% at Vita Coco, and 39% at Celsius. It is not a scale effect: Monster is far larger and still spends more. Source: SEC EDGAR XBRL, CIK 0000069891.
- Marketing is just $46.6M, about 3.9% of revenue, sitting inside an already-lean 17.5% SG&A line: The FY2026 10-K discloses marketing costs of $46.6M (FY2026), $45.3M (FY2025), and $50.0M (FY2024), all included within selling, general and administrative expenses. That is roughly 3.9% of net sales spent on marketing, inside a total SG&A structure, inclusive of shipping, handling, G&A, and selling, that runs at $207.2M, or 17.5% of net sales. Source: SEC EDGAR XBRL, CIK 0000069891; National Beverage Corp. FY2026 Form 10-K, Marketing Costs note (accession 0001437749-26-022315).
- Operating margin recovered to 19.5% after a FY2023 dip: Operating margin fell to 15.9% in FY2023 on a gross margin squeeze (33.8%, down 2.9 points from FY2022), then recovered to 19.6% in FY2025 and 19.5% in FY2026 as gross margin returned to 37.0% and SG&A dollars stayed flat. Source: SEC EDGAR XBRL, CIK 0000069891.
- Revenue has been flat for four years, and FY2026 declined 1.7%: Net sales moved from $1.138B (FY2022) to $1.181B (FY2026), a compound growth rate under 1%, and FY2026 was the first decline in the window. This is a margin-discipline story, not a growth story. Competition from well-funded rivals is the most likely driver of stalled volume; the 10-K flags companies with greater financial, marketing, and distribution resources as a key competitive threat, though it does not name specific brands or disclose market share data. Source: SEC EDGAR XBRL, CIK 0000069891.
- $349.5M of cash, zero long-term debt, and one controlling founder: National Beverage ended FY2026 with $349.5M in cash and no long-term debt, having generated $181.3M of operating cash flow that year. Chairman and CEO Nick Caporella owns roughly 73% of the company's single class of common stock (largely through IBS Partners Ltd.), which puts marketing philosophy and capital allocation entirely in founder hands. Source: SEC EDGAR XBRL; SEC proxy filings (DEF 14A, FY2025).
$1.138 billion in revenue in FY2022. $1.181 billion in FY2026. Four years, and the top line barely moved. For most public consumer companies that flat line would be the whole story, and a worrying one.
For National Beverage Corp. (NASDAQ: FIZZ), the maker of LaCroix, it is not the story at all. The story is what sits below the revenue line. This is a company that turns a 37.0% gross margin, which is nothing special for a beverage maker, into a 19.5% operating margin, which is very special. It does that by spending less on overhead than almost anyone in its category, and by refusing, for four decades, to buy its way to growth.
This is a teardown of how that works, why it is durable, and where it is quietly under pressure. Every financial figure below comes from National Beverage's SEC filings.
The number that should make every operator uncomfortable
Start with selling, general and administrative expense, because that is where the whole model lives. In FY2026, National Beverage reported SG&A of $207.2M on $1,180.6M of revenue. That is 17.5% of sales. Across the five fiscal years in the filings, that ratio has held in a tight band: 18.4% in FY2022, 17.9% in FY2023, 17.6% in FY2024, 17.4% in FY2025, and 17.5% in FY2026. The dollar figure has barely moved either, staying between $207.2M and $210.1M the entire time.
Now put that next to the rest of the beverage aisle. Growth-stage and scaled peers run SG&A dramatically higher: Celsius Holdings near 39% of revenue, Monster Beverage around 28%, and Vita Coco around 24%, all in FY2024. National Beverage runs at roughly half the intensity of the group.
The reflex is to assume this is a scale advantage, that National Beverage is simply big enough to spread fixed costs. It is not. Monster Beverage is several times larger by revenue and still spends a far higher share on SG&A. This is a strategy difference, not a size difference. (These peer figures are directional. SG&A definitions vary across filers, and Monster's line in particular aggregates differently, so read the comparison as a picture of intensity, not an exact like-for-like.)
When I talk to founders running consumer brands, the SG&A line is usually the one they have made peace with being high, because they treat it as the cost of staying visible. National Beverage is the counterexample that makes that assumption uncomfortable: it stays visible on a fraction of the spend.
The marketing inside the overhead
The FY2026 10-K does break out a marketing figure, in an accounting-policy note that is easy to miss: "Marketing costs, which are included in selling, general and administrative expenses, were $46.6 million, $45.3 million and $50.0 million for Fiscal 2026, Fiscal 2025 and Fiscal 2024, respectively." That is roughly 3.9% of net sales spent on marketing. It sits inside total SG&A of $207.2M, which also includes shipping, handling, selling, and G&A. The 10-K describes the approach as "innovative digital marketing, digital social marketing, social media engagement, sponsorships and creative content," plus cooperative advertising, event sampling, and consumer promotions. There is no disclosed mass-media war chest, because there is no mass-media war being fought. A national consumer brand of this size advertising on under 4% of revenue is the whole model in one line.
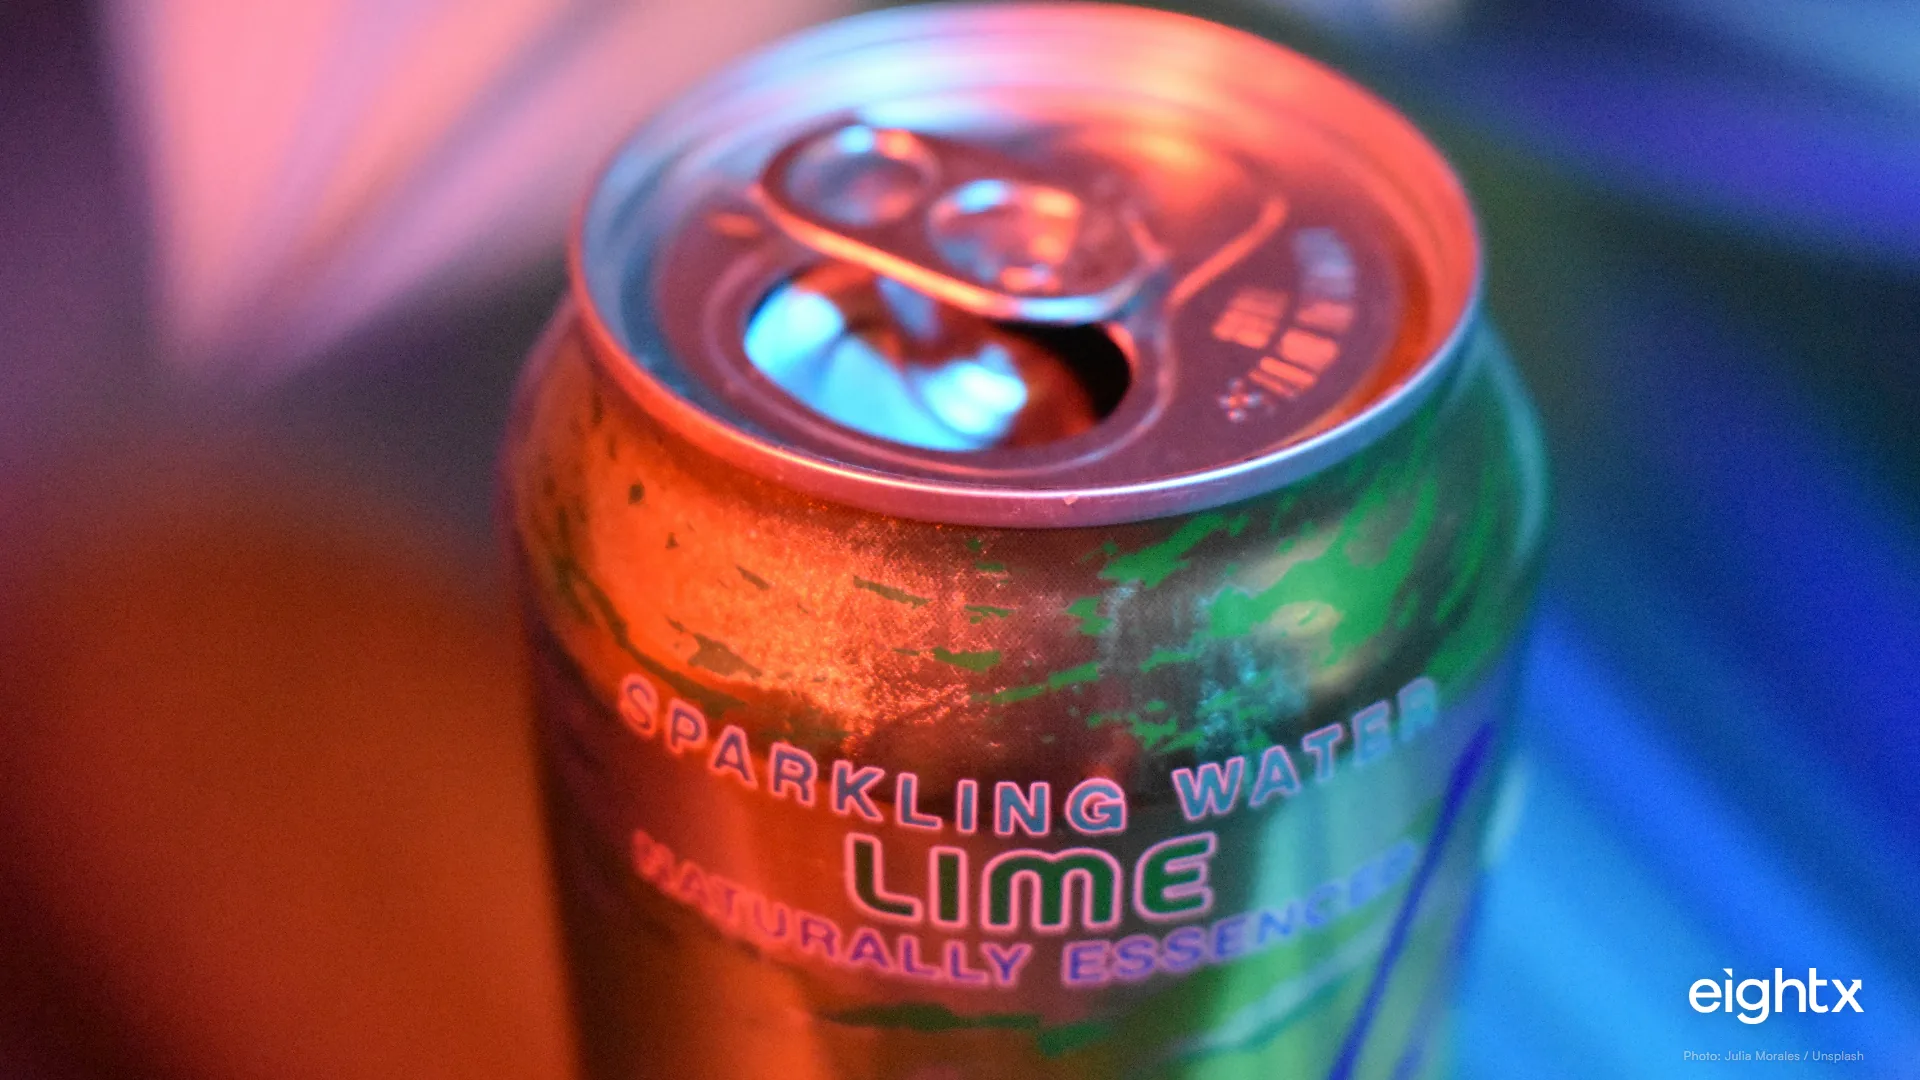
How does a brand this size market without a named dollar figure? LaCroix leaned into three things early. The packaging itself became the ad: bright, distinctive cans that stood out on a shelf and in a photo. A network of Instagram micro-influencers and the #LiveLaCroix user-generated content engine turned customers into the media buy. And the product landed at the exact moment a generation was walking away from soda, so the brand rode a behavior change it did not have to pay to create.
The pattern we see again and again with efficient brands is that the cheapest customer acquisition is a product distinctive enough that people photograph it without being asked. That is a real asset, and it is worth more than a media budget. The catch, which the numbers will get to, is that this asset defends a position better than it expands one.
When we talk with operators about marketing efficiency, the honest framing is that keeping total overhead at 17 to 18% of revenue is where founders aspire to land, not where they start. You earn your way down to it by building brand equity over years. You do not cut your way there in a planning cycle.
Returns are quietly eating your margin. See by how much.
Get our Real Cost of Returns calculator: plug in your numbers, see the true hit per return.
Check your inbox. We'll send the Real Cost of Returns calculator shortly.
How the margin math actually works
Here is the part that trips people up. National Beverage's gross margin is only 37.0%. That is well below Monster Beverage, which runs gross margins in the mid-50s because it outsources manufacturing and sells a higher-priced product, and below Celsius at roughly 50%. On gross margin alone, National Beverage looks like the weaker business.
Follow the money down the P&L and it flips. Monster starts from a much higher gross margin but gives a lot of it back in SG&A near 28%. National Beverage starts lower at 37.0% but only gives back 17.5%. The result is that the operating-margin gap between them is far smaller than the gross-margin gap suggests. National Beverage converts a mediocre gross margin into a top-tier operating margin because it barely spends below the gross line.
That conversion is the entire investment case, and it is worth watching how fragile it looked in FY2023.
In FY2023, gross margin fell to 33.8%, down 2.9 points from FY2022. The 10-K does not name a single cause; input-cost inflation is the most common driver of this margin pattern in the beverage sector and is the most likely explanation, but that is inferred from the margin shape rather than stated in the filing. Because SG&A dollars are close to fixed, that gross-margin hit dropped almost straight through to operating margin, which fell to 15.9%. Gross margin then recovered to 37.0% by FY2025 and held there in FY2026, and operating margin climbed to a new high of 19.6% and then 19.5%. The five-year P&L below shows the whole arc.
| Metric | FY2022 | FY2023 | FY2024 | FY2025 | FY2026 |
|---|---|---|---|---|---|
| Revenue ($M) | 1,138.0 | 1,172.9 | 1,191.7 | 1,201.4 | 1,180.6 |
| Gross profit ($M) | 417.8 | 396.8 | 428.5 | 443.9 | 437.3 |
| Gross margin | 36.7% | 33.8% | 36.0% | 37.0% | 37.0% |
| SG&A ($M) | 209.9 | 210.1 | 209.9 | 208.5 | 207.2 |
| SG&A % of revenue | 18.4% | 17.9% | 17.6% | 17.4% | 17.5% |
| Operating income ($M) | 207.9 | 186.7 | 218.5 | 235.5 | 230.1 |
| Operating margin | 18.3% | 15.9% | 18.3% | 19.6% | 19.5% |
| Net income ($M) | 158.5 | 142.2 | 176.7 | 186.8 | 183.6 |
| Diluted EPS ($) | 1.69 | 1.52 | 1.89 | 1.99 | 1.96 |
| Cash ($M) | 48.1 | 158.1 | 327.0 | 193.8 | 349.5 |
The lesson buried in the FY2023 dip is a warning for any lean-overhead brand: when your SG&A is fixed and thin, you have almost no shock absorber below the gross line. A gross-margin problem becomes an operating-margin problem instantly. Low overhead is a strength in good years and a source of pain against you in bad ones.
The founder factor, and what it buys
None of this happens without one person. Chairman and CEO Nick Caporella has run National Beverage since he built it in 1985, and he owns roughly 73% of its single class of common stock, largely through a holding vehicle called IBS Partners Ltd. There is no dual-class structure or super-voting mechanism. He controls the company because he owns the company. That is a public company with a private owner's grip on the wheel.
What that control buys is the freedom to run a strategy that no quarterly-driven board would tolerate: zero acquisitions, no reliance on paid growth, no regular dividend, and cash left to accumulate on the balance sheet. At FY2026 year-end the company held $349.5M in cash with no long-term debt, after generating $181.3M of operating cash flow that year. There is no debt load, no acquisition machine, and no activist able to force a change of course.
The chart shows the shape of it: revenue essentially flat, operating income drifting up as margins recovered, and cash building from $48M in FY2022 to $349.5M in FY2026. That cash pile is the clearest fingerprint of founder control. A widely held company would be pressed to return it or spend it. Here it simply sits, deployed on management's timetable through occasional special dividends and buybacks.
The cost of that control is the mirror image of the benefit. Outside shareholders have little voice, capital allocation is opaque, and there is real succession risk, because the whole model rests on one aging founder and a share structure whose future is uncertain. When we work with founder-led brands, the same tension shows up smaller: the founder's conviction is the moat and the single point of failure at the same time.
The threat the margin hides
The financials look serene. The competitive position is not. Revenue has been flat for four years and turned negative in FY2026, down 1.7%. That is the number the operating margin quietly papers over.
The most likely explanation is structural. When National Beverage rose, it more or less had the modern premium sparkling water shelf to itself. Then PepsiCo launched Bubly and Coca-Cola launched AHA, and private-label sparkling water spread across grocery. Those competitors carry distribution and marketing resources National Beverage cannot match. The 10-K does not name Bubly or AHA by brand or disclose market share data, but its own risk disclosures acknowledge competition from companies with substantially greater financial, marketing, and distribution resources, and single out advertising and marketing programs as a competitive factor, which is precisely the area where the company is deliberately under-invested.
This is the fault line in the ad-light model. Earned-media brand equity is excellent at holding a position and protecting margin. It is far weaker at generating new demand against rivals spending hundreds of millions to take the same category. National Beverage's flat top line is what that limitation looks like in a filing. The margin is intact. The growth engine has stalled.
What this means for your brand
The takeaway is not "spend less on marketing." Cutting your way to National Beverage's ratios without its brand equity just starves growth. The real lesson has three parts.
First, ad-light economics are earned, not chosen. National Beverage got to 17% total overhead after four decades of a distinctive product, an owned community, and a founder who never blinked. You compound your way down to that efficiency over years by building a product people photograph and share. You cannot cut your way there in a planning cycle.
Second, thin overhead cuts both ways. The FY2023 dip showed how fast a gross-margin problem becomes an operating-margin problem when SG&A is fixed and lean. If you run efficient overhead, know that you are trading a shock absorber for higher peak margins, and stress-test what a few points of gross-margin compression does to your operating line before it happens, not after.
Third, watch for the danger zone in the middle. National Beverage sits at the enviable far end: famous enough to stop buying awareness. The dangerous place is the middle, where a brand is too dependent on paid to turn it off but not famous enough to coast. If that is you, the work is not to slash spend overnight. It is to build the earned-demand assets, distinctive product, owned audience, real word of mouth, that eventually let you spend less without losing the shelf.
National Beverage is proof the destination exists. Its flat revenue is the reminder that even the destination is not safe once a giant decides to compete for your category.
Related reading. For another look at how a beverage brand runs the same P&L math, see the Monster Beverage teardown and the Boston Beer teardown. For how we help brands model margin and cash, see our fractional CFO work.
Related reading. For how a DTC-native functional-soda brand runs the same P&L, see our Olipop teardown.
Sources and methodology
All financial figures come from National Beverage's SEC filings, primarily the machine-readable XBRL company facts. Revenue, gross profit, SG&A, operating income, net income, diluted EPS, cash, and long-term debt for FY2022 through FY2026 were taken directly from the SEC EDGAR XBRL company facts dataset for CIK 0000069891, available at data.sec.gov. Fiscal years end in late April or early May.
The marketing figure and qualitative description come from the FY2026 Form 10-K (accession 0001437749-26-022315). The 10-K's Marketing Costs note discloses marketing costs of $46.6M (FY2026), $45.3M (FY2025), and $50.0M (FY2024), all stated to be included within selling, general and administrative expenses; $46.6M is about 3.9% of FY2026 net sales. The 10-K describes the marketing model as "innovative digital marketing, digital social marketing, social media engagement, sponsorships and creative content," plus cooperative advertising and event sampling. The $46.6M marketing figure sits inside the total $207.2M SG&A line, which also includes selling, shipping, handling, and G&A. The full filing history is on the SEC EDGAR filing index for National Beverage Corp.
Peer SG&A and margin figures are directional, not exact like-for-like. Comparative figures for Monster Beverage (MNST), Celsius Holdings (CELH), and Vita Coco (COCO) were compiled from public-filing income statement data aggregated at StockAnalysis.com. SG&A definitions differ across filers, so peer comparisons describe intensity rather than a precise standard.
The founder-control and marketing-strategy context comes from proxy filings and dated trade press. Caporella's ~73% ownership of the company's single class of common stock (largely via IBS Partners Ltd.) is disclosed in National Beverage's SEC proxy statements, including the FY2025 DEF 14A. The micro-influencer and packaging-led marketing approach is documented in trade coverage including Marketing Dive.
Charts were built by Eightx from the underlying filing data above. Operator observations reflect anonymized patterns from our own advisory work with consumer brands and never identify any specific company.
Frequently asked questions
how does lacroix spend so little on marketing and still hold shelf space?
The FY2026 10-K discloses marketing costs of $46.6M, about 3.9% of net sales, included inside a total SG&A line of $207.2M, or 17.5% of net sales. So the answer is that it spends remarkably little, under 4% of revenue, on marketing, and leans on digital, social, sponsorships, and cooperative advertising rather than mass TV or paid awareness. The brand was early enough to the modern sparkling water wave that the product plus the can did a lot of the advertising. That works while the brand is famous. It gets harder once a well-funded competitor targets the same shelf.
what is national beverage's marketing budget as a percent of revenue?
The FY2026 10-K discloses marketing costs of $46.6M, which is about 3.9% of net sales. That marketing figure sits inside a total SG&A line of $207.2M, or 17.5% of net sales, which also covers shipping, handling, selling, and G&A. So marketing runs under 4% of revenue and total overhead runs at 17.5%, roughly half what growth-stage beverage peers spend in total. Most scaling consumer brands would love to run their entire overhead at 17.5% of revenue; very few can, because they have not yet built the brand equity that lets them deprioritize paid awareness.
why is fizz's sga so much lower than celsius or monster?
National Beverage runs SG&A at about 17.5% of revenue. Celsius sat near 39% and Monster near 28% in FY2024. The gap is not size, Monster is far bigger and still spends more. It is strategy: National Beverage has made zero acquisitions, buys little mass advertising, and runs a lean corporate structure under a founder who has controlled the company since 1985. Note that peer SG&A definitions are not perfectly like-for-like, so treat the comparison as directional.
what happened to lacroix when bubly and aha launched?
PepsiCo launched Bubly and Coca-Cola launched AHA into the sparkling water category, both backed by distribution and marketing budgets National Beverage cannot match. In the financials, the visible result is flat to slightly declining revenue, from $1.138B in FY2022 to $1.181B in FY2026, with FY2026 down 1.7%. The brand held its margin but the category growth that fueled its rise has largely stalled for it.
can a beverage brand really grow without mass advertising?
National Beverage proves you can sustain abnormal margins without mass advertising, but its flat revenue shows the harder truth: an ad-light model protects profitability better than it drives growth once large competitors enter. The earned-media moat holds share and margin. It does not reliably manufacture new demand against rivals spending hundreds of millions on the same category.
how does nick caporella keep control of a public company?
National Beverage has a single class of common stock, and Caporella simply owns roughly 73% of it, largely through a vehicle called IBS Partners Ltd. There is no dual-class structure or super-voting mechanism. He controls the company because he owns the company. That concentration insulates him from activist pressure and means capital allocation, the no-dividend policy, the zero-acquisition stance, and the low-marketing philosophy are all founder decisions rather than board or shareholder ones.
why is national beverage sitting on $350M in cash with no dividend?
At FY2026 year-end the company held $349.5M in cash and no long-term debt, and it does not pay a regular dividend. Management has historically used cash for occasional special dividends and share repurchases rather than a steady payout. The founder-controlled structure means there is limited outside pressure to return the cash, so it accumulates until management chooses to deploy it.
what is the lesson for a dtc brand trying to build without paid ads?
The pattern we see is that ad-light economics are earned over years, not switched on. If you can reach real scale with blended marketing under 20% of revenue, you are compounding brand equity the right way. The danger is the middle: too dependent on paid to stop, not famous enough to coast. National Beverage sits at the far, enviable end of that spectrum, and it still took a controlling founder a decade-plus of discipline to get there.