
Financial Strategy
Monster (MNST) Teardown: The Margin and Share Test
Monster Beverage (MNST) is the #2 global energy drink brand with $8.29B in FY2025 revenue and a 55.8% gross margin earned through two US price increases and supply-chain normalization after a 2022 cost shock. The Coca-Cola distribution relationship is both the structural moat and the primary concentration risk - CCEP and CCBCC alone account for ~25% of net sales.
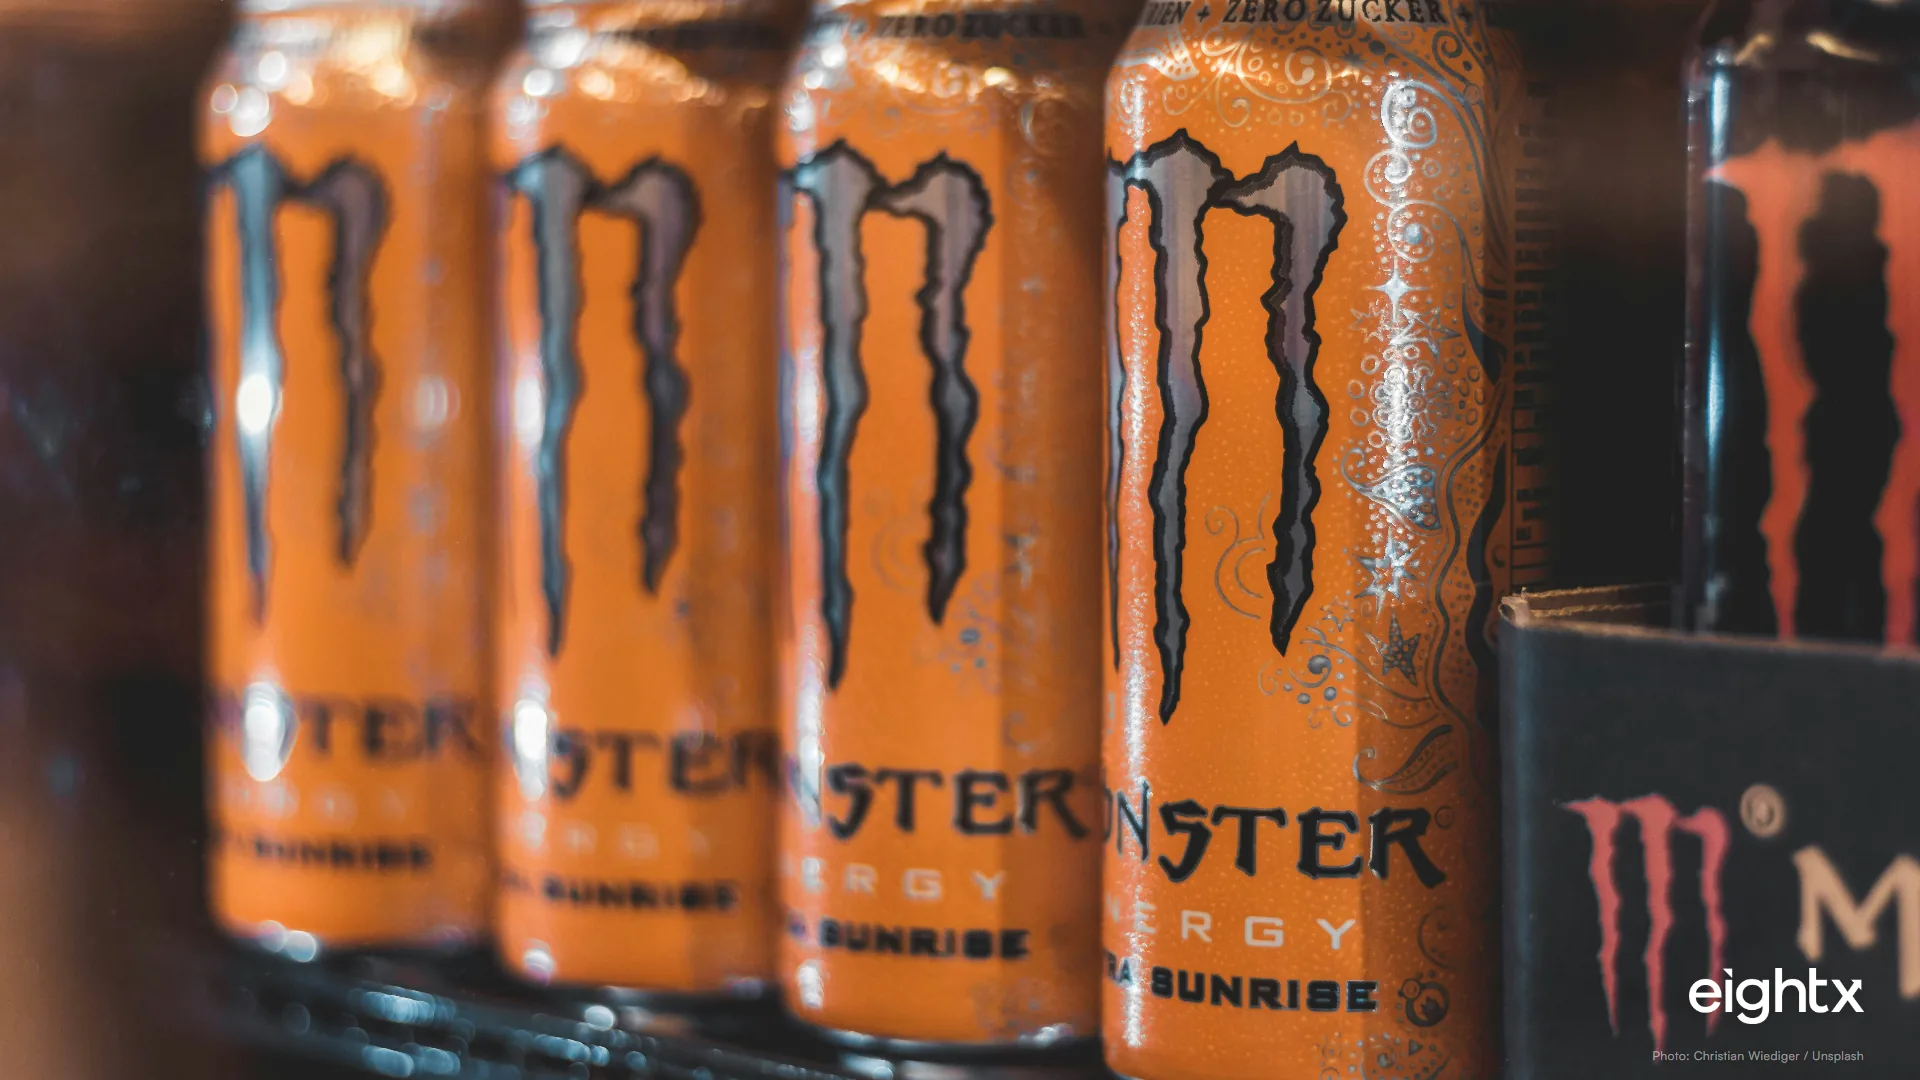
Key Takeaways
- The gross margin recovery is real and nearly complete: Gross margin fell from 56.1% (FY2021) to a 50.3% trough (FY2022) on aluminum-can, freight, and co-packer cost inflation, then recovered to 55.8% in FY2025 - within 30bp of the pre-shock peak. Two US price increases and supply-chain normalization drove the 550bp claw-back. Source: MNST 10-K FY2025 (filed 2026-02-27).
- The FY2024 US growth scare was real - and the international pivot is now the growth story: Revenue growth decelerated to +4.9% in FY2024 as Celsius and Alani Nu took US shelf space, then reaccelerated to +10.7% in FY2025. International net sales hit $3.44B in FY2025 (~41% of total) and accelerated to 45.2% of Q1 FY2026 net sales. Source: MNST 10-K FY2025; 10-Q Q1 FY2026 (filed 2026-05-07).
- The Coca-Cola relationship is the defining structural feature - moat and concentration risk simultaneously: Coca-Cola Europacific Partners alone was ~15% of FY2025 net sales; Coca-Cola Consolidated ~10%. TCCC owns ~20.9% of MNST common stock. The 10-K FY2025 states the company's 'future performance is substantially dependent on the success of its relationship with TCCC.' Source: MNST 10-K FY2025 Item 1A.
- The Alcohol Brands segment is a documented strategic drag with cumulative impairments exceeding $190M: CANarchy was acquired for ~$330M in February 2022 and has never generated a segment profit. Revenue fell 21.8% to $134.7M in FY2025; the segment posted a $127M operating loss. A second impairment of $53.7M in FY2025 followed a $138.8M charge in FY2024. Source: MNST 10-K FY2025 segment disclosures.
- The balance sheet is exceptional - $3.25B net cash, zero long-term debt, and $2.10B in operating cash flow at FY2025 year-end: Monster used a term loan to fund a $3.77B accelerated buyback in FY2024 (shares fell from ~1.04B to ~973M) then repaid the debt by Q1 FY2025. FY2025 diluted EPS was $1.94 on 984M weighted-average shares. Source: MNST 10-K FY2025.
$8.29 billion of revenue in FY2025. A 55.8% gross margin in a category where a 30% margin would be considered healthy. $2.10 billion in operating cash flow. And then the two questions the Street won't stop asking: is the US market structurally maturing, and how much longer does the Coca-Cola relationship stay the competitive moat rather than becoming the governance constraint?
This is not a turnaround story. Monster's FY2022 gross margin collapse - from 56.1% to 50.3% in a single year on aluminum, freight, and co-packing cost inflation - was painful, but the company proved it has the pricing power to claw back 550 basis points over three years. The FY2024 US growth deceleration to 4.9% was real, but the $3.44B in international revenue at 41% of sales and accelerating is a genuine story, not a cover narrative.
The real test is not whether Monster survived those two shocks. It is whether the structural features that let it absorb them - a 55%+ gross margin, a capital-light model, $3.25B in net cash, and the TCCC distribution infrastructure - remain structurally durable, or whether Celsius, Alani Nu, the UPF regulatory wave, and the Alcohol Brands distraction are the opening moves in something larger.
This is that teardown.
Section 1 - The snapshot
| Metric | FY2025 | Q1 FY2026 | Q1 FY2025 (prior year) |
|---|---|---|---|
| Revenue | $8,294M | $2,353M | $1,855M |
| Revenue YoY | +10.7% | +26.9% | n/a |
| Gross margin | 55.8% | 54.9% | 56.5% |
| Operating income | $2,419M (29.2%) | $730M (31.0%) | $570M (30.7%) |
| Net income | $1,905M | $569M | $443M |
| Diluted EPS | $1.94 | $0.58 | n/a |
| Operating cash flow | $2,098M | $605M (Q1) | $508M (Q1) |
| Cash + investments | $3,253M | ~$2,040M (cash only) | n/a |
| Long-term debt | $0 | $0 | n/a |
The five-year arc:
| Fiscal year | Revenue | YoY growth | Gross margin | Operating margin |
|---|---|---|---|---|
| FY2021 | $5,541M | +20.5% | 56.1% | 32.4% |
| FY2022 | $6,311M | +13.9% | 50.3% | 25.1% |
| FY2023 | $7,140M | +13.1% | 53.1% | 27.4% |
| FY2024 | $7,493M | +4.9% | 54.0% | 25.8% |
| FY2025 | $8,294M | +10.7% | 55.8% | 29.2% |
FY2025 segment revenue split:
| Segment | FY2025 revenue | Share | Segment profit (loss) | YoY |
|---|---|---|---|---|
| Monster Energy Drinks | $7,666M | 92.4% | $2,977M | +11.7% |
| Strategic Brands | $469M | 5.7% | $241M | +8.4% |
| Alcohol Brands | $135M | 1.6% | -$127M | -21.8% |
| Other | $25M | 0.3% | $3M | n/a |
Section 2 - The business model: how they actually make money
Monster Beverage is not a DTC brand. There is no meaningful subscription, no owned e-commerce channel, no direct-to-consumer distribution. Monster is a brand-owner that sells energy drinks through bottlers and distributors - and the primary distributor is The Coca-Cola Company's global network.
The model has three interlocking pieces. First, Monster designs, markets, and sells ready-to-drink (RTD) energy beverages and concentrates (the Strategic Brands segment uses a concentrate model with higher gross margins than finished-goods). Second, co-packers manufacture the finished product - Monster's asset-light manufacturing model means it does not own the production capacity, which keeps capex low ($132M in FY2025 on $8.29B in revenue) and gross margins structurally high. Third, the TCCC distribution network moves product to shelf.
The TCCC relationship is the structural feature that separates Monster from every other energy-drink challenger. In the 2015 strategic transaction, Monster sold its non-energy brands to TCCC, received TCCC's energy brands (now part of Strategic Brands), and received a net $2.15B. TCCC took approximately 20.9% of Monster's common stock. TCCC subsidiaries, related parties, and TCCC-aligned independent bottlers became Monster's primary distribution infrastructure in the US and internationally.
The financial consequence is that two Coca-Cola-system entities alone - Coca-Cola Europacific Partners (CCEP) at ~15% of FY2025 net sales and Coca-Cola Consolidated (CCBCC) at ~10% - account for roughly a quarter of Monster's revenue. That concentration is both the moat (TCCC's direct-store-delivery infrastructure reaches virtually every convenience store in the developed world) and the primary risk factor (the 10-K FY2025 Item 1A states that Monster's "future performance is substantially dependent on the success of its relationship with TCCC").
Where does the 55.8% gross margin come from? The spread between Monster's brand-driven shelf price and aluminum-can, sweetener, co-packing, and logistics input costs. When aluminum spot prices and freight rates surged in 2022, that spread collapsed 580bp in a single year. When Monster implemented US price increases (September 2022, and again in Q4 FY2024) and supply-chain normalization returned input costs to trend, the spread recovered.
International net sales were $3.44B in FY2025 (approximately 41% of total revenue), up from $2.96B in FY2024 and $2.71B in FY2023. Q1 FY2026 international mix accelerated further to 45.2% of net sales ($1.06B of $2.35B), with EMEA growing +52.4% year-over-year and Asia Pacific growing +39.7%. The international segment is structurally the growth driver now.
Here is what the Monster demand culture looks like on TikTok. These are social signals, not load-bearing financial facts.
@dara__studios I created a product film with Michael Jackson's Thriller x Monster Energy drink #michaeljackson #monsterenergy #fyp
♬ original sound - mjfangirl07
@dara__studios (Williams Ken Oluwadara), 3.9M plays, 376.8K likes. Fan-produced product film: the brand inspires organic creative content at consumer-grade production quality. Social signal only.
@keiratanioka THANK YOU @Monster Energy 💚⚡️ #monster #monsterenergy #intern #haul
♬ original sound - keira
@keiratanioka (keira), 86.1K plays, 19.1K likes. Brand gratitude from an intern - Monster's sponsorship culture creates authentic consumer-facing ambassadors. Social signal only.
@retrobeans BUYING 100 CANS OF MONSTER ENERGY #monsterenergy #new #homebargains
♬ original sound - Kyle | Retrobeans
@retrobeans (Kyle | Retrobeans), 73.2K plays, 3.7K likes. Consumer bulk-buy behavior - a signal of habitual, price-inelastic demand at the retail level. Social signal only.
Returns are quietly eating your margin. See by how much.
Get our Real Cost of Returns calculator: plug in your numbers, see the true hit per return.
Check your inbox. We'll send the Real Cost of Returns calculator shortly.
Section 3 - Strengths: the moat that is real
1. Category-leading brand with demonstrated pricing power. Monster Energy Drinks held approximately 29.8% of US energy-drink dollar share as of November 2025 (Beverage Digest data), second only to Red Bull (35.1%). More important than the share figure is the pricing evidence: Monster implemented two separate US price increases - September 2022 and Q4 FY2024 - and total revenue grew through both without material volume destruction. FY2025 case volume grew +13.3% alongside the Q4 FY2024 price increase, and Q1 FY2026 revenue was +26.9% with operating margin expanding to 31.0%. A brand that can take two price increases in three years and accelerate volume is demonstrating genuine pricing power. Source: 10-K FY2025 MD&A; 10-K arc FY2022.
2. 55%+ gross margins and $2.1B in annual operating cash flow - structural, not cyclical. The FY2021-to-FY2025 gross margin arc is the clearest proof of the model's durability: even at the FY2022 trough (50.3%), Monster was generating gross margins that most CPG businesses would consider outstanding. The recovery to 55.8% was driven by pricing and supply-chain normalization, not financial engineering. FY2025 operating cash flow was $2.10B on $8.29B in revenue - a 25.3% OCF-to-revenue ratio that funds buybacks, capex, and a $3.25B net-cash position simultaneously. Capital intensity is low: FY2025 capex was $132M (1.6% of revenue). Source: 10-K FY2025.
3. The Coca-Cola distribution infrastructure is a genuine structural moat. TCCC's direct-store-delivery network is one of the most extensive commercial distribution systems in the world, covering retail, foodservice, and on-premise in virtually every major developed market. Monster cannot replicate that infrastructure independently on any practical timeline - the cost would be in the billions. The TCCC system gave Monster immediate access to international markets that would otherwise take a decade to build organically, which is why international net sales grew from $2.71B in FY2023 to $3.44B in FY2025 (a +27% increase in two years). Source: 10-K FY2025 Item 1, Note on customer concentration.
4. International runway at 41% of sales and accelerating. Monster's international net sales reached $3.44B in FY2025 (~41% of total), and Q1 FY2026 international mix hit 45.2% - with EMEA growing +52.4% and Asia Pacific growing +39.7% year-over-year. The energy-drink category in emerging markets is at an earlier maturity stage than the US convenience-store channel, and Monster's TCCC distribution access positions it to capture that growth without building infrastructure. This is the offsetting growth engine to the US maturation story. Source: 10-Q Q1 FY2026 segment notes.
Section 4 - Weaknesses: the cracks in the 10-Q
1. US competitive pressure materially decelerated growth - and has not fully reversed. Monster's total revenue grew only 4.9% in FY2024 versus 13.1% in FY2023. The driver was US volume deceleration as Celsius Holdings and Alani Nu took meaningful convenience-store shelf space in the female-targeted and health-adjacent energy-drink segments. Beverage Digest data (November 2025) showed Celsius at approximately 12% of US energy-drink dollar share, up from a rounding error four years earlier. Monster's US average per-case price fell 1.6% in FY2025 per the 10-K arc analysis, suggesting the company is absorbing promotional pressure to maintain volume even while growing internationally. The 10-K FY2025 Item 1A risk factors list competitive pressure in the energy-drink category as a top business risk, though Monster has never named Celsius or Alani Nu by name in SEC filings. Source: 10-K FY2025 Item 1A; 10-K arc FY2024; Beverage Digest November 2025.
2. Gross-margin sensitivity to aluminum and freight - the FY2022 pattern can recur. The 10-K FY2025 explicitly identifies aluminum cans, PET bottles, high-fructose corn syrup, juice, and co-packing fees as the primary cost-of-sales exposures. The FY2022 experience proved that when aluminum spot prices and freight rates spike simultaneously, Monster's gross margin can move 200+ basis points in a single quarter. The 10-K FY2022 risk factor states: "We do not have long-term supply contracts for most of our raw materials, including aluminum cans, which means we are exposed to spot-price movements." As of FY2025, Monster remains co-packer-dependent and aluminum-exposed. Q1 FY2026 gross margin stepped back 90bp from the FY2025 full-year level to 54.9%, consistent with the seasonal and input-cost pattern that precedes full-year results. Source: 10-K FY2022 Item 1A; 10-K FY2025 MD&A; 10-Q Q1 FY2026.
3. Coca-Cola-system concentration is simultaneously the moat and the primary structural risk. The 10-K FY2025 Item 1A states verbatim: "the Company and TCCC have extensive commercial arrangements and, as a result, the Company's future performance is substantially dependent on the success of its relationship with TCCC." CCEP alone was ~15% of FY2025 net sales; CCBCC was ~10%. TCCC owns approximately 20.9% of Monster's common stock (FY2025 10-K, as of February 13, 2026). If TCCC were to develop a competing energy brand, materially change distribution terms, or reduce its ownership stake, Monster's go-to-market and governance dynamics would both be disrupted. This is a risk that cannot be managed away without dismantling the core distribution model - which is not a realistic prescription. Source: 10-K FY2025 Item 1A.
4. The Alcohol Brands segment is a documented strategic drag. CANarchy Craft Brewery Collective was acquired in February 2022 for approximately $330M. It entered MNST's books in the same year that hard seltzer hit its secular peak and began declining. The segment has never posted a profit. By FY2025: $134.7M in revenue (-21.8% YoY), a $126.96M segment operating loss, and a $53.7M impairment charge on finite-lived intangibles and PP&E. Cumulative impairments from the segment through FY2025 exceed $190M ($138.8M in FY2024 + $53.7M in FY2025). The core problem identified in the 10-K arc analysis is structural: the TCCC distribution network does not extend to US alcohol (three-tier alcohol distribution requires separate licensed wholesalers), so Monster had no distribution advantage in the category it paid $330M+ to enter. Source: 10-K FY2025 segment disclosures.
Section 5 - Opportunities and threats
The opportunity side is straightforward for a company with 55%+ gross margins and the TCCC global footprint.
International expansion is the clearest near-term opportunity. Monster's EMEA segment grew +52.4% in Q1 FY2026, which is not a penetration story of a company that has maximized the opportunity - it is a distribution story of a brand gaining velocity in markets where energy-drink per-capita consumption is still far below US convenience-store saturation. Asia Pacific at +39.7% tells the same story. The TCCC infrastructure is the unfair advantage: Monster can enter a new market and get on-shelf at Coca-Cola-distribution speed.
Innovation - particularly the zero-sugar and reduced-caffeine product lines - is a defensive opportunity. Monster Ultra (zero-sugar) has been one of the company's fastest-growing sub-brands. Reign Storm and wellness-adjacent SKUs compete in the health-adjacent energy segment where Celsius has taken share. These are not complete answers to the Celsius challenge, but they represent the product-line expansion that a 55%+ gross-margin company can fund without compromising its financial structure.
Strategic Brands carries an unusual opportunity hidden in the segment's 68.7% gross margin (FY2025) - higher than Monster Energy Drinks' 55.7%. The concentrate model for brands like NOS, Full Throttle, Burn, and Predator generates structurally higher margins, and these brands have international distribution through the same TCCC network. Source: 10-K FY2025 segment disclosures.
On the threat side: Celsius is the most credible US competitive threat Monster has faced since Red Bull's US ascent. Unlike prior challengers, Celsius has health positioning (thermogenic claims), female appeal, a full convenience-store distribution deal with PepsiCo (executed 2022), and the scale to price competitively. Alani Nu was acquired by Celsius Holdings in 2024, consolidating two of Monster's fastest-growing challengers under one entity with PepsiCo distribution. The US energy-drink aisle is becoming a three-player wall: Red Bull, Monster, and Celsius/Alani. Monster's US per-case price softness (-1.6% in FY2025 per arc analysis) suggests the promotional environment is real.
The UPF/MAHA regulatory risk, first named explicitly in the FY2025 10-K, is the medium-term threat that is hardest to size. If federal or state governments impose age restrictions, caffeine labeling requirements, or UPF-targeted taxes on energy drinks, the convenience-store channel - Monster's core US volume driver - would be directly impaired. The FY2025 10-K added a dedicated risk factor: "officials in the current US presidential administration have articulated significant concerns about highly processed or ultra-processed foods." No material financial impact yet. Watch for regulatory developments in California and at the FDA caffeine-disclosure level. Source: 10-K FY2025 Item 1A.
FX headwinds are a growing risk as international grows toward 50%+ of revenue. Q1 FY2026 showed a $14.6M unfavorable foreign currency effect on cash despite +37.9% international revenue growth. As EMEA and APAC become larger share of total, dollar strength will be an increasingly visible earnings headwind. Monster does not appear to use material FX hedging per the filing disclosures. Source: 10-Q Q1 FY2026 cash flow statement.
Section 6 - The macro environment
Monster is flying through three distinct macro forces in FY2025-FY2026, and their direction points mostly the same way for now.
The energy-drink category is structurally growing globally, with per-capita consumption outside the US significantly below US levels - meaning international expansion is genuine market development, not market-share theft. The 2025-2026 period shows this clearly: EMEA growing +52% and APAC growing +40% in a single quarter is not a base-effect anomaly; it reflects a category that is expanding its consumer base in markets that were underpenetrated even five years ago.
The functional-beverage consumer trend - clean energy, zero-sugar, performance nutrition - is a double-edged force for Monster. It validates the energy-drink category's relevance with health-conscious consumers (Monster Ultra, Reign, Reign Storm are positioned here) while also inviting Celsius's specific product claim set. The category is not at risk from the trend; the question is whether Monster or Celsius captures the health-adjacent consumer who enters the energy-drink category through functional positioning.
Input costs - aluminum, sweeteners, and packaging - are the most direct margin variable. The FY2022 experience proved that a simultaneous aluminum and freight shock can compress Monster's gross margin by 500+ basis points in a year. Current aluminum spot prices as of mid-2026 are not at 2022 shock levels, but Monster's lack of long-term aluminum supply contracts (disclosed in the 10-K) means it has limited ability to pre-hedge against a recurrence. Co-packing fee inflation (driven by co-packer consolidation and labor costs) is a secondary input risk.
The GLP-1 weight-loss drug category represents an emerging demand question for energy drinks. Caloric beverages - including some Monster variants - may see consumption headwinds from GLP-1 users reducing overall caloric intake. Monster's pivot to zero-sugar variants (Ultra, Reign Storm) is the product-level response, but the magnitude of any GLP-1 demand effect on the energy-drink category is not yet measurable in the filings. This is a watch item for FY2026-FY2027.
Section 7 - The CFO verdict and the operator bridge
Here is the read on Monster Beverage from a CFO's vantage point, including where I agree with the Street consensus, where I disagree, and what the Eightx read adds.
Where the Street is right: The bull thesis centers on Monster as a "category leader with a long runway" - defensive brand, high margins, international growth, pricing power. That framing is correct on the fundamentals. The 55.8% gross margin, $2.10B OCF, and $3.25B net-cash balance sheet are not accidents. They reflect a capital-light model (co-packer manufacturing, TCCC distribution) that earns structural margin without owning fixed assets at scale. When input costs normalized and pricing held, the margin recovered exactly as the model predicts. The bears who focused on the FY2024 4.9% US growth deceleration and declared the category maturing were looking at one year of one geographic segment through a narrow lens.
Where the Street gets it wrong: The consensus treats the TCCC relationship as an unambiguous moat. It is - and it is also the most structurally unhedgeable risk in the model. CCEP at 15% of revenue and CCBCC at 10% means Monster's single-largest "customer" is also its single-largest shareholder's distribution network. If TCCC's strategic interests diverge from Monster's (a competing TCCC energy brand, a distribution-term renegotiation, or a sale of the TCCC stake), Monster cannot simply pivot to an alternative distribution infrastructure. The "TCCC relationship is a moat" framing ignores that it is simultaneously the concentration risk the 10-K puts at the top of Item 1A. A common analyst prescription - "diversify off TCCC distribution" - is not feasible without dismantling the international growth engine. The right operator posture is to understand this dependency clearly, not to minimize it.
The Eightx differentiated read: The Alcohol Brands segment is the clearest strategic error in the recent MNST history, and the market has mostly priced it as a write-off distraction. I agree with that framing, but I want to be specific about the mechanism: Monster entered a category (craft beer/hard seltzer) where the TCCC distribution advantage does not transfer. US alcohol distribution requires three-tier licensed wholesalers, which is a completely separate infrastructure from TCCC's DSD network. Monster paid ~$330M to enter a declining category with no distribution advantage. The result: cumulative impairments exceeding $190M, a $127M segment operating loss in FY2025 alone, and a segment that now generates only $135M in revenue and is shrinking 22% per year. The takeaway for any operator: your distribution moat is channel-specific. It does not transfer automatically into adjacent categories.
The operator bridge. Your $5-80M brand almost certainly has a version of the Monster pattern: a margin structure earned through brand positioning that gets tested by a cost shock or a competitive entrant - and the test reveals whether the margin was structural or situational. Monster's FY2022 cost shock hit 50.3% gross margin at the trough; the brand survived because consumers accepted price increases. The FY2024 Celsius share grab hit US growth at 4.9%; the brand survived because international compensated. The test is not whether the bad quarter happened - it is whether the pricing power and the distribution depth held when the bad quarter arrived.
I have seen this pattern in client work: a brand with high gross margins that loses a key wholesale distribution agreement or gets squeezed by a commodity spike responds one of two ways. If the premium position is structural (consumers are choosing the brand, not just accepting it on the shelf), the brand raises price and volume follows. If the premium position is situational (the brand is high-margin because competitors haven't entered the segment yet), the price increase doesn't stick and margin compresses permanently. Monster's multi-year price-increase evidence - two increases, volume growth through both - is the most direct proof that the premium is structural.
As we discussed in our Celsius teardown and our YETI teardown, the macro test for any high-margin consumer brand is not whether a single bad quarter compresses margin - it will. The test is whether the recovery trajectory is observable in the subsequent 2-3 quarters of pricing and volume data.
Early-warning scorecard - five lines that catch the Monster pattern 12 months early in your own business:
- Gross margin vs. prior-year quarter, split by price/mix and volume: if gross margin is moving on volume alone, cost pressure is hiding in the mix. If price/mix turns negative while volume grows, a competitor is forcing promotional response. Monster's FY2024 US per-case price softness was the leading indicator of the competitive pressure - visible before the revenue deceleration became dramatic.
- Distributor or customer concentration as a % of revenue: when two customers represent 25% of revenue and both are subsidiaries of your largest shareholder, a TCCC relationship disruption is a balance-sheet event, not just a revenue event. Track customer concentration in AR quarterly; a change in payment terms by CCEP would appear here before it appears in revenue.
- Input cost index vs. gross margin trend: aluminum LME spot + freight index (e.g., Freightos) are publicly available leading indicators for Monster's cost-of-sales pressure. In FY2022, the aluminum spike and freight surge were visible in commodity markets 2-3 quarters before they appeared in Monster's reported gross margin. Build a simple tracker.
- Segment operating loss accumulation vs. goodwill balance: when a segment is posting recurring losses while sitting on goodwill, the impairment charge is inevitable. Monster's Alcohol Brands goodwill was $86M at FY2023 year-end (after the CANarchy acquisition step-up); the FY2024 impairment took $138.8M. For any brand carrying acquisition goodwill on a loss-making unit, watch this ratio - it telegraphs the write-down 6-12 months in advance.
- International revenue mix vs. FX hedging: when international exceeds 40% of revenue and the company does not disclose a material FX hedging program, dollar strength becomes a direct EPS headwind. Monster's Q1 FY2026 showed a $14.6M unfavorable FX effect on cash despite explosive top-line international growth. As international approaches 50% of revenue, FX management becomes an explicit CFO responsibility.
If you want to run this scorecard against your own numbers before your next cost shock or competitive entrant arrives, that is a fractional CFO conversation. The analysis takes a few hours. The cost of not doing it shows up in the quarter when the gross margin moves 500 basis points in the wrong direction.
Sources and methodology
SEC EDGAR is the primary source for every financial figure in this post. Monster Beverage Corporation (CIK 0000865752) files on SEC EDGAR under the 10-K and 10-Q form types. The specific filings used: 10-K FY2025 (filed 2026-02-27, accession 0001104659-26-020831); 10-Q Q1 FY2026 (filed 2026-05-07, accession from SEC EDGAR CIK 0000865752); 10-K FY2024 (filed 2025-02-28, accession 0001410578-25-000248); 10-K FY2023 (filed 2024-02-29, accession 0001104659-24-029425); 10-K FY2022 (filed 2023-03-01, accession 0001104659-23-027245); 10-K FY2021 (filed 2022-02-28, accession 0001104659-22-028182). Revenue, gross margin, operating income, net income, OCF, inventory, segment data, and all balance sheet figures are taken directly from XBRL financial statements or the primary filing text.
The EDGAR XBRL data (pulled 2026-06-24 from SEC EDGAR) provided the structured financial spine: annual figures FY2021-FY2025, quarterly data FY2024 Q3 through Q1 FY2026, segment revenue and gross profit by segment, balance sheet selected items, share repurchase history, and the 10-K filing index with accession numbers.
Our research (conducted 2026-06-24) provided the business-model analysis, customer concentration detail (CCEP ~15%, CCBCC ~10%), segment gross margin breakdowns (Monster Energy Drinks 55.7%, Strategic Brands 68.7%, Alcohol Brands 24.1%), Q1 FY2026 income statement and geographic revenue details, and leadership/succession analysis. All figures were cross-checked against the EDGAR XBRL data before inclusion.
The 10-K arc analysis (FY2021-FY2025) provided the risk-factor evolution - when TCCC concentration risk first appeared, the gross margin compression and recovery arc, the Alcohol Brands timeline, the US competitive pressure arc, and the FY2025 UPF/MAHA risk disclosure analysis. This source identified the verbatim 10-K FY2025 Item 1A language on TCCC dependency and the specific FY2024 Alcohol Brands impairment figures.
Beverage Digest (November 2025) provided the US energy-drink market share data showing Monster at 29.8% and Red Bull at 35.1% dollar share. This is a trade publication data point, not an SEC filing, and is used for competitive context only.
The analyst/thesis layer of our research synthesized Wall Street consensus (Barchart: 24 analysts, "Moderate Buy"; TickerNerd: 15 Buy / 11 Hold / 1 Sell; median price target ~$93 as of June 2026) and identified the bull/bear debate structure engaged in Section 7.
Data limitations. Diluted EPS for FY2021 and FY2022 are not available via EDGAR XBRL extraction (the XBRL tagging for those years returns only 2008-2011 era figures); these figures are therefore not reported for those years. Segment-level gross margins for FY2021/FY2022 are not broken out in XBRL (narrative only). TCCC's approximately 20.9% common-stock ownership is stated in the FY2025 10-K Item 1A and Note 18 (as of February 13, 2026). US per-case price data (-1.6% in FY2025) is from the 10-K arc analysis, which sourced it from 10-K FY2025 MD&A narrative; this figure was not independently confirmed in the XBRL data. Q4 FY2024 standalone figures are derived (FY2024 annual minus Q1+Q2+Q3 sum) and not separately filed. This post reflects filings and disclosures current through June 24, 2026.
Social signal is colour only. The three TikTok embeds in Section 2 are from the Monster Energy consumer culture and carry no financial claim. @dara__studios (3.9M plays), @keiratanioka (86.1K plays), and @retrobeans (73.2K plays) were selected as clearly Monster Energy-focused English-language content. The @energy_hunters entry was excluded (non-English, Russian-language content). The @monsterinius entries were eligible but lower-reach; @dara__studios, @keiratanioka, and @retrobeans were selected for variety of content angle (fan creation, brand ambassador, consumer behavior).
Frequently asked questions
how does monster beverage actually make money?
Monster sells energy drinks almost entirely through bottlers and distributors - there is no material DTC channel. The Coca-Cola system (CCEP, CCBCC, and TCCC affiliates globally) handles distribution in most markets. Monster earns revenue when bottlers take delivery of finished product or concentrate, at prices that reflect the Monster brand premium over aluminum-can + sweetener + co-packing cost. The gross margin of 55.8% in FY2025 reflects that brand premium over input costs.
what caused monster's gross margin to collapse in 2022?
FY2022 gross margin fell 580bp from 56.1% to 50.3% - the sharpest single-year decline in the company's recent history. Three simultaneous pressures: (1) aluminum-can cost inflation as supply chains fractured post-COVID, (2) freight and logistics cost surge, and (3) co-packing fee inflation as Monster relied on third-party co-packers to maintain volume. Management chose to prioritize product availability over margins through H1 FY2022. A US price increase took effect September 1, 2022. Full recovery to near-peak margins took three years. Source: 10-K FY2022 and 10-K FY2025 MD&A.
what is monster's relationship with coca-cola?
In 2015, Monster and The Coca-Cola Company executed a strategic transaction: Monster sold its non-energy brands to TCCC; TCCC transferred its energy brands to Monster; and TCCC paid Monster a net $2.15B and became an approximately 20.9% shareholder. The TCCC distribution network (its subsidiaries, bottlers, and affiliates globally) became Monster's primary go-to-market infrastructure worldwide. As of FY2025, Coca-Cola Europacific Partners accounted for ~15% of net sales and Coca-Cola Consolidated accounted for ~10%. The 10-K FY2025 Item 1A names this as the company's top operational risk.
is the alcohol brands segment being shut down?
It appears to be in managed wind-down, though Monster has not formally announced a closure or sale. Alcohol Brands revenue fell 21.8% to $134.7M in FY2025 and the segment posted a $126.96M operating loss. Cumulative impairments from the segment exceeded $190M by FY2025 year-end ($138.8M in FY2024 + $53.7M in FY2025). The segment was built from the CANarchy craft-beer acquisition (February 2022, ~$330M) and has never produced a profit. The 10-K FY2025 does not announce closure, but the trajectory is consistent with rationalization.
how serious is the celsius and alani nu competitive threat to monster?
Serious enough to have materially slowed US revenue growth. MNST's total revenue grew only 4.9% in FY2024 versus 13.1% in FY2023, with US volume growth decelerating sharply as Celsius took ~11-12% of US energy-drink dollar share (per Beverage Digest, November 2025) and Alani Nu expanded in the female-targeted segment. Monster's response has been to raise prices rather than compete on value, expand internationally (now 41%+ of sales), and acquire defensive brands (Bang Energy, from bankruptcy in 2023). The US is now a mature share-defense story; international is the growth vector.
does monster beverage have debt?
Essentially no long-term debt at FY2025 year-end. The balance sheet shows $0 long-term debt at December 31, 2025 (down from $373.9M at December 31, 2024). Monster drew on a term loan facility to fund the $3.77B accelerated share-repurchase program in FY2024, then repaid it by Q1 FY2025. Net cash and investments at December 31, 2025 totaled approximately $3.25B (cash $2.09B + short-term investments $677M + long-term investments $487M). Source: 10-K FY2025 balance sheet.
what is the make america healthy again regulatory risk for energy drinks?
The FY2025 10-K disclosed for the first time that the US Administration's "Make America Healthy Again" agenda and the January 2026 Dietary Guidelines (which urge avoidance of highly processed foods) represent an emerging regulatory risk for Monster. Potential channels: mandatory caffeine disclosure requirements, synthetic color additive restrictions, potential age-restriction proposals at the state level, or UPF-targeted taxation. As of the FY2025 filing, there is no material financial impact. Monster has launched zero-sugar and reduced-caffeine variants but the core product is a caffeinated, sweetened energy drink structurally exposed to UPF regulatory action. Source: 10-K FY2025 Item 1A.
who runs monster beverage now?
Hilton H. Schlosberg became sole CEO in June 2025, after serving as Co-CEO alongside co-founder Rodney C. Sacks from January 2021 through June 2025. Schlosberg has been with the company since 1990 - 35 years - including ~25 years as CFO before being elevated. Thomas J. Kelly has served as CFO since January 2021. Sacks continues as Executive Chairman through at least the end of 2026. The governance model remains founder-influenced with TCCC holding ~20.9% of common stock. Source: 10-K FY2025; Food Dive, March 11, 2025.