
Supply Chain
Largest US Import Categories for DTC 2026
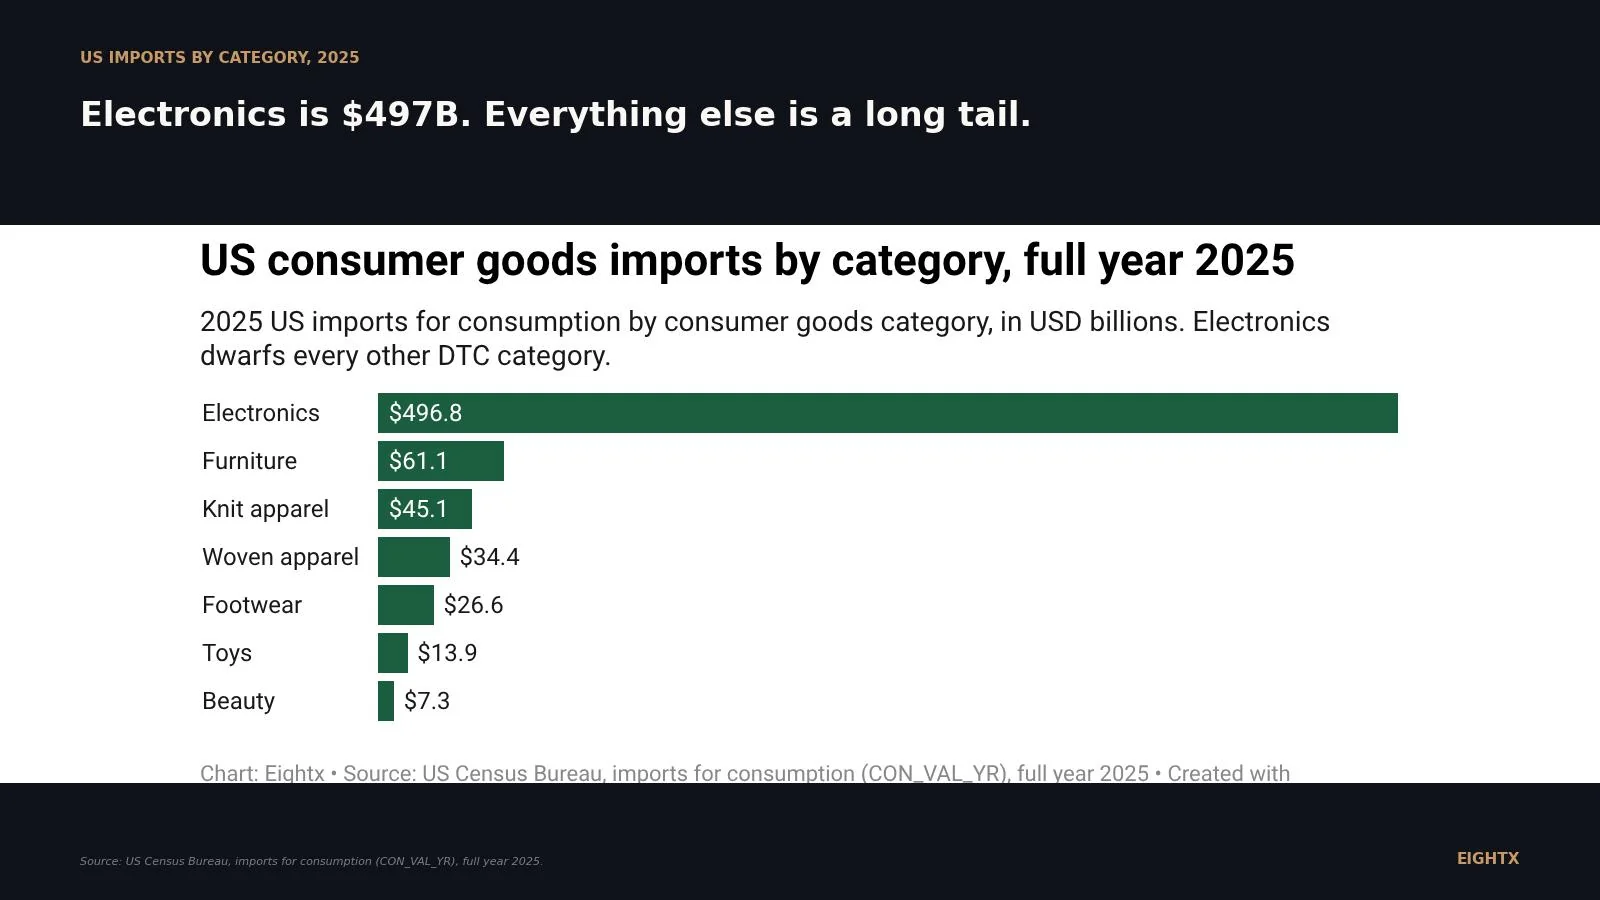
By full-year 2025 US Census data, electronics is the largest consumer-goods import category at roughly $497 billion, more than eight times furniture at $61 billion. Apparel, footwear, toys, and beauty follow well behind. For DTC founders, category scale tells you where tariff and sourcing risk concentrates.
Key Takeaways
- Electronics (HS 85) led all consumer-goods imports at about $497 billion in 2025, roughly 73% of the seven categories tracked here combined.
- Furniture was a distant second at about $61 billion, then knit apparel at $45 billion and woven apparel at $34 billion.
- Footwear ($27B), toys ($14B), and beauty ($7B) round out the bottom, but every one of these is heavily import-dependent.
- Scale is a tariff multiplier: a 10-point duty swing on electronics moves nearly $50 billion of landed cost across the category; the same swing on beauty moves about $0.7 billion.
- Smaller categories like beauty and toys are not safe, they just have less aggregate buffer and often more concentrated origin risk.
If you run a DTC or CPG brand, your supply chain is somebody else's headline. Tariffs, container rates, a port slowdown: the macro number that moves your landed cost is set far upstream of your Shopify dashboard. So it is worth knowing, in hard dollars, how big each import flow actually is. Scale is where risk concentrates.
Here is the 2026 picture, straight from full-year 2025 US Census data. Across seven consumer-goods categories that matter to DTC, one of them is not like the others. Electronics doesn't lead the pack so much as eat it.
Turning import exposure into a margin plan is the job of a fractional CFO for ecommerce.
The ranking: electronics, then everyone else
I pulled imports for consumption (the Census measure of goods that actually cleared customs) for full-year 2025 across seven HS categories. Ranked by value, the gap at the top is almost comical.
Electronics (HS 85, electrical machinery and equipment) came in at roughly $497 billion. The next largest, furniture, was about $61 billion. That is more than an 8-to-1 ratio between first and second place. Across the seven categories here, electronics alone is about 73% of the combined total.
| Category | HS code | 2025 imports |
|---|---|---|
| Electronics | 85 | $496.8B |
| Furniture | 94 | $61.1B |
| Knit apparel | 61 | $45.1B |
| Woven apparel | 62 | $34.4B |
| Footwear | 64 | $26.6B |
| Toys | 9503 | $13.9B |
| Beauty and skincare | 3304 | $7.3B |
Combine the two apparel chapters (61 knit and 62 woven) and clothing is about $80 billion, which would put it second ahead of furniture. But even consolidated apparel is barely a sixth of electronics. The point stands: this is one giant category and a long tail.
Why electronics is so far ahead
Two forces stack. First, unit value. Electronics (HS 85) is phones, laptops, displays, semiconductors, batteries, and the components inside almost everything else. These are high-dollar goods, so a single container is worth far more than a container of T-shirts. Second, import dependence. The US makes very little of this domestically at consumer scale, so nearly the entire category arrives from offshore, mostly Asia.
That combination, high value times near-total import reliance, is what pushes electronics to half a trillion dollars while footwear, a category almost everyone buys, sits at $27 billion. It is not that Americans buy more electronics by count. It is that each unit carries far more landed cost, and essentially all of it crosses a border.
A caveat worth saying out loud, because it changes how you read the chart: HS 85 is the full chapter "electrical machinery and equipment." That includes industrial and component electronics (chips, circuit boards, batteries) sold business-to-business, not just the finished consumer devices a DTC brand ships. The $497 billion is the chapter, not a narrow consumer slice. The ranking is still the right shape, but if you sell consumer electronics, your slice of that number is smaller than the headline.
For the deeper origin breakdown of who supplies these categories, see where DTC products are made in 2026, and for the China-specific concentration that sits underneath several of these flows, China import dependence for DTC. Because electronics is the heavyweight, we mapped its duty exposure separately in the electronics import tariff map.
See your real margin on every order.
Get our Contribution Margin calculator: COGS, shipping, fees, ads, what's left.
Check your inbox. We'll send the Contribution Margin calculator shortly.
What the scale means for tariff exposure
Here is the operator translation. Category size is a proxy for how much absolute landed cost moves when a duty rate changes. A 10-percentage-point tariff swing on electronics shifts close to $50 billion of cost across the category in a year. The same 10 points on beauty moves about $730 million. The macro stakes, and the lobbying pressure, scale with the bars on that chart.
| Category | 2025 imports | Cost moved by a 10-point duty swing |
|---|---|---|
| Electronics | $496.8B | $49.7B |
| Furniture | $61.1B | $6.1B |
| Apparel (knit + woven) | $79.5B | $7.9B |
| Footwear | $26.6B | $2.7B |
| Toys | $13.9B | $1.4B |
| Beauty and skincare | $7.3B | $0.7B |
That cuts two ways for a founder:
- Big categories get the policy attention. Electronics and apparel are large enough that tariff actions, exemptions, and deals tend to target them directly, so the rules change often and you have to watch them. We track that volatility in our work on the US-China tariff deal's impact on ecommerce.
- Small categories get less buffer. Beauty and toys are tiny in aggregate, but that does not make your brand safe. It means less collective bargaining power and often more origin concentration, so a single-country disruption or a quiet rate change can hit your COGS with no warning.
When operators tell me tariffs are killing them, the problem is usually the unpredictability, not the headline percentage. One founder sourcing a hero product from Europe told me the real pain was "the volatility in it," not the rate itself. My first question back is always the same: what is your contribution margin right now, after cost of goods, freight, and ads? If you do not know that number cold, the chart above is just trivia. If you do, you can price the volatility instead of fearing it.
The 2026 wrinkle: de minimis and the stacked duty
There is a structural change underneath all seven of these categories that did not exist a year ago. The duty-free de minimis exemption (Section 321, the $800-per-parcel rule) was suspended for all countries in late August 2025, with postal shipments moving to ad valorem duty in early 2026. In plain terms: every cross-border DTC parcel is now dutiable. The arbitrage that let small, low-value categories ship straight from Asia under the threshold is gone.
On top of that, the 2026 duty architecture stacks per origin, not per category. A typical line carries a base MFN rate, then Section 301 (China), then Section 232 (metals), then a roughly 10% global surcharge that took effect in February 2026. The categories that look small on the ranking chart are not necessarily the safe ones, because the rate is built from where the goods come from, not how big the category is nationally.
Here is the nuance worth flagging, and the reason the biggest flow is not automatically the biggest rate hit: electronics may sit inside an exclusion from the 10% global surcharge even though it is the largest category by a wide margin. Trade trackers report electronics, pharmaceuticals, and USMCA-compliant goods among the carve-outs, but the exclusion is HS-line and origin dependent, so treat it as "confirm by your own HS code," not as settled fact. Meanwhile, modeling from the Yale Budget Lab suggests apparel becomes one of the hardest-hit consumer price categories if the surcharge sticks. The pattern we see again and again is that founders react to the category headline when the rate that actually lands on their P&L is set three layers down, by origin and HS line.
What to do about it
Knowing your category is big or small is trivia until you tie it to your own P&L. Here is the work I run with brands at this stage:
- Pin down your HS codes. Every SKU has one, and it drives your duty rate. Get the exact codes from your customs broker, not a guess, because misclassification is both an overpayment risk and an audit risk.
- Build a landed-cost model per SKU. Product cost, freight, duty, broker fees, and insurance, all the way to the dock. We have rebuilt these for brands that were double-counting shipping or allocating carton costs wrong, and the corrected number is almost always worse than the founder hoped. Gross margin off the wholesale invoice is not your real margin. Landed cost is.
- Stress-test a duty swing against contribution margin, not gross margin. Run plus or minus 10 to 25 points of tariff on your top SKUs and watch what it does to contribution margin (revenue less all variable costs), which you generally want to hold above 20%. If a plausible rate change turns a hero SKU unprofitable, you have a sourcing problem to solve now, not later.
- Map origin concentration. If one country supplies most of a category for you, that is your single point of failure. When I talk to founders running a brand this size, single-supplier concentration is the risk they have most often not priced. One operator only realised their main revenue product came from a single factory for whom they were the only customer when we mapped it. Quantify what a second source would cost in unit price and lead time before you are forced to find one.
- Hold price discipline. When duties rise, the reflex is to eat the cost or panic-discount. Neither is a plan. Model the demand response, then decide deliberately whether you pass the tariff through, absorb it, or split it with the customer. A confident, partial pass-through that you can defend on value usually beats either extreme, and it beats reacting to a headline that may get reversed next week.
The chart tells you where the money is. Your landed-cost model tells you where you are exposed. Do not confuse the two: a small category can still sink a brand that sources all of it from one place.
Methodology
Figures are full-year 2025 US imports for consumption (Census variable CON_VAL_YR, cumulative through December) by HS commodity code, pulled from the US Census Bureau international trade program and verified live via the Census API: electronics (HS 85), furniture (HS 94), knit apparel (HS 61), woven apparel (HS 62), footwear (HS 64), toys (HS 9503), and beauty and skincare (HS 3304). Imports for consumption measures goods that cleared US customs, the closest official proxy for what was actually bought; it excludes goods sitting in bonded warehouses.
Values are rounded to the nearest tenth of a billion. Category definitions follow the full HS chapter or heading, so the granularity is intentionally mixed: electronics, furniture, apparel, and footwear are 2-digit chapters, while beauty (HS 3304) and toys (HS 9503) are 4-digit headings. That mix matches the way operators actually think about their categories, but it means HS 85 captures more than the narrow DTC slice (it includes industrial and component electronics, not just finished consumer devices).
Percentages are computed across the seven categories shown and are not shares of total US imports, which were roughly $3.4 trillion in 2025. The seven-category total is about $685 billion; electronics is 72.5% of it, and the electronics-to-furniture ratio is 8.1 to 1. The "cost moved by a 10-point duty swing" column is simply 10% of each category total, an illustration of absolute stakes, not a forecast of any specific rate.
Tariff context (de minimis suspension, the Section 122 global surcharge, the reported electronics exclusion) is web-sourced from trade trackers and Yale Budget Lab modeling, cited as policy context rather than Census data. Tariff rules are HS-line and origin specific and change frequently, so confirm your own exposure with your customs broker. Census revises monthly, so full-year 2025 figures can shift in later releases; we re-pull the seven HS codes before any major refresh.
Frequently Asked Questions
what is the largest us import category for consumer goods in 2026?
Electronics. Full-year 2025 US Census data shows electrical machinery and equipment (HS 85) imports for consumption at about $497 billion, far ahead of any other consumer-goods category. It is more than eight times the size of furniture, the next largest in this set.
how much does the us import in furniture and apparel?
In 2025, US furniture imports (HS 94) were about $61 billion, knit apparel (HS 61) about $45 billion, and woven apparel (HS 62) about $34 billion, per Census imports-for-consumption data. Combined apparel was roughly $80 billion across the two HS chapters.
why does electronics dwarf other import categories?
Electronics (HS 85) covers a huge range of high-value goods, from phones and laptops to chips, batteries, and components, and almost all of it is made offshore. The combination of high unit value and near-total import dependence pushes the category to roughly $497 billion, an order of magnitude above apparel or footwear.
does a bigger import category mean a bigger tariff hit for my brand?
Not for your P&L directly. Category size sets the macro stakes and the policy attention, but your own hit depends on your HS codes, your origin mix, and your margin. A small category sourced from one high-tariff country can hurt your brand more than a large category you barely touch.
which smaller import categories carry the most tariff risk for dtc?
Toys (about $14 billion) and beauty (about $7 billion) are the smallest in this set, but both are highly import-dependent and origin-concentrated, so a duty change or a single-country disruption can hit landed cost hard. Small aggregate value does not mean low risk for an individual brand.
did the end of de minimis change which categories are most exposed?
Yes, at the margin. The $800 de minimis exemption (Section 321) was suspended for all countries in late 2025, so every cross-border parcel is now dutiable. That removed the arbitrage the smallest, low-value categories leaned on hardest, which raises landed cost most for brands that shipped direct from Asia.
what hs codes should a dtc brand know for sourcing?
The core consumer HS chapters are 85 electronics, 94 furniture, 61 knit apparel, 62 woven apparel, 64 footwear, 3304 beauty and skincare, and 9503 toys. Your customs broker classifies each SKU, and the HS code drives the duty rate, so knowing yours is the first step to modeling tariff exposure.
where does this import data come from?
From the US Census Bureau international trade program, specifically imports for consumption (CON_VAL_YR) for full-year 2025, pulled by HS commodity code. It measures the value of goods that cleared customs into the US, which is the closest official proxy for what Americans actually bought.