
News
Ocean Freight Is Spiking Again. Rebuild It Into Your Landed Cost Before It Eats Your Margin.
About 11% of the global container fleet, roughly 3.7 million TEU, is stuck waiting for berths, the worst port congestion in four years. Drewry's World Container Index jumped 9% to $4,530 per 40-foot container, and Xeneta spot rates on Asia-to-Europe lanes rose as much as 65% in a month. For DTC brands, the CFO move is to rebuild landed cost into unit economics and re-time reorders, not panic-order.
Key Takeaways
- About 11% of the global container fleet, roughly 3.7 million TEU, is sitting idle waiting for berths, the highest congestion level in four years, per Linerlytica. That is a capacity problem, not a demand surge, and it is pushing rates up anyway.
- Drewry's World Container Index rose 9% to $4,530 per 40-foot container. Shanghai to Genoa jumped 10% to $6,360 and Shanghai to Rotterdam rose 7% to $4,682, both per 40-foot box.
- Xeneta spot rates moved even faster: Far East to North Europe rose 65% in a single month to $4,763 per FEU, and Far East to the Mediterranean rose 40% to $6,044 per FEU.
- The mechanism is congestion, not scarcity. Ships are queuing at berths in North Asia and North Europe instead of completing rotations, so effective capacity falls even though the underlying vessel supply has not changed.
- The CFO move is to rebuild freight cost per unit into your contribution margin, re-time purchase orders around a longer effective transit, and use air freight selectively, not to lock in a large frontload order on rate-spike panic.
Ocean freight is back as a live margin variable, and it snuck up on a lot of operators who had filed the last freight spike under "problem solved." Ports across North Asia and North Europe are jammed, and the rates that quietly sit inside your cost of goods are climbing again in weeks, not months.
We track this exact input in our DTC input-cost index, because freight rarely moves in isolation from tariffs, energy and FX, and it flows straight into a number every DTC brand should be watching this quarter: freight cost per unit. Here is the read a CFO should be running before the next purchase order goes out, and it starts with the same mechanics we walked through in our asia-to-US container rate surge piece earlier this year.
What happened
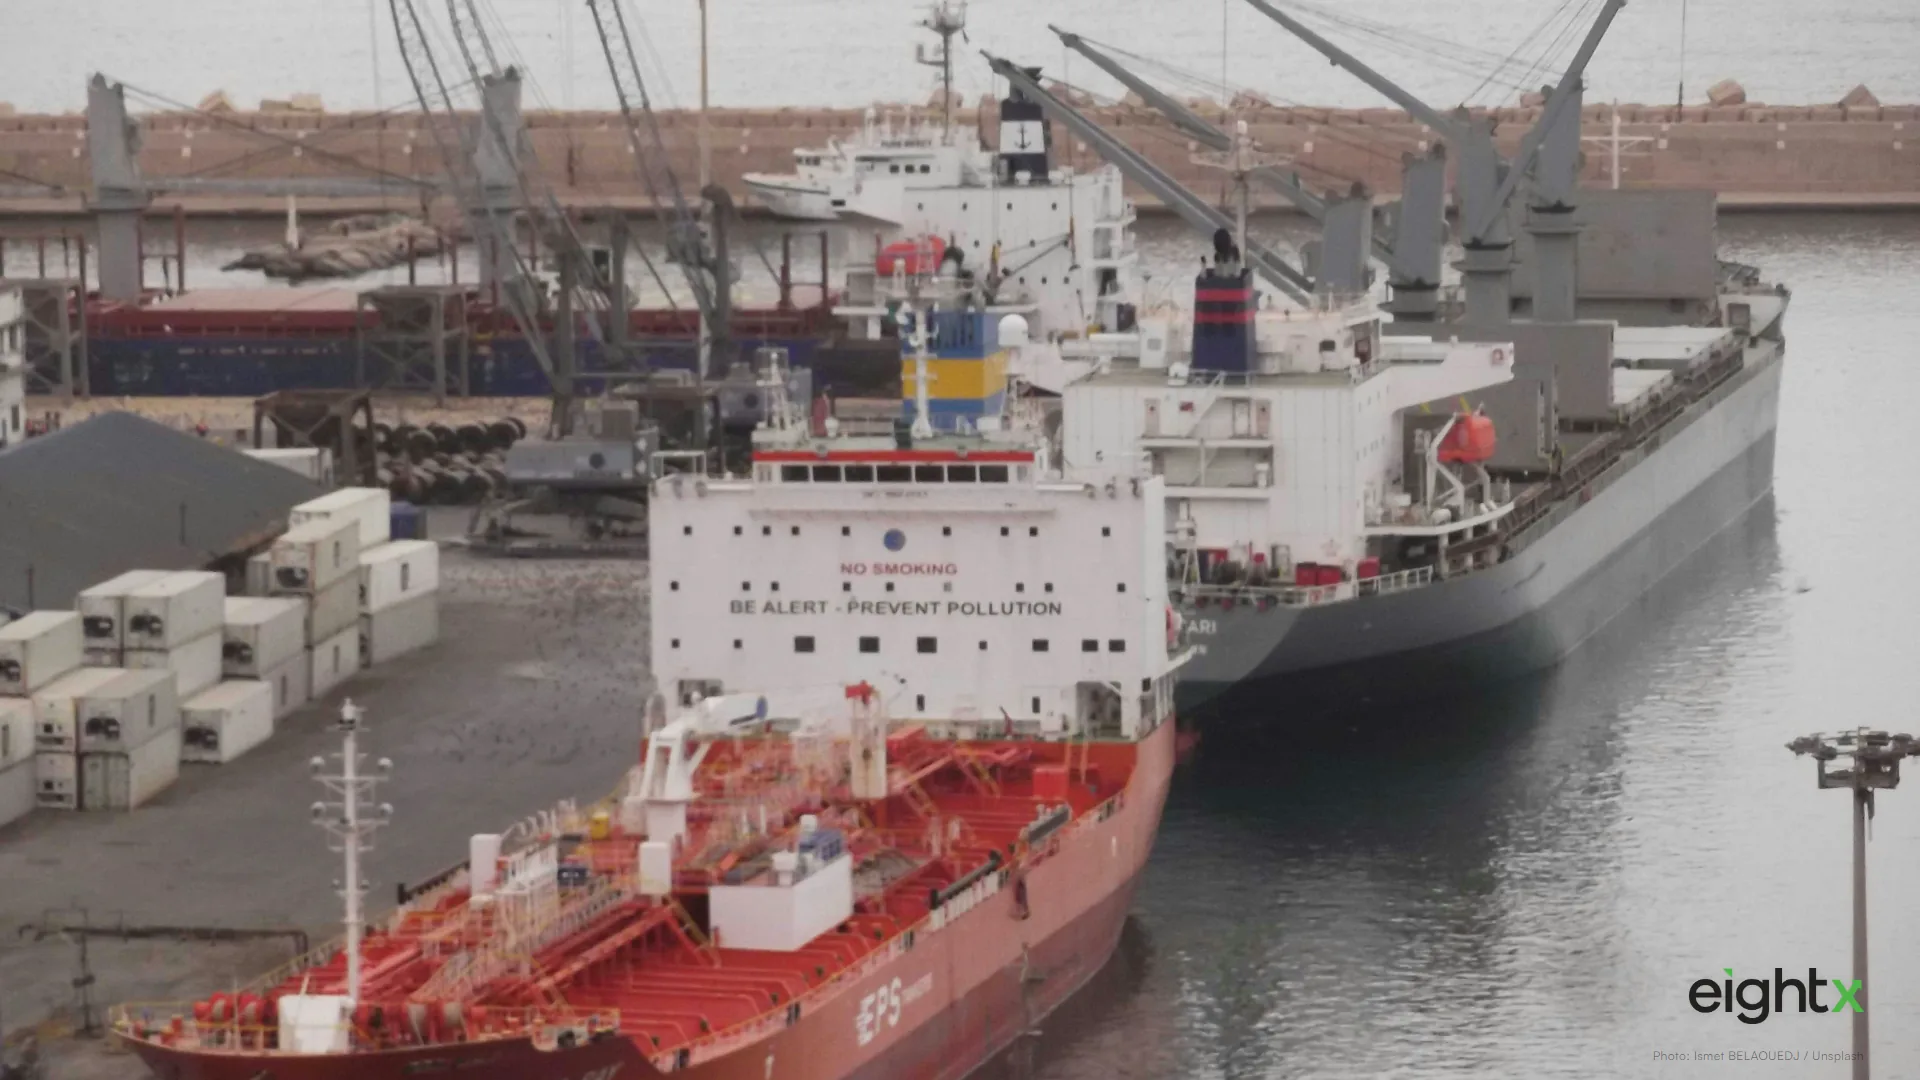
trans.info reported in early July 2026, citing data from Linerlytica, Drewry and Xeneta, that about 11% of the global container fleet, roughly 3.7 million TEU, is stuck waiting for berths. That is the highest level of port congestion in four years.
Drewry's World Container Index rose 9% to $4,530 per 40-foot container. On individual lanes, Shanghai to Genoa jumped 10% to $6,360 per 40-foot box, and Shanghai to Rotterdam rose 7% to $4,682. Xeneta's spot-rate data moved even faster: Far East to North Europe rates rose 65% in a single month to $4,763 per FEU, and Far East to the Mediterranean climbed 40% to $6,044 per FEU.
The worst backlogs sit in North Asia, with Asian hubs including Shanghai, Ningbo, Yantian and Singapore affected, and North European ports, Antwerp, Hamburg and Rotterdam among them, also under strain. Reported causes stack up rather than pointing to one culprit: vessel bunching, overcrowded container yards, limited truck booking slots, equipment and labor constraints, a Northern Europe heatwave, and weakened crane and terminal productivity.
| Early July 2026 ocean freight snapshot | Figure |
|---|---|
| Global fleet stuck at berth | ~11% of TEU capacity (~3.7 million TEU) |
| Drewry World Container Index | $4,530 per 40ft, +9% |
| Shanghai to Genoa | $6,360 per 40ft, +10% |
| Shanghai to Rotterdam | $4,682 per 40ft, +7% |
| Xeneta Far East to North Europe (spot) | $4,763 per FEU, +65% m/m |
| Xeneta Far East to Mediterranean (spot) | $6,044 per FEU, +40% |
| Congestion level | Highest in four years (Linerlytica) |
Source: trans.info, citing Linerlytica, Drewry and Xeneta. Figures are the early-July 2026 readings as reported.
The mechanism matters more than the headline
The detail that should reframe how you respond is why rates are rising. This is not carriers pulling capacity out of the market because demand jumped. It is ships queuing at berths in North Asia and North Europe instead of completing their rotations. Effective capacity falls even though the underlying fleet size has not changed. A ship stuck waiting to unload is a ship that is not available for its next booking, and multiply that across roughly 3.7 million TEU sitting idle and you get a rate spike that looks like a demand story but is really a throughput story.
That distinction changes the right response. If this were a genuine demand surge, locking in more capacity ahead of a sustained shift would make sense. A congestion-driven spike argues for something closer to what we laid out when container rates spiked around tariff frontloading: re-time your orders and hedge selectively, do not assume the pressure compounds indefinitely, because backlogs that built up in a few weeks can also clear in a few weeks once yards and truck booking catch up.
Returns are quietly eating your margin. See by how much.
Get our Real Cost of Returns calculator: plug in your numbers, see the true hit per return.
Check your inbox. We'll send the Real Cost of Returns calculator shortly.
Rebuild freight cost per unit into your landed cost
Here is the part of this event that actually belongs on your P&L. A freight rate jump of this size, Xeneta's Far East to North Europe spot rate alone moved roughly $1,870 higher per FEU in a single month, is not an abstract index number. It is a cost that lands inside a specific container carrying a specific number of your units, and it either compresses your margin or gets passed to the customer.
Do the math per SKU, not company-wide. A container carrying 4,000 units absorbs that same dollar increase very differently than one carrying 8,000 units of a smaller, lighter product. Take your current landed-cost rate for the lane you actually use, whether that is closer to the index figure or the higher spot quote, divide by real units per container, and add that freight-per-unit figure back into your landed cost stack alongside product cost and duty. Our benchmark on average CPG landed cost per unit by vertical is a useful comparison point for where your number should sit before you assume the whole spike has to hit margin, and our DTC cost of goods index tracks how freight sits alongside the rest of your input-cost stack. Then re-run contribution margin at current pricing. If it has moved outside the range you underwrote at launch, you have a real, current decision to make, not a rounding error to shrug off.
Reorder timing and safety stock, not just cost
The freight-cost hit is only half of this event. The other half is timing, and it is the half more brands skip. Congestion adds queuing time at both origin and destination on top of normal sailing time, which means the same purchase order you would have placed a month ago now needs a longer runway and a wider margin for error, not just a bigger check.
Model lead-time variance explicitly. Instead of planning off one average transit number, build your reorder point off a distribution: best case, typical case, and a congestion-adjusted worst case, and size safety stock to cover the gap between typical and worst case for your highest-velocity SKUs. That is a materially different exercise than simply shifting your calendar by a flat number of days, and it is the one that actually protects you from a stockout when a vessel sits an extra week at anchor instead of docking on schedule.
Don't over-react: hedge, don't frontload
The instinct in a rate spike is to panic-order, lock in a large shipment now on the theory that rates only go up from here. Resist it. This looks like a capacity and congestion event, not a durable demand shift, and a large reflexive order ties up cash in inventory ahead of actual need while betting on a spike holding or worsening, which nothing in the reported data confirms.
The better posture is closer to hedging: re-time purchase orders around the current, longer effective transit, re-price selectively where your elasticity allows it to absorb some of the freight-per-unit increase, and keep your order sizes flexible enough to adjust again once congestion data actually turns. For a narrow slice of high-margin or time-critical SKUs where a stockout would cost more than the freight premium, air freight is worth pricing out as a bridge, a tradeoff we cover in full in our air versus sea freight decision framework. It is not, however, a reason to airfreight your whole catalog.
What to watch next
- Whether congestion clears or compounds. Roughly 3.7 million TEU sitting idle is unusual, but backlogs built over a few weeks can also unwind over a few weeks once yards, truck booking and terminal productivity catch up. Watch the next round of Linerlytica and Xeneta readings before assuming this is the new normal.
- Your freight-per-unit number against current pricing. Re-run contribution margin at today's rate, not the rate you underwrote at launch, on your highest-volume SKUs first.
- Your reorder point and safety stock, rebuilt for variance. A longer, less predictable effective transit is the real operating risk here, more than the freight-rate line itself.
- Which SKUs, if any, justify air freight. Keep the list short and margin-tested, and revisit it as ocean transit times normalize.
The operator takeaway
The headline is a rate spike. The number that should land on your desk is what that spike does to freight cost per unit on the SKUs you actually move, and whether your reorder calendar still holds up against a longer, less certain transit window. Neither of those questions gets answered by watching the index number alone.
So rebuild the landed-cost stack now, while the data is fresh: freight per unit by SKU, contribution margin at current pricing, and a reorder point sized to real lead-time variance instead of last quarter's average. Hedge your ordering and pricing where you can, and reserve air freight for the handful of SKUs where a stockout costs more than the premium. Do not lock in a large frontload order on the assumption the spike holds. If you want a second set of eyes on that rebuild, our team does exactly this work.
Frequently Asked Questions
why are ocean freight rates spiking again in 2026?
Rates are spiking because of congestion, not a demand surge. About 11% of the global container fleet, roughly 3.7 million TEU, is stuck waiting for berths, the worst backlog in four years according to Linerlytica. Vessel bunching, overcrowded container yards, limited truck booking slots, equipment and labor constraints, a Northern Europe heatwave, and weak crane and terminal productivity are all compounding at once. Ships are queuing instead of completing their rotations, which pulls effective capacity out of the system even though the number of vessels in the water has not changed. That capacity crunch is what is pushing spot and index rates higher.
how much of the global container fleet is stuck waiting at port right now?
Roughly 11% of the global container fleet, about 3.7 million TEU, is currently idle and waiting for berths, per Linerlytica data reported by trans.info. That is described as the highest level of port congestion in four years. The worst backlogs are concentrated in North Asia, and North European hubs including Antwerp, Hamburg and Rotterdam are also affected, alongside Asian hubs such as Shanghai, Ningbo, Yantian and Singapore. When that much capacity sits idle at anchor rather than moving cargo, carriers effectively have fewer usable ships in rotation, which is the direct driver of the current rate spike.
how do i calculate freight cost per unit for my landed cost?
Take the all-in ocean freight rate for the lane you use, such as Drewry's $4,530 per 40-foot container or a Xeneta spot quote like $4,763 per FEU, and divide it by the number of sellable units that container actually carries for your SKU mix. A container holding 4,000 units spreads a rate very differently than one holding 8,000 units of a smaller, lighter product. Add that freight-per-unit figure into your landed cost stack alongside product cost, duty and last-mile, and re-run it against your current price to see the real hit to contribution margin, not just the percentage move in the headline rate.
should i place a bigger order now before rates go higher?
Not as a default response. This event looks like a capacity and congestion problem, ships queuing at berths rather than a genuine surge in demand for space, so treating it as a reason to dump cash into one giant frontload order is the wrong read. A large reflexive order ties up cash in inventory ahead of need and assumes the spike holds or worsens, which is not established. The better move is to re-time purchase orders around the current, longer effective transit and re-price where your elasticity allows, keeping the option to adjust order size again once the congestion data actually turns.
how much earlier should i reorder if transit times are longer?
There is no single universal number, because it depends on your specific lane and current backlog, but the discipline is to model lead-time variance, not just the cost move. Congestion adds queuing time at both origin and destination on top of normal transit, and that queuing time is the part most reorder calendars ignore. Rebuild your reorder point using a wider distribution of possible transit days rather than one average, and hold safety stock sized to that variance. The goal is to protect against stockouts from a longer, less predictable transit window, not simply to shift your calendar by a fixed number of days.
when does it make sense to airfreight instead of ocean freight?
Airfreight earns its much higher per-unit cost when the SKU is high-margin enough to absorb it, or when the cost of being out of stock, a lost promotion window, a stranded launch, a key retail commitment, is larger than the freight premium. In a congestion spike, ocean transit becomes both slower and less predictable, which raises the odds of a stockout on time-sensitive inventory. Run the math SKU by SKU: compare the margin dollars protected by keeping a specific product in stock against the incremental air cost per unit. Reserve air for a narrow, urgent slice of SKUs, not as a blanket response to the whole freight spike.
is this port congestion a sign of a bigger demand surge?
Not based on what has been reported. The rate spike is being driven by vessels queuing at berths in North Asia and North Europe, alongside yard overcrowding, limited truck booking, equipment and labor constraints, a Northern Europe heatwave, and terminal productivity issues, a supply-side and operational story rather than evidence of a sudden jump in shipper demand. That distinction matters for how you respond. A genuine demand surge would justify locking in more capacity ahead of a sustained shift. A congestion-driven spike argues for re-timing and hedging instead, since the pressure can ease once backlogs clear rather than compounding indefinitely.