
Insights
Real cost of returns calculator: what each refund actually costs your ecom brand in 2026
A $60 return is not a $60 cost. You lose the original shipping, the return label, restocking labor, and often the product itself if it cannot be resold. Enter your AOV, return rate, and margin to see your true per-return cost and what a one-point reduction in return rate is worth annually.
Key Takeaways
- A returned $100 apparel order costs you $30 to $40 fully loaded, with $30 the industry-standard figure (Optoro). Return shipping, 3PL handling, QC labor, markdown on resale, the non-refundable payment fee, and an allocated abuse drag stack on top of the lost gross margin.
- Online return rate is 19.3% overall in 2025 per NRF ($890B in total returns, $247B online), up from the older 16 to 17% range. Apparel runs 25 to 30%, footwear 30 to 40%, electronics 10 to 30%.
- 65.2% of merchants now charge a return fee, average $9.04 (Loop Returns 2026). The free-returns era is ending, but switching policies has a conversion cost too. Model both sides before you pull the lever.
- Every cost input that feeds your per-return number is structurally higher than 2019. BLS PPI for parcel couriers is up 67.6%, warehousing 53.5%, freight trucking 44.6%. Warehouse wages are up 33.9% since January 2019. This is not going back.
- A 3-point return-rate reduction on a $20M apparel brand is a 6-figure cash event, not a vanity metric. Use the calculator below to size yours, then pick the play with the right ROI for your category.
A 25% return rate doesn't tell you what returns are actually costing you. The headline number hides the stack of inputs that fire every time a customer hits the "start a return" button: return shipping, 3PL handling, QC labor, markdown on resale, the non-refundable payment fee, and an abuse drag that's been creeping up for three years. On a $100 apparel order, that stack totals $30 to $40 fully loaded. Optoro pegs the industry-standard figure at $30 per $100 returned, which lines up with the model below.
The decision this post forces is simple. Stop comparing yourself to "the average ecommerce return rate" and run your own numbers through a cost stack that pulls every component apart. If you operate a $5M to $50M apparel brand, a 3-point reduction in return rate is a six-figure cash event, not a vanity metric. The calculator below sizes it for your business. The data underneath shows why every input is structurally higher than it was five years ago.
The $100 order that costs you $35 to take back
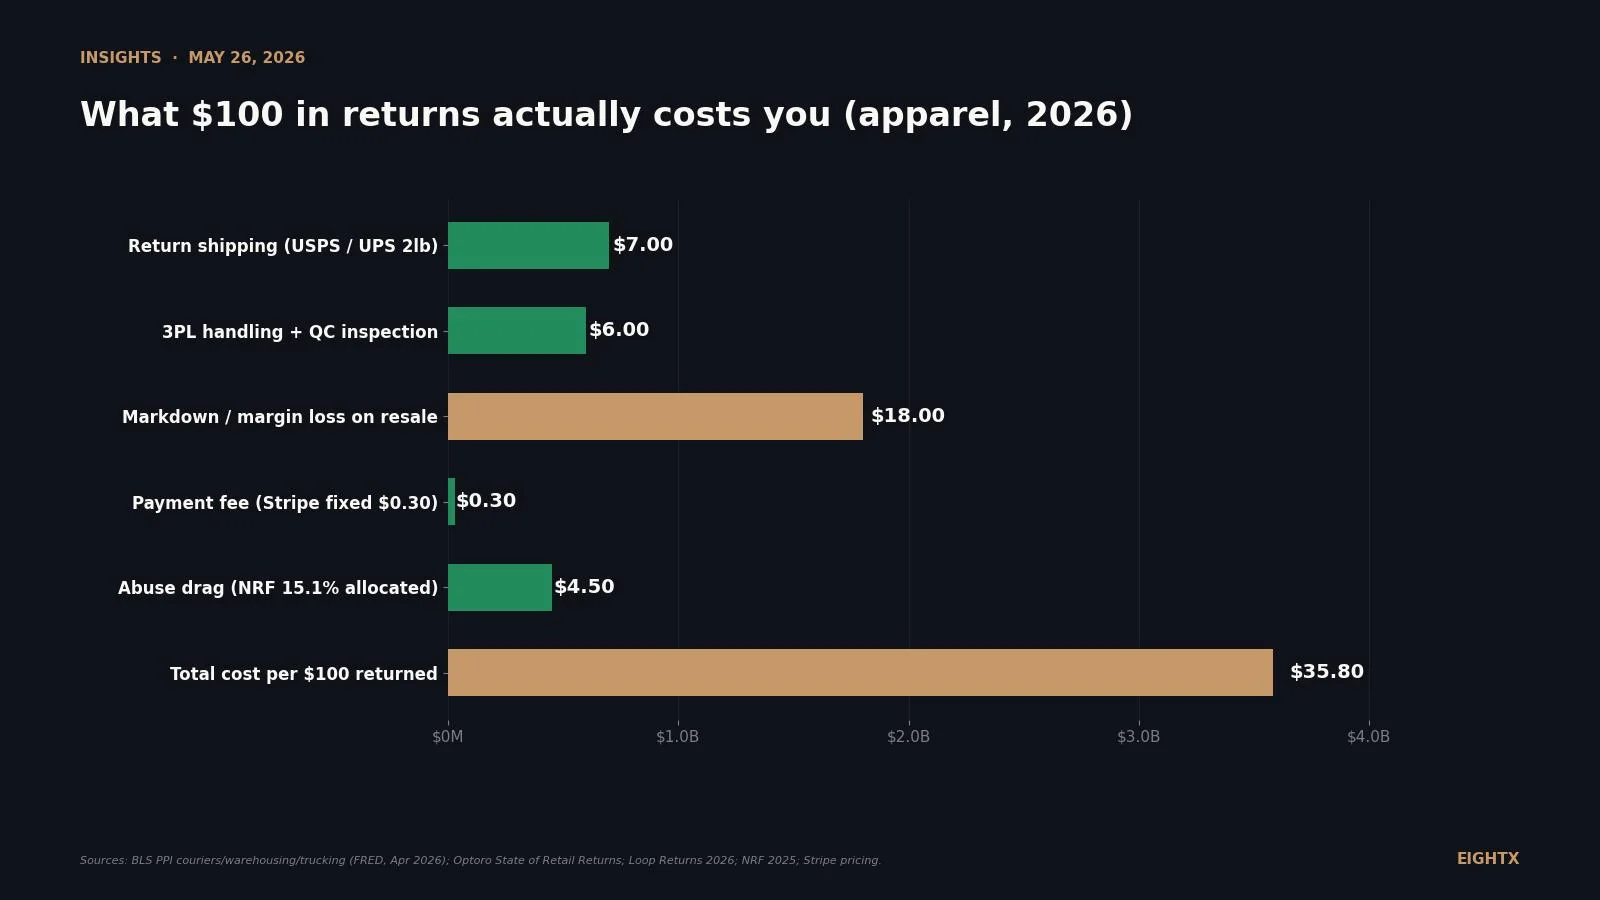
The chart shows the full stack across six categories. Apparel and footwear both come in at $35.80 on a $100 returned order. Electronics lands at $35.30 and home goods at $33.30, both dragged up by heavier return shipping. Jewelry and beauty sit lower at $24.80 and $22.80 because markdown loss on resale is smaller (smaller items, less seasonal risk, less worn-and-returned).
If you are operating in any of the top four categories, the right starting assumption is that every return costs you a third of the order value before you've recovered a dollar through resale. That is the working number to bring to your next leadership meeting.
The real cost-of-returns stack: six lines you have to count
Return shipping ($6 to $12). USPS Ground Advantage on a 2-lb residential parcel runs $5 to $8. UPS and FedEx Ground are 50 to 100% higher. Heavier categories like home goods and electronics push the upper end of the range. BLS PPI for parcel couriers and express delivery (FRED series PCU49214921) hit 399.965 in April 2026, up 12.26% year-over-year and 67.6% since January 2019. The trend is up and the trend is not breaking.
3PL handling and QC ($3 to $8). Your 3PL charges a base fee per return ($3 to $6 is the published-rates range from The Fulfillment Advisor and gobolt benchmarks) plus 15 to 40% overhead for inspection, repackaging, and putaway. PPI for warehousing and storage (BLS PCU493) sits at 167.914 in April 2026, up 53.5% since January 2019. Warehouse wages (BLS CES4348400003) hit $33.25 per hour in March 2026, up 33.9% from the pre-pandemic baseline. Your 3PL is passing that wage inflation through to you.
Markdown on resale ($8 to $20+). This is the single biggest line in the stack and the one operators forget. A returned apparel SKU is rarely resold at full price. It goes to a markdown bucket, an outlet channel, or B-stock at 20 to 40% off, net of recovery costs. The dollar figure in the model represents lost gross margin on the original sale, not lost revenue. One apparel founder we spoke with described his 3PL warehouse as "sitting on opened boxes" of returned product, getting charged storage on inventory that wasn't going to move at the original price.
Payment fee ($0.30). Stripe and Shopify Payments keep the fixed $0.30 portion of the transaction fee on every refund. The percentage portion (2.9% typical) is usually returned. PayPal's fixed portion is $0.30 to $0.49 and similarly non-refundable. On 10,000 orders at 25% return rate, that fixed fee alone leaks roughly $750 to $1,225 a year. Small line, but it is real cash going to the processor.
Abuse drag ($3 to $5). This is the controversial one. Loop Returns flags 12% of return attempts as high-risk with an average fraudulent-return value of $120. Happy Returns and NRF 2025 found 32% of shoppers returned items they had worn and 47% returned items with tags removed. NRF and Appriss estimate $86B in annual returns-abuse losses across US retail, roughly 6x the criminal-fraud figure. The model spreads that drag across all returns ($3 to $5 per return depending on category), which is an allocation, not a per-return charge. If your QC catches abuse you save on this line; if it doesn't, you pay it in markdown.
Return fee revenue offset (negative, if applicable). 65.2% of merchants now charge a return fee, average $9.04 per return (Loop Returns 2026). If you charge, deduct that from the gross cost stack. If you do not, the line is zero and you absorb the full $30 to $40.
Category Return shipping ($) 3PL handling + QC ($) Markdown / margin loss ($) Payment fee ($) Abuse drag ($) Total ($) % of order Apparel 7.00 6.00 18.00 0.30 4.50 35.80 35.8% Footwear 8.50 6.50 16.00 0.30 4.50 35.80 35.8% Electronics 11.00 7.50 12.00 0.30 4.50 35.30 35.3% Home goods 12.00 8.00 10.00 0.30 3.00 33.30 33.3% Jewelry 6.00 5.50 9.00 0.30 4.00 24.80 24.8% Beauty / cosmetics 6.50 5.00 8.00 0.30 3.00 22.80 22.8%
Why your return cost is structurally higher than 2019
Three of the five cost components in the stack tie directly to BLS Producer Price Index series, and all three are up by double digits since 2019. Parcel couriers are up 67.6%, warehousing 53.5%, freight trucking 44.6%. Warehouse wages have climbed 33.9% over the same window. These are not blips; they are step-changes that started during the 2020 to 2022 demand surge, stuck after demand normalized, and have continued to drift higher.
What this means for your business: every renewal cycle (3PL contract, carrier contract, last-mile partner) is now negotiating against a higher cost basis than the last one. If you signed a 3PL deal in 2022, you are likely renewing into a 20 to 30% higher per-return charge in 2026. That is the operator reality, and it is why the cost stack above does not have a "back to normal" scenario.
The calculator
Use this to size returns on your own brand. Inputs default to a $5M apparel brand at industry-typical numbers. Drag the sliders to your reality.
A $100 returned order costs $30 to $40 once you count every line. The math doesn't care whether you call it "shrinkage" or "returns." A 3-point reduction on a $20M apparel brand is six figures of recoverable margin sitting on the table. Run your number and decide what it's worth chasing.
Return rate by category: where do you actually sit?
The chart shows the consensus return-rate band per category as of 2026. Two reads matter for an operator. First, you should benchmark against your own category, not the 19.3% overall ecommerce average. A 25% return rate in apparel is normal; a 25% rate in beauty is a problem. Second, the spread inside each category is wide because sub-category and brand decisions move the number. Bracketing-heavy fast fashion runs higher; basics and premium with tight fit guidance run lower.
For the deeper category-by-category data breakdown with sub-segment math, see our companion post on average ecommerce return rates in 2026. That page is the data-heavy reference; this one is the calculator-driven version.
Returnless refund as a CFO tool, not a fraud move
A short aside that catches operators off guard. Returnless refund (refunding the customer and telling them to keep the item) is now mainstream. Amazon offers it at scale on FBA SKUs, Walmart and Target deploy it on low-value items, Shopify actively promotes it through its returns ecosystem. It is not a fraud-enablement move. It is a CFO tool: when your processing cost per return ($30+) exceeds the recoverable value of the item ($20 or $25 at B-stock), refunding without the return is the lower-cost path. Use it on items under roughly $25 to $40 depending on category. The returns-fraud detection sub-market sits at roughly $430M in 2026 and is projected to reach $1.5B by 2036, which tells you the platform layer is already accommodating this play.
Three plays to reduce returns by 15 to 30%
Play 1: Fit and product-page friction (apparel, footwear, beauty). Sizing widgets, post-purchase sizing nudges, real-room photography, shade-match quizzes, and richer product-page video. These tackle the largest category of "good faith" returns (wrong size, wrong color, wrong fit). Expected reduction: 15 to 20% on fit-driven returns; 5 to 10% overall.
Play 2: Returnless refund on low-AOV SKUs. Set a category-specific dollar threshold (apparel $25, beauty $20, jewelry $40) and refund without requesting the return below that line. Cuts processing cost without raising the gross return rate. Expected savings: $5 to $15 per return on items below the threshold, recovered immediately.
Play 3: Tighter QC and abuse detection on the inbound side. Photo-receipt requirement, signature delivery on jewelry and electronics, refusal of returns with missing tags, and selective use of returns-fraud detection (Loop, Riskified, NoFraud). Expected reduction: 30 to 50% on the high-risk return bucket (which is roughly 12% of attempts per Loop), translating to a 3 to 5 point drop in the abuse-drag line of your cost stack.
A swimwear founder we spoke with switched to paid returns to attack the bracketing problem head-on. Return rate dropped, but conversion on women's products dropped too, and they had to reconsider the policy. The lesson: every play has a conversion cost. Model it before pulling the lever. Bracketing behavior is real, especially for a buyer who has been trained for a decade to "buy three, return two."
How to think about returns on the Amazon channel
If you sell on Amazon FBA, the accounting treatment changes the cash picture. When FBA processes a return and the unit comes back to your inventory, the right journal entry is to reverse the sale and put the cost of goods back at the original cost (net-zero on the GL, but not net-zero in cash, because the inventory may now be harder to sell). When the unit comes back unsellable, it goes to a removal order or a write-down. The cost stack above is most representative of DTC; on Amazon, your effective cost per return is lower because FBA handles physical processing for you, but your visibility into abuse and markdown is also lower. Operator estimate, not 10-K data: figure $15 to $25 per FBA return after fees, plus the markdown if the unit can't go back to sellable.
What to do this week
Three things, in order:
- Pull your last 90 days of returns (orders, refunded amount, reason codes).
- Run your numbers through the calculator above. Save the share-my-results link.
- If your return-cost exposure lands at 15%+ of gross margin, book a CFO call. We will pressure-test the model against your actual P&L (3PL invoices, processor fee statements, recovery-channel revenue) and rank the three plays by ROI for your specific category and AOV.
Sources and methodology
Cost component data. Return shipping pulled from USPS Ground Advantage, UPS Ground, and FedEx Ground 2026 rate cards for 2-lb residential parcels, with category-specific weight adjustments for home goods and electronics. 3PL handling from published 2026 benchmark fee tables ($3 to $6 base plus 15 to 40% overhead) including The Fulfillment Advisor and gobolt. Payment-processor fees from Stripe and Shopify Payments standard pricing (2.9% + $0.30, fixed portion non-refundable).
Per-return cost anchor. Optoro's State of Retail Returns puts the industry-standard cost at roughly $30 per $100 of merchandise returned. The Eightx model lands at $20 to $40 across categories, with $35.80 the apparel central figure. Loop Returns 2026 confirms 65.2% of merchants now charge return fees with an average fee of $9.04 and 12% of return attempts flagged high-risk at an average $120 per fraudulent return. Happy Returns and NRF 2025 supply the abuse-drag inputs (32% worn, 47% tags removed).
BLS Producer Price Index series. Couriers and Express Delivery (PCU49214921) pulled via FRED, latest April 2026 reading 399.965. Warehousing and Storage (PCU493) and General Freight Trucking (PCU484) pulled via BLS. All series rebased to January 2019 = 100 for the trend chart. April 2026 figures are flagged preliminary by BLS; values may revise up to four months after publication. Warehouse hourly wages from BLS CES4348400003 (NAICS 493, seasonally adjusted), latest March 2026 reading $33.25 per hour.
Return-rate anchor. NRF's 2025 press release puts total US returns at roughly $890B annually (19.3% of $4.6T total retail) with $247B in projected online return losses for 2026, implying a 19.3% return rate on online sales. The press release URL slug retains an earlier "$850B" projection from the same release cycle; the headline figure was revised upward to $890B in the published release contents. The older 16 to 17.6% NRF / Appriss benchmark cycle is now superseded by the 19.3% release. Category-specific ranges synthesize Loop Returns 2026, Optoro, Happy Returns / NRF 2025, and Amazon marketplace analyses. Bands are intentionally wide because underlying methodology varies by vendor.
Limitations. NRF category-specific return rates are not published at the granularity used here; ranges come from a vendor synthesis. The "abuse drag" line in the cost table is an allocation across all returns, not a literal per-return charge, and is sensitive to the underlying NRF / Appriss fraud-rate assumption. USPS Ground Advantage is the baseline for the return-shipping figure; brands using UPS or FedEx will see costs 50 to 100% higher. Amazon FBA economics differ from the DTC stack and are addressed in the dedicated section above.
Update cadence. This calculator and post will be refreshed quarterly as BLS PPI releases land (Feb, May, Aug, Nov) and after each major NRF or Loop Returns benchmark update.
Frequently asked questions
what does a single ecommerce return actually cost me in 2026?
On a $100 apparel order, $30 to $40 fully loaded. That includes return shipping ($6 to $12 depending on carrier and weight), 3PL handling and inspection ($3 to $8), markdown loss on resale ($8 to $20), the non-refundable Stripe or Shopify Payments fixed fee ($0.30), and an allocated abuse drag of $3 to $5 spread across all returns. Optoro's industry benchmark lands at $30 per $100 returned, which is inside that model range.
what's the average return rate for online apparel in 2026?
Apparel online runs 25 to 30% as a consensus band, with sub-categories like footwear at 30 to 40% and luxury or formalwear pushing 40 to 50%. The NRF 2025 release pegs overall ecommerce returns at 19.3% of online sales. If you are at 20% in apparel you are doing better than peers; if you are at 18% in electronics you have a product-page or QC problem.
do payment processors refund the full fee when i issue a refund?
No. Stripe and Shopify Payments keep the fixed $0.30 portion of the transaction fee on every refund. The percentage portion (2.9% typical) is usually returned, but the fixed fee is not. On a 25% return rate at $60 AOV, that fixed fee alone leaks roughly $1,500 per 10,000 orders. PayPal's policy is similar with a $0.30 to $0.49 fixed-fee retention.
what is a returnless refund and when should i use one?
A returnless refund refunds the customer but tells them to keep the item. It is now mainstream. Amazon, Walmart, and Target use it at scale on low-value SKUs where the cost to process the return exceeds the recoverable value. The math is simple: if your per-return cost is $30 and the item retails at $25, you save money issuing the refund and writing the SKU off. Use it on items under roughly $25 to $40 depending on category.
should i offer free return shipping or charge for it?
It's a conversion-versus-margin trade, not a free P&L win. Loop Returns 2026 shows 65.2% of merchants now charge return fees, average $9.04, and brands that switched typically see a 10 to 20% drop in return rate. But conversion can drop too, especially on women's apparel where bracketing (buying multiple sizes to try) is the norm. Model both sides before pulling the lever. We have seen swimwear brands switch to paid returns, lose a meaningful share of their women's customer base, then have to switch back.
how much of my gross margin am i losing to returns?
Most apparel and footwear brands at a 25 to 30% return rate are losing 18 to 30% of gross margin to returns once you account for the full cost stack. At 18% return rate the number drops to 10 to 15%. The calculator above prints your exact figure. Anything north of 15% of gross margin lost to returns is a single-biggest-lever conversation.
how do major retailers actually use returnless refunds at scale or is this still niche?
Mainstream as of 2025. Amazon offers returnless refunds on a wide range of FBA SKUs. Walmart and Target use it on low-value items. Shopify is actively promoting it through its returns ecosystem. The returns-fraud detection sub-market sits at roughly $430M in 2026 with projections to $1.5B by 2036. If you are not running returnless on items under $25 to $40, you are paying the processing cost twice.
what's the difference between returns fraud and returns abuse, and which is bigger?
Fraud is the criminal end: empty boxes, fake receipts, organized retail crime rings. Industry data flags 15.1% of online returns as fraud and 12% as high-risk. Abuse is the gray zone: customers wearing items and returning them (32% per Happy Returns and NRF 2025), removing tags but expecting refunds (47%), bracketing, or wardrobing for one event. Abuse is the bigger dollar figure. Appriss Retail puts total returns-abuse losses at roughly $86B annually, about 6x criminal fraud losses.