
eCommerce
UK Ecommerce Return Rate Benchmark 2026
UK non-food online returns are forecast near 19.5% in 2025, down from ~21% in 2024, with clothing the worst category at about 23.6%. Each returned parcel costs a British DTC brand roughly £10 to £25 in reverse logistics before the refunded item value, so returns are a real P&L line, not a vanity stat.
Key Takeaways
- UK non-food online returns are forecast near 19.5% in 2025, down from ~21% in 2024. Roughly one in five online orders comes straight back, so the returns drag is structural, not seasonal.
- Clothing is the worst category at ~23.6%. Footwear runs a similar 17-30% band. Fit and sizing uncertainty plus order 'bracketing' make apparel the line that breaks your margin.
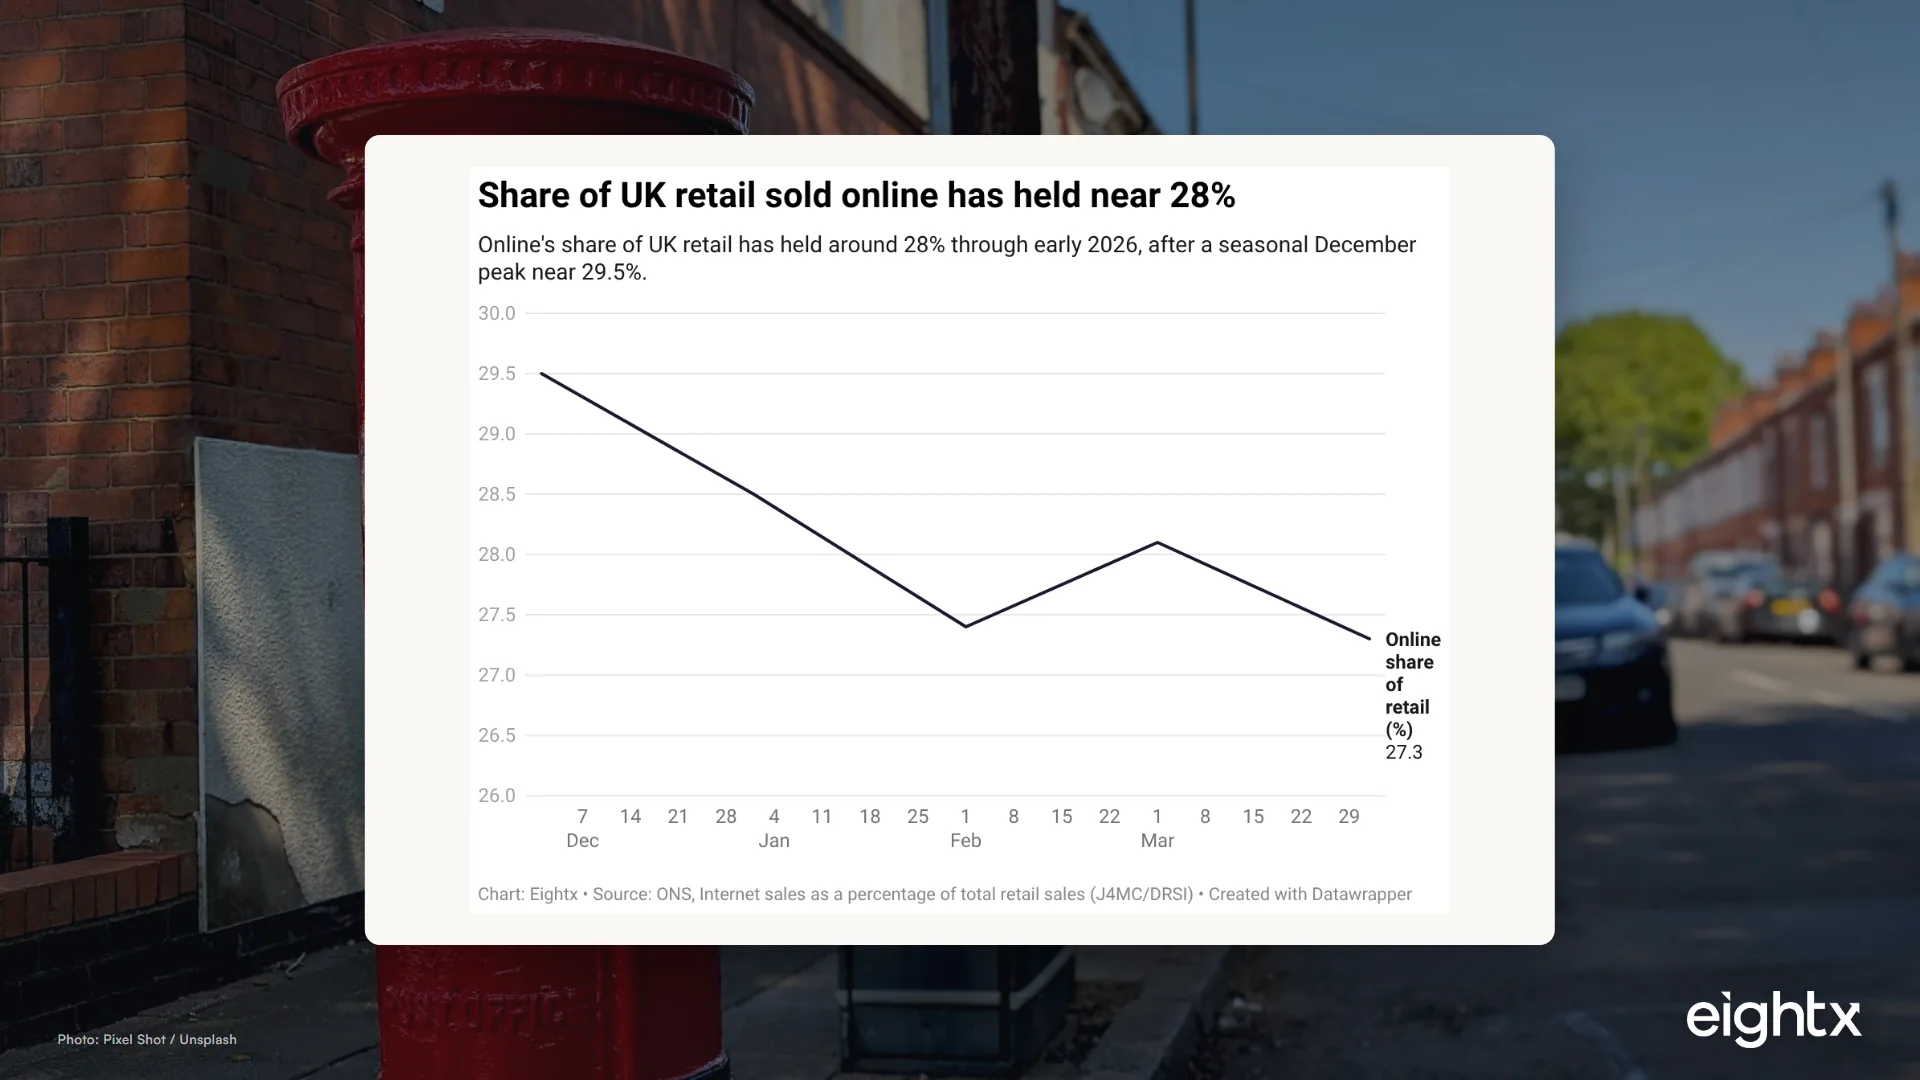
- Online is a durable ~28% of all UK retail (ONS internet-sales ratio). December peaks near 29.5%, so the returns leak applies to a large, permanent slice of demand.
- A return costs ~£10-£25 in reverse logistics before the refunded item value, once shipping, handling, restock, markdown, customer-service time and non-refunded payment fees (2-3% of order value) are counted.
- Stop treating return rate as a vanity stat and book it as a P&L line. Measure your true cost per return, benchmark it against your category, then decide deliberately: keep free, gate behind a threshold, or charge.
If you run a British DTC (direct-to-consumer) brand, your return rate is not an ops footnote. It is one of the largest, most under-booked costs on your P&L. UK non-food online returns are forecast near 19.5% in 2025, clothing runs around 23.6%, and every returned parcel costs you £10 to £25 in reverse logistics before you even refund the item. This benchmark sets the UK numbers straight, using national statistics rather than US figures noun-swapped, and shows you how to turn return rate from a vanity stat into a P&L line you actually manage.
What the UK online return rate actually is in 2026
Start with the headline: UK non-food online returns are forecast at roughly 19.5% for 2025, down from about 21% in 2024. That means close to one in five online orders comes straight back. The decline is real but small, driven by tighter returns policies and brands cracking down on serial bracketing, and 19.5% is still high enough to be a recurring tax on contribution margin.
That return rate matters because online is a large, permanent share of UK retail. The ONS internet-sales ratio (the share of total retail sold online) has held near 28% through early 2026: 29.5% in December 2025, 28.5% in January, 27.4% in February, 28.1% in March, and 27.3% in April. December peaks for the obvious seasonal reason, but the trend line is a durable ~28%. So the returns drag is not applied to a shrinking niche. It is applied to roughly a quarter to a third of all UK retail demand, every month.
When I talk to founders running a UK brand in the £2M to £20M range, the thing they keep getting wrong is treating 19.5% as their number. It is the blended online average. If your catalogue skews apparel, your real benchmark is closer to 23%, and pretending otherwise hides a chunk of cost. The first job is knowing which line you actually sit on.
Return rate by category: why clothing breaks your margin
Returns are not evenly distributed. Clothing is the worst major category in the UK at about 23.6%, with footwear close behind in a 17-30% band. Home and furniture sits around 19%, beauty around 12%, and electronics around 11%. The spread tells the whole story: categories where the customer cannot be sure the product fits or suits them before it arrives generate far more returns than standardised-spec categories where a spec sheet removes the uncertainty.
The mechanics behind apparel and footwear are specific. Fit and sizing uncertainty means customers hedge, and the most expensive version of that hedge is "bracketing": ordering the same item in two or three sizes intending to keep one and send the rest back. Every bracketed order books one sale and two or more returns. That is why a fashion brand can run a 23% return rate while a beauty brand on the same Shopify theme runs 12%.
| Category | Return rate | Basis |
|---|---|---|
| Clothing / apparel | 23.6% | UK-specific (ZigZag) |
| Footwear | 17-30% (~23%) | Online benchmark |
| Home & furniture | 15-23% (~19%) | Online benchmark |
| Beauty / personal care | 4-12% (~12%) | Online benchmark |
| Electronics | 8-15% (~11%) | Online benchmark |
| All non-food online | ~19.5% (2025) | UK forecast |
What a return really costs a British brand
Here is where most brands under-book the damage. The refund is the visible cost. The hidden cost is everything that happens to get one returned parcel back onto the shelf, and it runs £10 to £25 per return before you count the item value at all. On fashion and footwear, once you add the lost margin, the total can reach 20-40% of the item price.
Break it down on a returned £50 apparel order. Return shipping or collection is around £5. Warehouse handling and restock is another £4. The payment fee on the original sale, typically 2-3% of order value, is usually not refunded back to you when you refund the customer, so that £1.25 is simply gone. Then there is markdown or value loss, because a returned garment often cannot go back at full price, call it £5. Add £1.50 of customer-service time. That is roughly £16.75 of cost on a single £50 order that produced zero revenue.
CPI is grinding those component costs up. The ONS CPI All-Items index rose from 131.5 in January 2024 to 142.1 in April 2026, about 8% over the period, which lifts courier rates, warehouse labour and packaging, the exact inputs that sit inside every return. When we've watched brands try to absorb this quietly, the pattern is the same: the returns line creeps from a rounding error to a visible margin gap over four or five quarters, and nobody can point to the decision that let it happen, because nobody ever booked it as a line.
From vanity stat to P&L line: measuring your true cost per return
The operator move is simple to describe and rare to actually do: stop reporting return rate as a percentage on a dashboard and start booking returns as a dedicated cost centre on the P&L. A percentage tells you nothing about money. A cost centre forces a number.
Calculate it from the components you already pay. Cost per return equals return shipping, plus handling and restock, plus the non-refunded payment fee (2.5% of order value is a reasonable default), plus markdown or value loss, plus customer-service time. Multiply by your monthly returns volume (orders times return rate) to get your monthly returns cost in pounds. Divide that by revenue to get returns cost as a percentage of the top line. That last number is the one to put in front of the whole team, because it is the one that moves valuation.
Worked example: a brand doing 8,000 orders a month at a £50 AOV with a 22% return rate is processing 1,760 returns. At ~£16.75 cost per return that is about £29,500 a month, or £354,000 a year, which on £4.8M of annual revenue is roughly 7.4% of the top line. That is not an ops number. That is the difference between a healthy brand and a break-even one. When I talk to founders this size, the moment that figure lands as one line in pounds rather than a percentage on a slide is usually the moment returns policy stops being a customer-experience debate and becomes a finance decision.
| Indicator | Value | Period | ONS series |
|---|---|---|---|
| Retail Sales Index (vol, SA) | 103.8 | Jan 2026 | Retail Sales Index |
| CPI All-Items index | 142.1 | Apr 2026 | D7BT |
| Average weekly earnings (total pay) | £749 | Mar 2026 | KAB9 |
| Online share of retail | 28.1% | Mar 2026 | J4MC/DRSI |
Free, gated, or paid? Deciding your UK returns policy
Once returns are a real number, you have three levers, and the right one depends on category and contribution margin, not on what feels generous.
Keep returns free when your category return rate is low (beauty, electronics) and free returns are a genuine conversion driver you can afford. Gate returns behind an order-value or behaviour threshold when you want to protect margin without nuking conversion: free over a basket size, or free for first returns but charged for repeat bracketers. Charge a flat return fee when you sell a high-return category (apparel, footwear) and the data shows the conversion you buy with free returns no longer covers the cost of the returns it generates.
The trade-off is real and you should size it, not guess it. Charging for returns can reduce return rates and recover margin, but it can also reduce conversion and repeat purchase, so the question is always net contribution, not return rate alone. The pattern we see again and again is that brands flip to a gated or paid model far too late, long after the returns line has quietly eaten a full point or two of margin, because they were optimising for a return-rate percentage instead of pounds of contribution. Run the comparison on your own numbers before you change anything, then change one lever and measure.
If you want the deeper mechanics of how returns flow into unit economics, see our returns benchmark hub. Australia and Canada return-rate benchmarks are siblings to this UK cut and are in the pipeline, so check back for the cross-geo comparison.
Who this benchmark is for, and what to do this quarter
The typical operator reading this is a Shopify DTC brand: Storeleads tracks 433,845 UK ecommerce stores, of which 252,110 (around 58%) run on Shopify. If that is you, a 20%-plus return rate is not a side issue, it is a defining margin variable, and the UK demand backdrop (Retail Sales Index up to 103.8 by January 2026) means this is a growth tax rather than a recession symptom. The money is leaking while the market grows.
Three moves this quarter. First, calculate your true cost per return using the component method above and express it as a percentage of revenue, not a return rate. Second, benchmark that against your category, ~23% for apparel, ~12% for beauty, ~11% for electronics, not against the blended 19.5%. Third, pick one policy lever (free, gated, or paid) and model the net-contribution impact before you touch the customer experience. Do those three and returns stop being a number you report and start being a number you manage.
A 19.5% return rate is not an ops stat, it is a recurring tax on contribution margin. The brands that win do not chase a lower percentage. They book returns as a P&L line in pounds, benchmark it against their category, and pick free, gated, or paid on purpose. The percentage is vanity. The pounds are the decision.
Sources and methodology
UK retail and macro figures come from the Office for National Statistics, pulled via the ONS data service on 2026-06-11. The Retail Sales Index (all retailing including fuel, chained volume measure, seasonally adjusted, Great Britain) rose from 100.6 in January 2024 to 103.8 in January 2026, providing the demand backdrop. CPI is series D7BT, the All-Items index (2015=100), release MM23, which rose from 131.5 in January 2024 to 142.1 in April 2026, about 8%, providing the cost-pressure context. Average weekly earnings come from series KAB9 (whole-economy total pay, seasonally adjusted).
The online-share figures use the ONS internet-sales ratio, series J4MC/DRSI ("internet sales as a percentage of total retail sales"): 29.5% in December 2025, 28.5% in January 2026, 27.4% in February, 28.1% in March, and 27.3% in April. We headline the round number, ~28%, and cite the ONS series directly. One discrepancy to note: a secondary source reported March 2026 at 28.7% versus the J4MC series value of 28.1%, so we use the ONS series value and treat ~28% as the durable figure rather than over-precising it.
Return-rate figures come from triangulated industry reporting. The UK non-food online rate (19.5% for 2025, ~21% for 2024) and the UK clothing figure (23.6%) are UK-specific. Category benchmarks for footwear (17-30%), home and furniture (15-23%), beauty (4-12%) and electronics (8-15%) are best-available online central estimates drawn from RichPanel, Ingrid and Eightx category benchmarks; the inline table flags which figures are UK-specific versus online benchmarks via the "Basis" column.
Reverse-logistics cost components (£10-£25 per return, rising to 20-40% of item price on fashion once markdown is counted) are sourced from nShift, Landmark Global, Savills and ReBound, plus the non-refunded payment fee of 2-3% of order value. The £50-order cost stack is an illustrative worked example using mid-band assumptions, labelled as such on the chart, not a measured average.
The store-base figures (433,845 UK ecommerce stores, 252,110 on Shopify) come from a Storeleads GB cut on 2026-06-11. Limitation: the category and revenue facets returned empty for the GB cut this run, so the Storeleads angle is store-count framing only, used to describe who this benchmark is for rather than to rank categories.
Limitations overall: return-rate data is triangulated industry reporting rather than a single official series, so treat the category figures as benchmarks, not precise national statistics. The cost-per-return model is a component build, not a measured average, and your own numbers will vary by carrier, 3PL contract and markdown discipline. The point of the benchmark is direction and method, calculate your own true cost per return and benchmark it against your category, not to assert a single universal figure.
Frequently asked questions
what percentage of online purchases are returned in the uk?
Around 19.5% of UK non-food online orders are forecast to come back in 2025, easing from roughly 21% in 2024. So about one in five online orders is returned, and the rate is higher in apparel-heavy catalogues.
what percentage of online clothing orders are returned in the uk?
Roughly 23.6% for UK clothing, the worst major category. Footwear sits in a similar 17-30% band. Fit and sizing uncertainty plus 'bracketing' (ordering several sizes to keep one) drive apparel returns well above the all-category average.
what is a good return rate for uk ecommerce?
It depends on category. Below ~19.5% means you are beating the UK online average. Apparel brands should benchmark against ~23%, not the blended number, while standardised-spec categories like electronics (~11%) and beauty (~12%) should aim lower.
how much does a return actually cost a uk ecommerce business per item?
Plan for about £10-£25 in reverse-logistics cost per returned parcel before the refunded item value, once return shipping, handling and restock, markdown, customer-service time and non-refunded payment fees (2-3% of order value) are counted. On fashion it can reach 20-40% of the item price.
should uk dtc brands charge for returns?
Not automatically. Charging can cut return rates and protect margin, but it can also dent conversion and repeat purchase. The right move is to measure your true cost per return first, then decide between keeping returns free, gating them behind an order-value threshold, or charging a flat fee, by category.
is the uk online return rate going up or down?
Down slightly. The non-food online rate eased from ~21% in 2024 to a forecast ~19.5% in 2025, helped by tighter returns policies and bracketing crackdowns. It is still high enough to be a permanent tax on contribution margin.
how do i calculate my true cost per return?
Add return shipping, warehouse handling and restock, the non-refunded payment fee (2-3% of order value), any markdown or value loss on the returned unit, and customer-service time. Multiply by your monthly returns volume, then divide by revenue to see returns cost as a percentage of the top line.
how does the uk return rate compare to the us, australia and canada?
The UK's ~19.5% online rate is broadly in line with other mature ecommerce markets, where blended online returns cluster in the high-teens to low-20s and apparel runs in the mid-20s. The mechanics (fit uncertainty, bracketing, free-returns expectations) are the same across geos, so the operator playbook travels.
Related Eightx benchmarks: UK ecommerce KPI benchmark 2026: AOV, conversion, CAC and returns by vertical and UK online retail share, April 2026: 27-28% online, with clothing at 29% and food still at 10%. For hands-on help with your numbers, talk to our fractional CFO team.