
Insights
UK ecommerce KPI benchmark 2026: AOV, conversion, CAC and returns by vertical
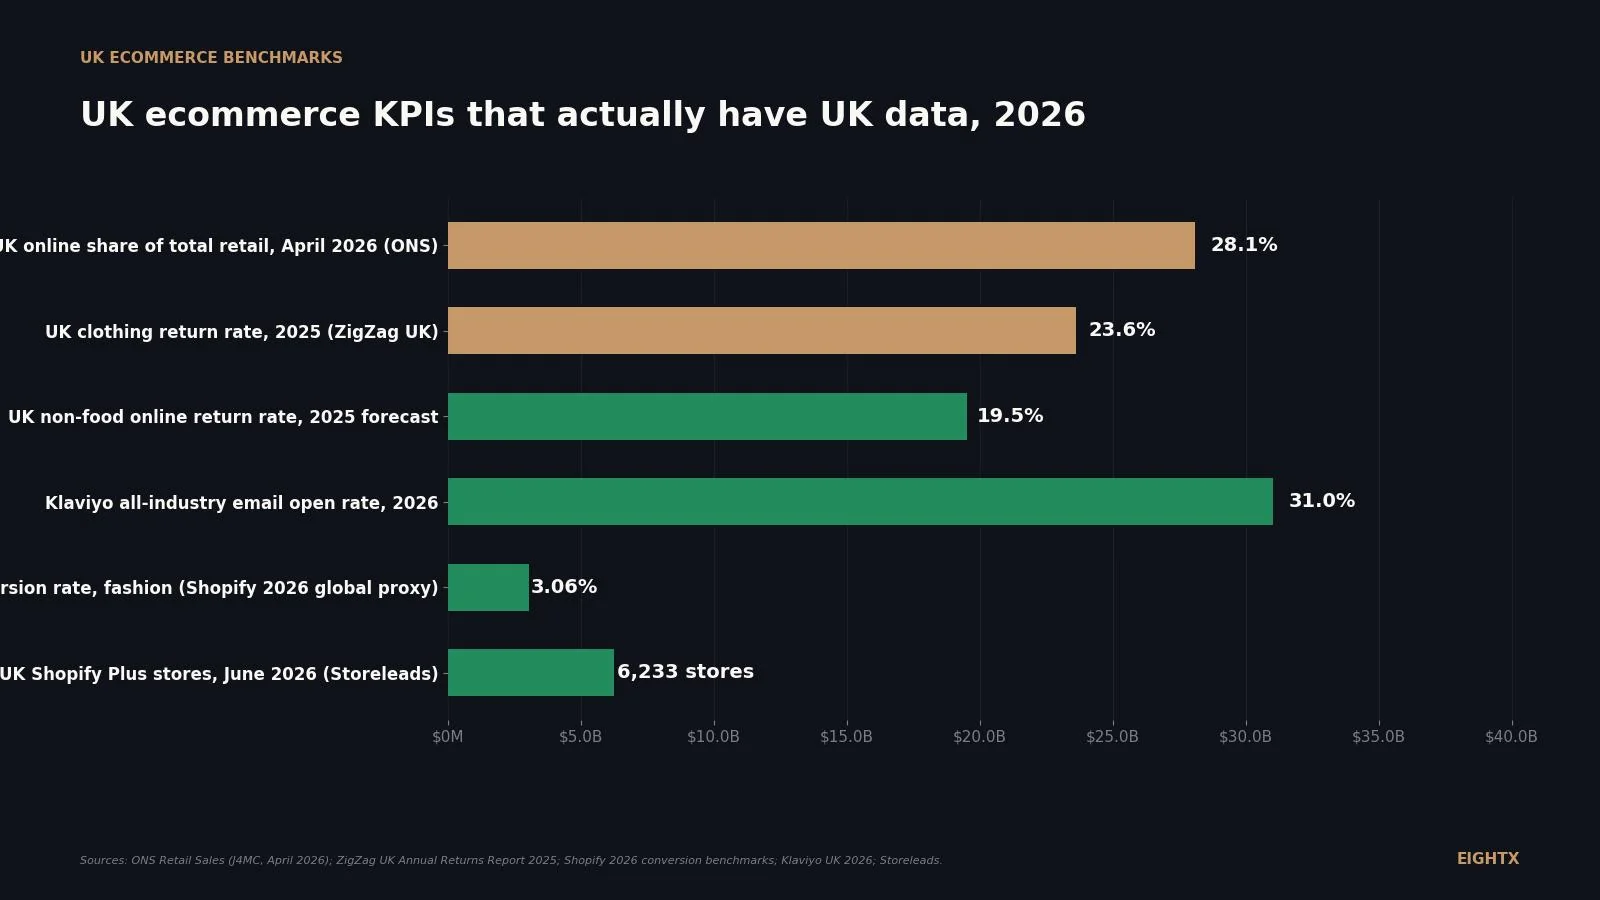
UK online retail share sits at 28.1 percent (ONS, April 2026), with online sales value up 6.6 percent year-over-year. UK clothing returns run 23.6 percent (ZigZag), the only UK-published per-category return rate. UK Shopify AOV sits at roughly 62 pounds versus the global Shopify median of $87, with fashion at 85 to 120 pounds the planning band.
Key Takeaways
- UK online retail share is 28.1% in April 2026 (ONS). Online sales value still grew +6.6% year-over-year despite a one-month dip from March's 28.7%. Share has been moving inside a 27-29% band for most of the past 12 months.
- UK clothing return rate is 23.6% (ZigZag). That is the only fully UK-specific, category-level return rate published openly. Beauty, home, electronics and food UK returns are not in any public 2025-26 dataset, so the table flags those clearly as industry proxies.
- UK non-food online returns are forecast at 19.5% in 2025, down from 21% in 2024. The £25.1bn UK non-food online returns pool is shrinking as paid-returns and tighter policies bite. That is a margin tailwind for apparel and electronics brands willing to charge for returns.
- UK Shopify AOV sits at roughly £62 versus the global Shopify median of $87. Treat the £62 number as a sanity check on your reporting, not a target. Vertical AOV bands (fashion £85-120, beauty £60-95, home £100-180) are the planning numbers.
- UK Shopify Plus has 6,233 stores out of 251,169 total UK Shopify stores (Storeleads, June 2026). That is 2.5% of UK Shopify on Plus. The Plus cohort is your real competitive set if you are above £5m revenue, not the long tail of side hustles.
UK ecommerce is a strange market to benchmark. The official online-share number is published like clockwork by the Office for National Statistics (ONS, the UK's national statistics agency), and at 28.1% of total retail it is one of the highest online shares in the developed world. But the operator-level KPIs underneath it (average order value, conversion rate, return rate, customer acquisition cost) are mostly missing from public UK datasets. The vendor blogs that fill the gap usually publish global Shopify averages and let UK operators assume they apply.
This post is the operator's quarterly-refreshed reference for what "normal" actually looks like in UK ecommerce in 2026, with the gaps in public UK data called out honestly. We will lean on UK-specific sources where they exist (ONS for retail share, ZigZag for clothing returns, Storeleads for the Shopify Plus footprint) and global Shopify and Klaviyo benchmarks as the next-best proxy for the metrics no one publishes UK-only.
How big UK ecommerce actually is right now (ONS view)
UK online sales were 28.1% of total retail in April 2026, per the ONS Retail Sales bulletin released 22 May 2026. That is down slightly from 28.7% in March 2026, but online sales value still grew +6.6% year-over-year in April. The headline online share has been moving inside a 27% to 29% band for most of the past 12 months, after the post-pandemic reversion settled in around mid-2023.
The ONS J4MC series has the full historical context for anyone who wants to compare against pre-pandemic or lockdown peaks (note the J4MC non-store sales definition shifted in 2018, which affects pre-2018 comparability but not the 2026 reads here). Today's 28% has been stable enough that operators should treat it as the working assumption for medium-term TAM forecasting rather than a number that will drift much further up.
The monthly detail behind the chart is below. Note that the ONS bulletin text exposes the share figure each month but the full per-sector breakdown (food, non-food, textile-clothing-footwear, household goods, non-store) lives inside the downloadable retailsalesindexinternetsales.xlsx reference workbook.
Month Online share of retail (%) Online sales value YoY (%) Source April 2026 28.1 +6.6 ONS April 2026 bulletin March 2026 28.7 +10.5 ONS March 2026 bulletin February 2026 28.4 n/a ONS J4MC series January 2026 28.2 n/a ONS J4MC series December 2025 28.6 n/a ONS J4MC series June 2025 27.8 +5.4 ONS J4MC series May 2025 27.4 +5.0 ONS J4MC series
The practical read for operators: UK online TAM is growing at +6% to +10% on value year-over-year in the months ONS has reported, even with share roughly flat. That is the demand backdrop you are running against. If your brand is growing slower than the prevailing ONS YoY figure for the current month, you are losing share to the market, not winning it (caveat that a single month is noisy; use a 3-month rolling read where you can).
AOV by vertical: why £62 is a sanity check, not a target
The UK Shopify AOV baseline is approximately £62 (around $78) per the EasyApps 2026 country breakdown, which sits well below the global Shopify median of $87. That is useful as a sanity check on your reporting (if you are seeing UK AOV under £30 across all traffic, you probably have a tracking bug or a heavy mix of single-item subscription orders) but it is not a planning target. The vertical bands matter more.
The table below combines the best-available UK or UK-applicable per-vertical numbers for AOV, conversion rate and return rate. AOV ranges are from aggregated 2026 email-AOV data. Conversion rates are Shopify's 2026 global benchmarks, used as the closest proxy for UK Shopify merchants. Return rates are flagged clearly where they are UK ZigZag versus industry proxy.
Vertical AOV range (GBP) Conversion rate (%) Return rate (%) Return-rate basis Fashion and apparel £85-120 3.06 23.6 UK ZigZag 2025 Beauty and personal care £60-95 4.94 ~6 Industry proxy Home and furniture £100-180 1.41 ~9 Industry proxy Food and beverage £50-80 6.22 ~2 Industry proxy Consumer electronics £150-300 1.58 ~8 Industry proxy Multi-brand retail £70-120 3.93 ~12 Industry proxy
Two notes on how to read this. First, the AOV ranges are mass-market and premium together. If your brand is positioned premium (think Castore, Sweaty Betty), expect to sit at or above the top of the band. If you are mass-market with a heavy promo cadence, expect the bottom of the band. Second, the conversion rates are all-traffic medians. Cold paid traffic typically converts at half the median, returning and brand-search traffic at two to three times the median.
Conversion rate: Shopify's 2026 global numbers as the starting line
There is no UK-only Shopify Plus conversion benchmark published openly. That means UK operators have to use Shopify's 2026 global vertical numbers as the proxy. They split roughly as follows: food and beverage 6.22%, beauty and personal care 4.94%, multi-brand retail 3.93%, fashion and apparel 3.06%, consumer goods 2.85%, consumer electronics 1.58%, home and furniture 1.41%, luxury and jewelry 0.94%.
The chart below plots the conversion-rate vs return-rate trade-off across the six verticals where we have both numbers (with the proxy caveats above). It tells a useful operator story: the verticals with the highest conversion (food, beauty) also have the lowest returns. The ones with the most painful returns (fashion at 23.6%) sit in the middle of the conversion table. Apparel is genuinely a harder business than the conversion rate alone suggests, because the contribution margin gets re-priced by returns after the order is booked.
The Shopify global benchmark is the best we have for UK Shopify but it is not perfect, and we do not have a published study quantifying the UK-vs-global proxy error. Mix shifts (mobile share, vertical mix, promo cadence, brand-search share of traffic) all move conversion meaningfully, and mobile typically converts well below desktop in every market we have seen. Before you spend a quarter chasing a conversion-rate gap to the Shopify global median, check your device and traffic-source mix against the cohort the benchmark is built on.
Return rates: where ZigZag is the only UK-specific truth
UK clothing return rate is 23.6% of ecommerce orders in 2025 per ZigZag's annual returns report. That is the headline number and it is the one to benchmark against if you sell apparel. Above 28%, something is broken (usually sizing). Between 20% and 28%, you are in the band. Below 18%, either you are selling lower-return categories like basics or t-shirts, or your returns policy is so restrictive it is suppressing orders too. Worth restating clearly: the beauty, home, electronics and food return rates in the vertical table above are industry proxies, not UK measurements. Only the apparel 23.6% is a UK-published number.
ZigZag and Retail Economics' companion report puts the overall UK non-food online return rate at 19.5% in 2025, forecast down from 21% in 2024. The total non-food online returns value is forecast at £25.1bn in 2025, down from £26.7bn in 2024. That £1.6bn drop tracks with the wider shift to paid-returns policies and tighter return windows across UK fashion and non-food brands over 2024 and 2025. The directional read for operators: UK consumers have started to accept paid returns as a norm, which means you can probably introduce a £2-£3 return fee without seeing the conversion drop you would have seen 18 months ago.
The 28-day refund timeline is the other UK-specific factor. Under the Consumer Contracts Regulations, UK buyers have 14 days from delivery to notify their intent to return, then another 14 days to send the goods back. You have 14 days from receipt to refund. That is a 42-day worst-case cash float from order date to refund. Build your returns reserve accordingly.
CAC and ad-spend benchmarks: Triple Whale, Klaviyo, and what they don't tell you about the UK
UK CAC by vertical is essentially unobtainable from public data. The closest proxy is Triple Whale's February 2026 benchmark across 30,000+ DTC brands globally: paid-ads median CPA $32.74, Meta median CPA $38.19. That maps to roughly £26-£30 in GBP at current FX. We do not have UK-specific by-vertical CAC bands from a published source, and we will not invent them here.
Klaviyo's 2026 UK blog is the cleanest UK-presented email benchmark we have, even though the underlying cohort is global (183,000+ brands). The numbers below give you the open-rate target by vertical. Click rates were not exposed per-vertical in the public article, only the all-industry average of 1.69%.
What the public data does not tell you, and what matters most for UK operators: the FX swing between dollar-priced Meta auctions and GBP-denominated orders is now a meaningful margin line item. A UK brand running paid ads through a US-billed Meta account is effectively short the dollar and long the pound on every cohort. If GBPUSD moves 5% in a quarter, your effective CAC moves with it, even if your creative and audience targeting are unchanged. Most UK operators do not hedge this. The ones above £20m revenue probably should.
How to actually use these numbers as an operator
Three practical moves for the next 90 days.
Anchor your AOV to the vertical band, not the £62 UK Shopify median. If you sell premium fashion and your reported AOV is £90, you are at the bottom of the £85-120 band, not above the £62 average. That is a different priority list. Pull bundle and add-on tactics if you are bottom-of-band; pull margin and merchandising if you are top-of-band.
Pick one return-rate lever this quarter, not five. ZigZag's 23.6% UK clothing benchmark is your scoreboard. The single highest-ROI move for most apparel brands is fixing the size guide, because fit-and-size issues are the dominant return reason category in every UK apparel returns study we have seen. Branded paid-returns policies are the second move. Restocking fees, restricted-window policies and tighter free-shipping thresholds are further down the list.
Use the conversion-rate vertical median as your "table stakes" number, not your target. Top-quartile Shopify brands typically hit 1.5x to 2x the vertical median. If you are running at the median and selling fashion, you are converting at 3% and your target is 4.5-6%. The lever there is almost always PDP design and product imagery before it is checkout flow or trust badges.
The UK has the cleanest macro retail data of any major ecommerce market (ONS J4MC is the gold standard for online share) and some of the patchiest operator data. That asymmetry is the operator's edge if you know what to source from where. Use ZigZag for UK returns, Shopify global for conversion, Klaviyo UK for email, Triple Whale for paid CPA, and Storeleads for the competitive landscape. Stop treating vendor blogs as UK truth.
Sources and methodology
ONS Retail Sales bulletins. The UK Office for National Statistics releases the Retail Sales bulletin monthly, approximately 3 to 4 weeks after the reference month. The April 2026 bulletin (released 22 May 2026) gives the headline online share of 28.1% directly in the text. Monthly percentages by store-type sector live in the downloadable retailsalesindexinternetsales.xlsx reference file. The 4-letter ONS series codes (e.g. J4MC for "internet sales as a proportion of all retailing") sit in the workbook header rows. We pull the headline series J4MC for the chart and confirm against the bulletin text for the most recent two months.
ZigZag Global Annual Returns Report and Retail Economics x ZigZag UK Returns Benchmark 2025. ZigZag is the single most reliable UK-specific return benchmark publisher. Quoted figures: UK clothing return rate 23.6%; UK non-food online return rate forecast 19.5% in 2025, down from 21% in 2024; UK non-food online returns forecast £25.1bn for 2025, down from £26.7bn in 2024. The companion Retail Economics report is the formal joint publication.
Shopify 2026 ecommerce conversion rate guide. Reports global vertical conversion benchmarks over the past 12 months (covers 2025-2026). Not UK-only and not Plus-only, but the closest publicly accessible by-vertical Shopify benchmark and the one used here as the UK Shopify proxy. We do not have UK-only Shopify Plus conversion data, and any source claiming to is almost certainly extrapolating from global.
Klaviyo UK 2026 email marketing benchmarks. Klaviyo's UK blog presents the 2026 Email Marketing Benchmarks based on the global 183,000+ customer cohort, not a UK-only cut. Open and click rates by vertical are public; conversion and revenue-per-recipient by vertical are gated in Klaviyo's interactive benchmark tool. We report the all-industry click rate (1.69%) once rather than per-vertical, because per-vertical clicks are not in the public article.
Triple Whale Ecommerce Benchmarks 2026. Published February 26, 2026. Aggregates 30,000+ DTC brands globally. Provides Meta and paid-ad median CPA, plus conversion and cart abandonment rates by vertical. Used here for the global CPA medians and noted clearly as global, not UK-only.
Storeleads UK Shopify footprint. Direct query, June 2026: country filter GB, platform filter Shopify, returns 251,169 stores. Adding plan filter Shopify Plus returns 6,233 stores. The 2.5% UK Shopify Plus share is calculated from those two numbers.
Update cadence. This is a living-index post. Headline ONS share will be refreshed each month after the next bulletin. Vertical benchmarks (conversion, AOV, returns) will be refreshed quarterly as the underlying sources publish updates. The most likely next material change is the next ZigZag annual report (typically Q3 each year) and the Shopify 2027 update (typically January).
For more on the underlying mechanics, see our average ecommerce return rate by vertical and average CAC by ecommerce vertical reference pages.
Frequently asked questions
what is the average conversion rate for a uk shopify store in 2026?
There is no UK-only Shopify conversion benchmark published openly. The closest proxy is Shopify's 2026 global benchmark by vertical: food and beverage 6.22%, beauty 4.94%, multi-brand retail 3.93%, fashion 3.06%, consumer goods 2.85%, home and furniture 1.41%. We do not know the size of the UK-vs-global proxy error, so use the global numbers as a directional starting line, not as your UK target.
what is the average order value for a uk dtc brand in 2026?
UK Shopify AOV averages roughly £62 across all verticals (around $78), versus the global Shopify median of $87. Use £62 as a sanity check on your reporting, not a target. Plan by vertical instead: fashion £85-120, beauty £60-95, home £100-180, food £50-80, electronics £150-300.
what is a normal return rate for uk fashion ecommerce?
23.6% of orders in 2025, per ZigZag's UK annual returns report. That is the only fully UK-specific, category-level return rate published openly. Anything between 20% and 28% is in the band. Above 28% usually means a sizing or fit problem, not a logistics problem.
how does the uk online retail share compare to the us?
UK is 28.1% in April 2026 per ONS, which is one of the highest online retail shares in the developed world. We do not publish a current US/AU/JP comparison number here because those national statistics offices each define and release online retail share on different schedules and methodologies, and a directly comparable number for the same reference month is not in our research bundle. For an apples-to-apples cross-market number, pull from each country's official statistics agency directly (US Census Bureau retail e-commerce, ABS Retail Trade in Australia, METI in Japan).
is the uk online retail share growing or shrinking in 2026?
Growing on value, flat-to-mildly-rising on share. UK online sales value grew +6.6% year-over-year in April 2026 (ONS). Online share dipped from 28.7% in March to 28.1% in April, but the 12-month trajectory is upward inside the 27-29% band.
what is the average customer acquisition cost for a uk ecommerce brand?
No UK-only CAC by vertical is published anywhere reliable. The closest defensible reference point is Triple Whale's global February 2026 data across 30,000+ DTC brands: paid-ads median CPA $32.74 and Meta median CPA $38.19 (roughly £26-£30 in GBP at current FX). Treat that as a global floor, not a UK target. The honest answer is your real UK CAC has to be measured from your own MMM or platform-attributed data, because no public source breaks CAC down by UK vertical.
why is my apparel brand's return rate higher than 23.6%?
Three usual causes. One, you sell sizes that fit unevenly (denim, shoes, fitted dresses) and the 23.6% figure averages those against easier categories like t-shirts. Two, your size guide is wrong or generic. Three, you ship internationally with no duty disclosure, which triggers refusal-on-delivery. Fix the size guide first, it is the cheapest lever.
what email open rate should i be hitting on klaviyo if i'm a uk beauty brand?
30.5% per Klaviyo's 2026 UK blog, against an all-industry average of 31.0%. Anything 28% or higher is fine. Top-decile Klaviyo brands hit 45%+ open rates. The lever is list hygiene and pre-header copy, not subject-line A/B testing.
how many uk shopify plus stores are there in 2026?
6,233 UK Shopify Plus stores in June 2026, per Storeleads. That sits inside a total UK Shopify population of 251,169 stores, so 2.5% of UK Shopify merchants are on Plus. If you are above £5m revenue, the Plus cohort is your real competitive set.
should i benchmark my uk store against global shopify averages or uk-only data?
Use UK-only data where it exists (ZigZag returns, ONS retail share) and global Shopify benchmarks where it does not (conversion by vertical, AOV by vertical). Do not benchmark against US-only data on returns or AOV. UK ticket sizes run smaller and UK returns law (14-day cooling-off) shapes behaviour differently.
what's a good cpa for meta ads if i'm a uk dtc brand in 2026?
Triple Whale's 2026 global Meta median is $38.19 (roughly £30) across 30,000+ DTC brands. No public source breaks Meta CPA down by UK vertical, so treat the global median as a directional floor rather than a UK target. The more useful rule of thumb: if your Meta CPA is more than 2x your AOV's contribution margin, the issue is unit economics, not creative.
how does the uk consumer returns law affect my returns policy?
UK Consumer Contracts Regulations give buyers a 14-day cooling-off period from delivery to notify intent to return, plus another 14 days to send the goods back, with refund required within 14 days of receipt. You can charge for return shipping but not for the right to return. This is why paid-returns policies work in the UK without legal risk.