
Insights
UK online retail share, April 2026: 27-28% online, with clothing at 29% and food still at 10%
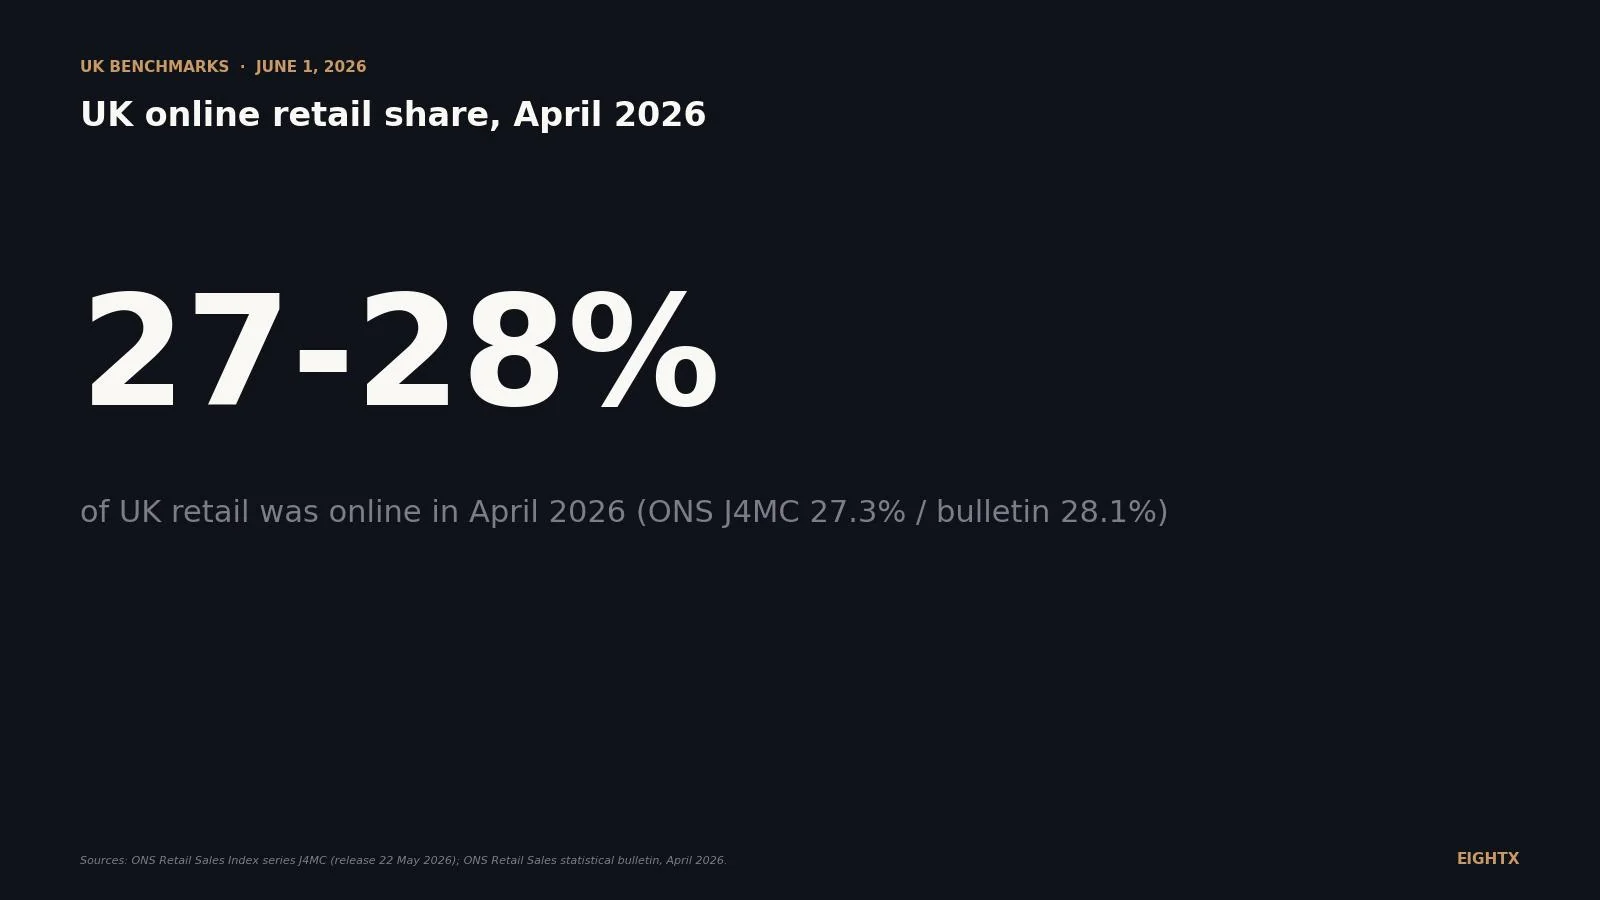
UK online retail share sat at 27 to 28% of total retail in April 2026, with the ONS J4MC time-series printing 27.3% and the same-day bulletin headline citing 28.1%. Clothing and footwear leads at 29.3% (ONS MS76) while food sits at 10.1% (ONS KQ77). The COVID effect was permanent, not transient: the pre-2020 baseline was 19.3% and the share has plateaued at 26 to 28% since 2022, a structural step-change every UK DTC operator inherited.
Key Takeaways
- UK online retail share sat at 27-28% in April 2026. The ONS time-series file (J4MC) prints 27.3%; the same-day bulletin headline cites 28.1%. Both are official, both are correct for their vintage. Lead with the range, not a single point.
- The COVID spike never unwound. Pre-COVID baseline (Jan 2019) was 19.3%. The January 2021 lockdown peak was 37.8%. The share has settled into a 26-28% plateau since 2022. It is a structural step-change, not a temporary anomaly.
- Clothing is the most digitised UK store category at 29.3% (April 2026, ONS MS76). Food is barely 10.1% (ONS KQ77). The 19-point category gap matters more than the national headline for any DTC operator forecasting share.
- UK is the high-water mark for English-speaking ecommerce. UK 27.3% vs US 16.9% (Q1 2026 Census) vs Australia 12.7% (final ABS print, June 2025). UK leads the US by 10pp and AU by 15pp. The US/AU forward curve runs through here.
- Forecast by category, not headline. Apparel and footwear DTC are operating near peak structural share. Food/grocery has the most upside but brutal unit economics. For TAM modelling use the J4MC time series plus your category-specific series (MS76 clothing, KQ77 food, MS73 non-food).
UK online retail share sat at 27-28% of total retail in April 2026, according to the latest ONS Retail Sales release on 22 May 2026. The time-series file (series J4MC) prints 27.3% and the same-day bulletin headline cites 28.1%. Both are official ONS, both are correct, and the gap is a vintage difference. That range is the one to plan against if you sell physical goods into the UK. It is the highest-penetration major English-speaking market and the forward curve for US and Australian operators by roughly 5 to 10 years.
This post does three things. It walks through the 27-28% headline and the bulletin-vs-time-series discrepancy so you can cite the right number without contradicting widely-quoted media coverage. It splits the headline by category, because online share in the UK is really a clothing-versus-food story. And it places the UK against the US and Australia so US and AU operators have a clean comparator for their own forecasts.
The headline: 27-28% online and parked there for four years
The April 2026 ONS Retail Sales release contains two numbers for the same period and the same metric. The J4MC time-series file (the master record for the monthly series) shows 27.3%. The Retail Sales statistical bulletin published the same day cites 28.1% and says online share "fell from 28.7% in March 2026 to 28.1% in April 2026." The J4MC file for the same months prints 28.1% (March) and 27.3% (April).
The reason is vintage. The bulletin uses first-release figures. The time-series file aggregates the latest revisions and the most recent seasonal-adjustment run. The 0.6 to 0.8 percentage point gap is normal for first-release vs revised ONS retail data. For any post or pitch deck that needs a number, lead with "27-28% in April 2026" and footnote both URLs. Do not pick a single point estimate without showing both.
Zoom out and the bigger story is structural. The pre-COVID baseline (January 2019) was 19.3%. The January 2021 lockdown peak was 37.8%. The share has settled into a 26-28% range since mid-2022 and has not moved meaningfully in four years. The COVID effect was permanent, not transient. The 8 percentage points between the 2019 baseline and today's plateau is the structural step-change that every UK DTC business inherited.
The monthly chart makes the floor visible. Notice the November and December bumps every year: Christmas demand pushes online share 3 to 5 percentage points above the trailing baseline. The Q4 spike then unwinds in January and February. If you are forecasting your own monthly share against the national series, build that seasonal pattern into your model.
The category gap: clothing at 29%, food at 10%
The single most useful slice in the April 2026 release is the category split. ONS publishes online share by store type under separate series IDs. Three matter for operators.
Textile, clothing and footwear stores (series MS76) printed 29.3% in April 2026. That is the highest of any traditional store category and sits above the all-retail headline. The category peaked at 64.0% in February 2021 during the second lockdown (when high-street clothing was effectively closed and every clothing transaction had to be online) and has settled into a 27-30% structural band since 2023.
Predominantly food stores (series KQ77) printed 10.1% in April 2026. That is barely a third of the all-retail headline. Pre-COVID baseline was roughly 5.4%, so the lockdown roughly doubled it, but it has been stuck in the 9-10% range for three years. Grocery online is structurally capped by perishable supply chains, basket economics that favour weekly in-store trips, and slim margins on home delivery.
Predominantly non-food stores (series MS73) sat at roughly 25.0% on an annualised 2025 basis. That is the catch-all bucket: household goods, electronics, recreational goods, "other" retail. It tracks close to the all-retail headline because it is roughly half of total retail by spend.
For an operator the implication is straightforward. The national 27-28% figure is the wrong benchmark for your category. If you sell clothing, footwear or accessories, benchmark against 29%. If your share is materially below 29% your category has room to migrate further. If you are above 35%, you are operating ahead of the structural curve and your growth will have to come from category-share gains rather than channel-share gains. If you sell food, the 10% ceiling is the right framing.
Category (ONS, April 2026) Online share (%) ONS series ID Notes All retail (excl. fuel), time series 27.3 J4MC Time-series file value All retail (excl. fuel), bulletin 28.1 J4MC Bulletin initial-release headline Textiles, clothing & footwear stores 29.3 MS76 Seasonally adjusted Predominantly non-food stores ~25 (2025 avg) MS73 2025 annual average Predominantly food stores 10.1 KQ77 Non-seasonally adjusted
The COVID spike that never unwound
Look at the annual averages and the structural step-change is unmistakable. UK online share was 11.3% in 2014, 19.2% pre-COVID (2019), 28.1% in 2020, 30.7% in 2021 (the peak year), and has held in a 26.6% to 27.5% range every year since. The 2025 annual average was 27.5%. Q1 2026 is tracking at 28.0%.
The arc tells you two things. First, the 2020 spike anchored online share at a permanently higher level. Even the post-COVID normalisation never went below 26%, which is roughly 7 percentage points above the 2019 baseline. That is the structural shift. Second, the rate of change has slowed dramatically. UK online share grew roughly 1 percentage point per year between 2010 and 2019, jumped 8 points in 2020, then has added less than half a point per year since 2022. The growth engine is no longer headline share. It is category-level migration.
Year UK online share (%) Note 2007 3.4 J4MC first year 2010 7.3 2014 11.3 2017 16.3 2019 19.2 Pre-COVID baseline 2020 28.1 COVID step-change 2021 30.7 COVID peak year 2022 26.6 Normalisation begins 2023 26.7 Plateau 2024 27.1 Plateau 2025 27.5 Plateau 2026 (Q1) 28.0 Latest quarter
On the £ side the numbers keep growing even though the share ratio is parked. ONS series JE2J (internet retail sales, all retailing, weekly average) printed £2,531.5 million in April 2026, up from £1,348.1 million in April 2019. That is 88% nominal growth in the underlying online spending pool over seven years, even as the share ratio stabilised. The denominator (total retail) grew too. Both pies got bigger. So even though "online share is parked" is the right headline framing, "online spend keeps compounding" is the right operator framing for TAM modelling.
International context: UK is the high-water mark
For US and Australian operators the UK is the most useful forward curve in the English-speaking world. The April 2026 picture: UK 27.3%, US 16.9% (Q1 2026 Census), Australia 12.7% (final ABS print, June 2025). UK leads the US by 10 percentage points and Australia by 15.
The gap has been closing but slowly. The US has added roughly 5 percentage points since 2019 (11.0% to 16.9%, including the pandemic anchor). Australia has roughly doubled over the same period (6.3% to 12.7%) but is still well behind both peers. The UK gained roughly 8 percentage points between 2019 and 2025 with most of that captured in the 2020 spike. None of the three series shows runaway acceleration since 2022.
The forecasting implication for US operators is that the UK ceiling appears to sit somewhere in the high 20s. If you are planning a 5-year US DTC trajectory, "US converges on UK levels" is the bull case. Census ECOMPCTSA at 25-28% by 2030 is plausible but not guaranteed. The more conservative path is 20-22% by 2030 if US catches up on the structural drivers (parcel network density, payments infrastructure, category migration) at the same rate it has averaged since 2014.
The forecasting implication for Australian operators is bigger upside on paper. AU at 12.7% maps roughly to where the UK was in 2014-2015. If AU follows the UK with a 4 to 5 year lag (which has been roughly true since 2015), AU should hit 18 to 20% by 2030. The companion analysis of AU online retail share at 12.7% walks through the rebuild after the ABS killed the monthly cat. 8501.0 series.
Country Online share (%) Reference period Statistical office / series United Kingdom (time series) 27.3 April 2026 ONS J4MC United Kingdom (bulletin) 28.1 April 2026 ONS Retail Sales bulletin United States 16.9 Q1 2026 (SA) US Census ECOMPCTSA Australia 12.7 June 2025 (final) ABS cat. 8501.0
UK online share is parked in the high 20s. Clothing is at 29%, food is at 10%, and the national headline has not meaningfully moved in four years. The next leg of growth is category migration, not channel migration. Forecast your TAM at the category level using the right ONS series for your product, and use the UK plateau as the upper bound for what US and Australian operators are heading toward over the next decade.
What this means for your business if you sell physical goods into the UK
Three things to do this quarter.
Pick the right ONS series for your category and build it into your TAM model. The national J4MC headline is the wrong benchmark for almost every DTC operator. If you sell clothing, footwear, or accessories, use MS76 (currently 29.3%). If you sell food or grocery, use KQ77 (10.1%). If you sell non-food household goods, electronics, or general merchandise, use MS73 (annualised 25% in 2025). Updating your forecasting deck to cite the category-specific series rather than the headline is a 10-minute fix that materially sharpens your TAM math.
Plan around 26-28% headline share through 2027. Do not build a UK plan that assumes the headline keeps climbing at the 2020-2021 rate. Four years of plateau says the structural ceiling is somewhere in the high 20s. Your category share growth is the lever, not the channel share growth. Apparel pure-plays should plan for category-level wins (taking share from high-street and from other online players) rather than for the rising tide of total online share.
For US and AU operators, use UK as your 5-10 year forward curve. UK is the most useful comparator in the English-speaking world for ecommerce penetration. If your strategy is forecasting where US or AU online retail goes by 2030, anchor the bull case on UK current levels and the bear case on the slower path the US has actually walked since 2014. The companion post on ecommerce penetration across US, UK, EU, AU and Canada covers the cross-country comparison in more detail.
For more on category-specific UK and DTC benchmarks see our coverage of apparel public benchmarks for 2026 and our Australian online retail share analysis that uses UK J4MC as the forward curve.
Sources and methodology
Primary UK data: ONS Retail Sales Index (RSI), Great Britain. The headline series is J4MC ("Internet sales as a percentage of total retail sales (ratio)", measured in %), released monthly. This post uses the full monthly history from January 2019 through April 2026, plus annual averages 2007-2025 and quarterly 2007 to Q1 2026. The latest J4MC point covers April 2026 and was released on 22 May 2026 alongside the Retail Sales bulletin. Next release: 19 June 2026 (covering May 2026 reference period).
Category-level UK data: ONS RSI by store type. Three sub-series are cited. MS76 is "Textile, clothing and footwear: All Bus: SA: proportion of retail," seasonally adjusted, full monthly history from January 2008. KQ77 is "Pred Food stores: All Bus: VAL NSA: proportion of retail," non-seasonally adjusted, full monthly history from January 2009. MS73 is "Pred non-food stores: All Bus: SA: proportion of retail," seasonally adjusted, used here for the 2025 annual average. Category series differ in seasonal-adjustment vintage (MS76 is SA, KQ77 is NSA), which is fine for direction-of-travel but not strictly apples-to-apples on the seasonal axis.
UK online spend in £: ONS JE2J. "Internet retail sales, £ millions, All retailing", average weekly value in £ millions. April 2026 prints £2,531.5 million weekly, up from £1,348.1 million in April 2019. The 88% nominal growth over seven years is the right framing for any TAM model that needs absolute spending rather than share ratios.
US comparison: US Census Bureau ECOMPCTSA. Q1 2026 = 16.9% seasonally adjusted (16.8% NSA). E-commerce sales were $326.7 billion SA against total retail of $1,929.0 billion SA. YoY growth was +9.8% e-commerce versus +3.9% total retail. Release date 18 May 2026. Mirror on FRED for time-series access at https://fred.stlouisfed.org/series/ECOMPCTSA.
Australia comparison: ABS cat. 8501.0 (discontinued). Final monthly print released 31 July 2025 covering June 2025 reference period. Headline online share was 12.7%. ABS discontinued the monthly online retail share series after the June 2025 print. From mid-2025 onward AU online share has to be triangulated across ABS Monthly Household Spending Indicator, ABS Quarterly Retail Trade, Australia Post parcel data, and the NAB Online Retail Sales Index.
Bulletin vs time-series discrepancy. The April 2026 Retail Sales bulletin reports online share of 28.1% for April and 28.7% for March. The J4MC time-series file (released the same day) shows 27.3% for April and 28.1% for March. The most likely explanation is a vintage difference: bulletin tables use first-release numbers while the time-series file aggregates revisions and the most recent seasonal-adjustment run. For citation, both are official ONS. This post leads with "27-28% in April 2026" and footnotes both URLs.
Limitations. Reference periods across the international comparison are not perfectly aligned (UK April 2026, US Q1 2026, Australia June 2025). MS73 (non-food) monthly value was not extracted from the latest release; the table uses the 2025 annual average instead. US annual averages in the comparison chart are smoothed from quarterly ECOMPCTSA values. The 0.6 to 0.8 percentage point gap between the J4MC time series and the ONS bulletin is a known vintage artifact and should be cited as a range, not a single point estimate.
Update cadence. This post is refreshed quarterly when the ONS publishes new J4MC monthly data and revises the back-series. Next refresh target: late June 2026 after the 19 June 2026 release.
Frequently asked questions
what % of uk retail sales are actually online in 2026?
27-28% in April 2026. The ONS J4MC time-series file (the master record) puts it at 27.3%; the same-day Retail Sales bulletin headline cites 28.1% on initial-release data. Both are correct for their vintage. The bulletin uses first-release numbers, the time series file aggregates revisions. Either way, online is parked in the high 20s.
is the uk online share still going up or did it plateau after covid?
It plateaued. Online share spiked from a 19% pre-COVID baseline to 37.8% in January 2021 (the second lockdown peak), then unwound to a 26-28% range that has held since 2022. The COVID effect became structural, not transient. The next 1-2 percentage points of growth will come from category-level penetration, not from the headline.
how much of uk grocery shopping is actually online?
10.1% in April 2026 (ONS KQ77, predominantly food stores). That is up from roughly 5.4% pre-COVID, so the lockdown roughly doubled it, but it has been stuck in the 9-10% range for three years. Food online share is structurally capped by perishable supply chains and basket economics that favour weekly bricks-and-mortar trips.
what's the online share of clothing in the uk, is it really above 30%?
29.3% in April 2026 (ONS MS76, textile, clothing and footwear stores). It is the most digitised UK store category, sitting above the all-retail headline. The all-time peak was 64.0% in February 2021 during the second lockdown. The category has settled into a 27-30% structural band since 2023.
how does uk online retail share compare to the us and australia?
UK leads both by a wide margin. UK April 2026: 27.3% (ONS J4MC). US Q1 2026: 16.9% (Census ECOMPCTSA). Australia June 2025: 12.7% (final ABS cat. 8501.0 print). UK is 10 percentage points ahead of the US and 15 ahead of Australia. The gap is closing slowly. UK is roughly a 5-10 year forward curve for both.
is the ons j4mc series the same as the bulletin headline numbers, why do they differ?
They are the same series, different vintages. The Retail Sales bulletin (initial release) for April 2026 cites 28.1%. The J4MC time-series CSV file released the same day prints 27.3%. The bulletin uses first-release numbers, the time series file picks up post-release revisions and the latest seasonal-adjustment vintage. For citation purposes, both are official ONS. Use the time series file for forecasting and the bulletin for current-period commentary.
what was the uk online share before covid, is the spike still propping up the numbers?
Pre-COVID baseline (January 2019) was 19.3%. The current 27-28% is roughly 8 percentage points above that, which is the structural step-change. It is not the spike propping up the numbers (that fully unwound by 2022) but the underlying behaviour shift that the lockdowns accelerated and never reversed.
should i forecast my dtc tam as a fixed share of uk retail or assume it keeps growing?
Assume slow headline growth and faster category-level growth. The national share has been parked at 26-28% for four years, so the next move is at the category level. Use the J4MC time series for the all-retail anchor and add your category-specific series (MS76 for clothing, KQ77 for food, MS73 for non-food). Forecast 1-2 percentage points of category share lift per year, not headline.