
Insights
On Holding financials teardown: a CFO reads the 20-F
On Holding did CHF 3,014.0M in FY2025 net sales at a 62.8% gross margin, about 20 points above Nike. Direct-to-consumer is 41.8% of sales and growing fastest, marketing held near 10% of revenue, and the balance sheet carries CHF 1.02B cash with no net debt. The one yellow flag is roughly 137 inventory days against tariff-exposed Asia sourcing.
Key Takeaways
- On Holding did CHF 3,014.0M in FY2025 net sales, up 30.0% year-over-year, at a 62.8% gross margin. That margin is roughly 20 points above Nike's 42.7%. Premium price point plus a rising direct-to-consumer mix is the whole story.
- Direct-to-consumer is now 41.8% of sales (CHF 1,260.5M) and growing faster than wholesale. DTC grew +33.7% versus wholesale +27.5%, but wholesale still drives 58.2% of the business. The mix is shifting, not flipping.
- Marketing held near 10% of revenue while scaling to CHF 3B. FY2025 marketing spend was CHF 305.4M (about 10.1% of net sales), roughly flat to the prior year. This is the opposite of the growth-at-any-CAC DTC playbook.
- The balance sheet is a fortress: CHF 1,019.9M cash, CHF 1,632.4M equity, and effectively no net debt. Operating cash flow was CHF 359.5M and free cash flow was about CHF 286.6M. On self-funds its growth.
- The one diligence yellow flag is inventory: roughly 137 days of COGS against an Asia-heavy supply chain into a 2026 US-tariff backdrop. Not a red flag on its own for premium footwear, but the line a CFO would stress-test first.
On Holding (NYSE: ONON, the company behind On Running) is the rare consumer brand that scaled past CHF 3B in revenue without giving up premium economics. Its FY2025 annual report, filed with the SEC as a Form 20-F under IFRS and denominated in Swiss francs (CHF), reads cleanly when you diligence it the way a CFO would before an acquisition. This teardown turns a public company's filings into a benchmark sheet a $5M to $150M brand can hold its own P&L against. Every number here carries a filing trail in the methodology section at the end.
A quick currency note before we start: On reports in Swiss francs, not US dollars. We have kept every figure in CHF and labeled it. CHF and USD have hovered near parity for a while, so you can read CHF as roughly USD in your head, but the filing is in francs and we are not converting it.
The one number that explains On: a 62.8% gross margin
Start where a diligence read starts, at the top of the P&L. On did CHF 3,014.0M in net sales in FY2025, up 30.0% from CHF 2,318.3M the year before. It got there at a 62.8% gross margin, up from 60.6% in FY2024. For context, that margin is about 20 points above Nike's FY2025 gross margin of 42.7%.
That is the whole company in one line. A 62.8% gross margin on CHF 3B of footwear and apparel is not normal, and it is the reason every other number on the statements gets to be healthy. Margin is the oxygen supply. When you carry 63 cents of gross profit on every franc of sales, you can afford to spend on brand, hold inventory, and still drop money to the operating line.
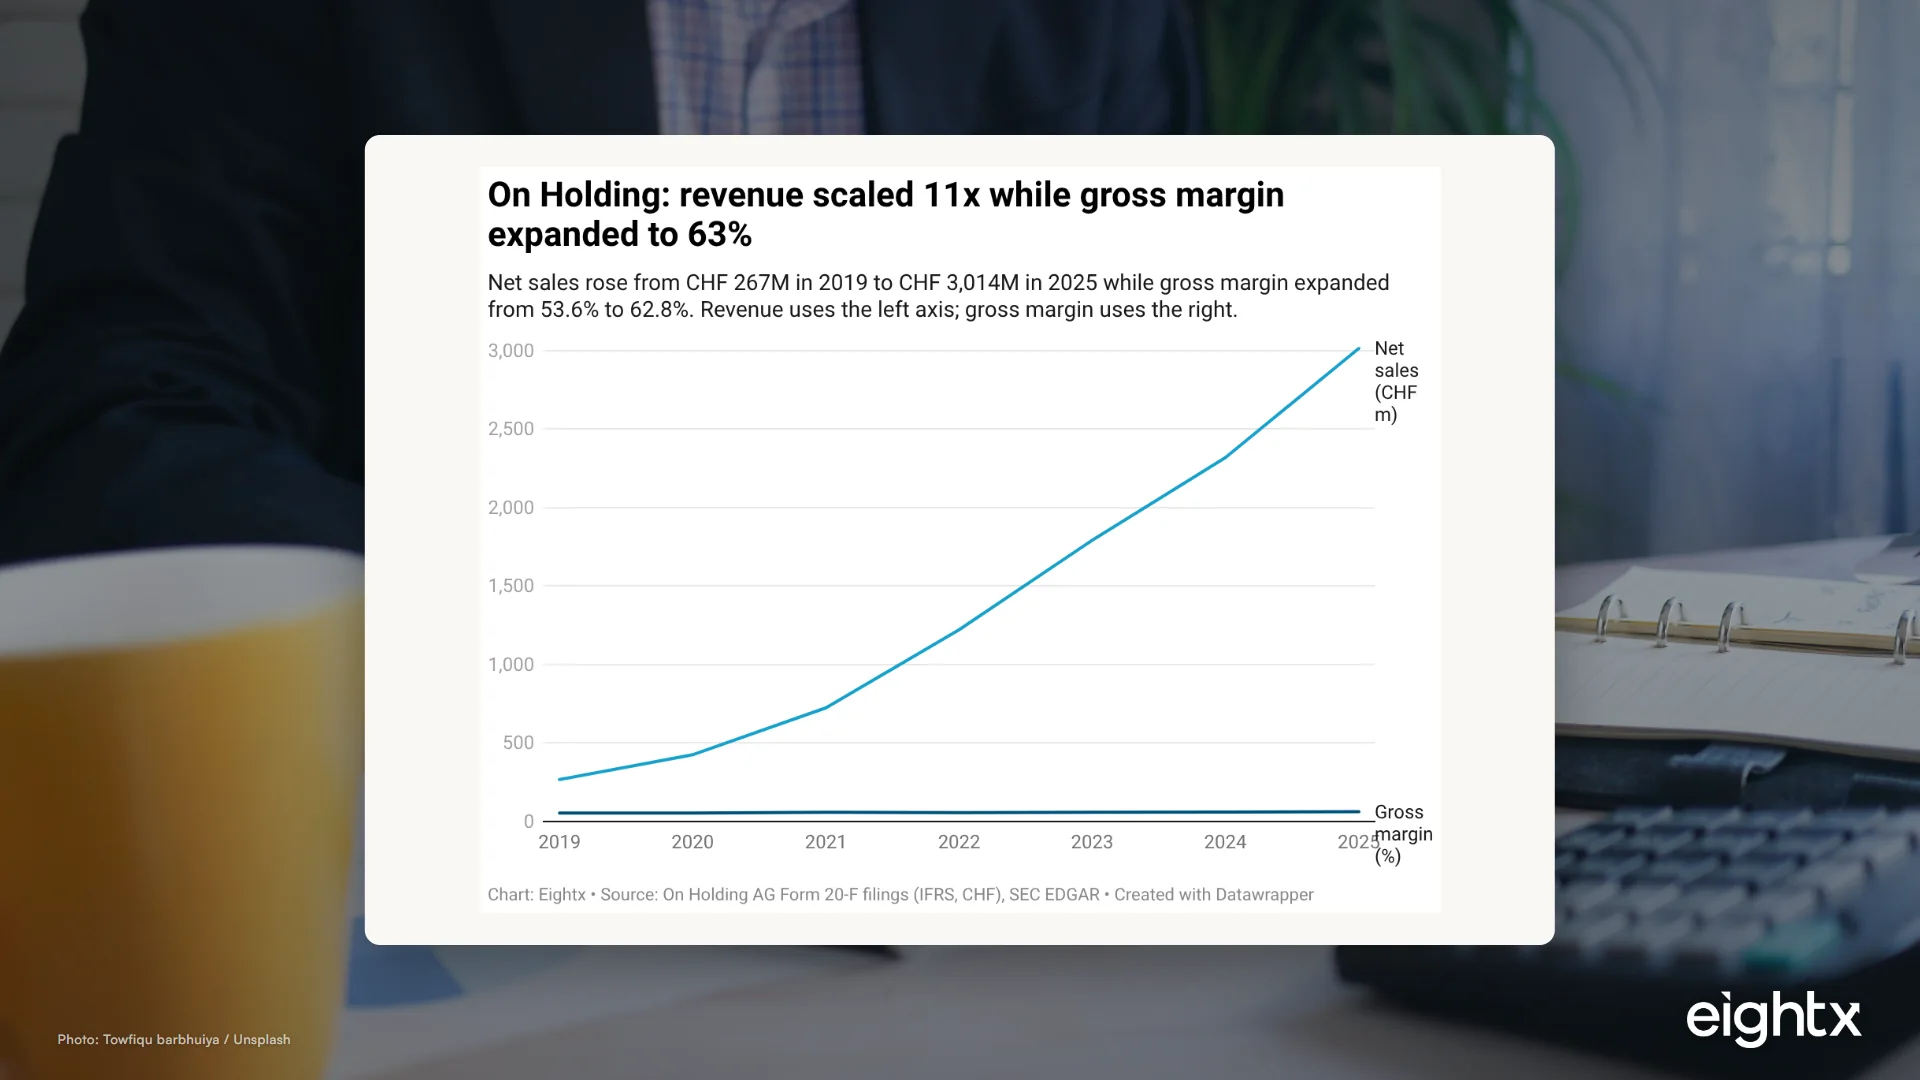
Two levers built that margin. First, a premium price point: On sells running shoes at the top of the market and rarely discounts them. Second, channel mix, which we get to next. The margin has also been expanding, not just sitting still. On compounded net sales from CHF 267.1M in 2019 to CHF 3,014.0M in 2025, a roughly 50% revenue CAGR over six years, and over that same stretch gross margin climbed from 53.6% to 62.8%.
The 20-point gap to Nike is the cleanest way to see how unusual this is. Nike is the most efficient buyer of footwear COGS at scale on the planet, and On still sits two-thirds higher on gross margin because it sells fewer shoes at far higher prices and keeps more of them full-price and direct.
When I talk to founders running a brand doing CHF 20M to CHF 50M, the gross-margin number is the one they most want to wave away. They will tell me their category just runs leaner, that 50% is fine. Sometimes it is. But On is proof that margin is a built thing, not a category accident. The brands that protect price and own the customer end up with the headroom to do everything else.
DTC vs wholesale: On still leans on wholesale, but the mix is shifting
Here is the lever behind the margin. On's direct-to-consumer channel (its own stores and website) is now 41.8% of net sales at CHF 1,260.5M, and it is growing faster than wholesale. DTC grew +33.7% year-over-year while wholesale grew +27.5% to CHF 1,753.4M. DTC's share of the business rose about 120 basis points in a single year.
Notice what the chart does not say. Wholesale is still the larger channel at 58.2% of sales. On is not a DTC-only brand, and it has not tried to be. It runs a hybrid: wholesale gives it shelf space and reach, DTC gives it margin and customer data. The reason the mix matters for the P&L is that DTC sales carry a higher gross margin than wholesale, because there is no retailer taking a cut. As the DTC share creeps up, the blended gross margin creeps up with it. That is a chunk of the 60.6% to 62.8% move in one year.
The pattern we see again and again is operators treating DTC and wholesale as a religious war, all-in on one or the other. On's filings argue for the boring answer: run both, and let DTC mix do the quiet work on your margin line. A brand that pushes its full-price DTC share from 30% to 40% over two years can lift blended gross margin by several points without touching its price list.
| Segment | FY2024 (CHF m) | FY2025 (CHF m) | YoY growth |
|---|---|---|---|
| DTC | 942.8 | 1,260.5 | +33.7% |
| Wholesale | 1,375.5 | 1,753.4 | +27.5% |
| Americas | 1,480.2 | 1,740.1 | +17.6% |
| EMEA | 577.2 | 762.7 | +32.0% |
| APAC | 260.9 | 511.1 | +96.4% |
The regional rows are worth a glance too. The Americas fell from 63.8% to 57.7% of sales as APAC nearly doubled to 17.0%. Growth is increasingly happening outside the US, which matters for the tariff question we get to below.
Know the most you can pay to acquire a customer.
Get our Max CAC calculator: set your unit economics, get your ceiling.
Check your inbox. We'll send the Maximum CAC calculator shortly.
How On spends: marketing held near 10% of revenue while scaling to CHF 3B
This is the section that should make a DTC operator sit up. On spent CHF 305.4M on marketing in FY2025, which is about 10.1% of net sales. The year before it was CHF 276.6M, about 11.9%. So as the business scaled by 30%, the marketing line stayed roughly flat as a percentage of revenue and actually came down a point.
That is the opposite of the growth-at-any-CAC playbook that defined the 2020-2021 DTC era. On is buying CHF 3B of demand on a roughly 10-point marketing line. It is not spending its way to growth; the brand and the product are doing the heavy lifting, and paid is a support layer rather than the engine.
The bigger story underneath is how the operating margin built itself. Gross profit grew faster than total SG&A, so the widening gap fell to the operating line. Operating profit nearly doubled to CHF 377.0M, a 12.5% operating margin, up from a negative position in 2020-2021. That is the textbook shape of a business earning its scale: hold opex growth below gross-profit growth and the operating margin expands on its own.
| Metric (CHF m) | FY2023 | FY2024 | FY2025 |
|---|---|---|---|
| Net sales | 1,792.1 | 2,318.3 | 3,014.0 |
| Gross profit | 1,067.2 | 1,405.7 | 1,893.6 |
| Gross margin | 59.5% | 60.6% | 62.8% |
| SG&A | 887.0 | 1,194.2 | 1,516.6 |
| Operating profit | 180.2 | 211.6 | 377.0 |
| Operating margin | 10.1% | 9.1% | 12.5% |
| Net income (to owners) | 79.6 | 242.3 | 203.7 |
One wrinkle a careful read has to flag: net income to owners fell from CHF 242.3M in FY2024 to CHF 203.7M in FY2025, even though operating profit rose sharply. That drop is below the operating line, driven by foreign-exchange and tax items, not by the operating business getting worse. If you only looked at the bottom line you would think On had a down year. It did not. This is exactly why a diligence read works up from gross margin and operating profit rather than starting at net income, which is the noisiest line on the statement.
On's filings make one argument louder than any other: discipline compounds. A 62.8% gross margin, marketing held near 10% of revenue, and SG&A growing slower than gross profit are three separate decisions that stack into a 12.5% operating margin. None of them is a growth hack. All of them are copyable at a smaller scale.
The balance sheet a CFO would actually like: cash, no debt, but watch inventory
Diligence ends at the balance sheet, and On's is a fortress. It holds CHF 1,019.9M in cash against CHF 1,632.4M of equity and carries effectively no net debt. Operating cash flow was CHF 359.5M, and after CHF 72.9M of capex, free cash flow was about CHF 286.6M, a roughly 9.5% free-cash-flow margin. A business that throws off this much cash does not need outside money to grow, which is the strongest position a consumer brand can be in.
| Metric (CHF m) | FY2023 | FY2024 | FY2025 |
|---|---|---|---|
| Cash and equivalents | 494.6 | 924.3 | 1,019.9 |
| Inventory | 356.5 | 419.2 | 419.8 |
| Total equity | 1,074.5 | 1,391.8 | 1,632.4 |
| Operating cash flow | 232.1 | 510.6 | 359.5 |
| Capex (PP&E) | 42.8 | 60.5 | 72.9 |
| Free cash flow (OCF minus capex) | 189.3 | 450.1 | 286.6 |
Now the one yellow flag. On's FY2025 inventory of CHF 419.8M against COGS of about CHF 1,120.4M (net sales minus gross profit) works out to roughly 137 inventory days. On its own, that is normal-to-slightly-high for premium footwear, which carries long production lead times and has to commit to factory runs months ahead of demand. It is not evidence that On is over-inventoried.
It becomes a line to watch because of what sits on top of it. On's production is concentrated in Vietnam and Indonesia, and the Americas are still 57.7% of sales, so a 2026 US tariff on those origins lands squarely in cost of goods. Carry 137 days of inventory through a tariff change and you are holding goods that cost more to land than the ones already on the shelf, with no quick way to reprice. That is the working-capital stress test a CFO would run first: model a tariff shock against the inventory On is already committed to, and see what it does to the gross-margin line that makes the whole business work.
When we have struggled with this on operator calls, the trap is always the same: inventory days look fine in a stable year and turn into a cash trap the moment demand or cost moves against you. The number to watch is the days multiplied by the size of the shock you are exposed to.
What this means for your brand: you are not On, read it as a benchmark
The point of a teardown is not to copy On. You will not hit a 62.8% gross margin, and you do not have CHF 1B of cash to absorb a bad year. The point is to use a public company's audited statements as a benchmark sheet and find the gaps in your own P&L. Four lines are worth pulling onto your model this week.
First, gross margin. On's 62.8% is the ceiling for premium footwear, but the principle travels: protect price, push full-price DTC mix, and treat every point of discount as a permanent margin decision rather than a temporary promo. When I talk to founders this size, the ones who hold the line on price are the ones who still have room to maneuver two years later.
Second, marketing as a percentage of revenue. On runs near 10%. If yours is at 25% or 30% and not falling as you scale, you do not have a brand engine yet, you have a paid-media dependency, and that is a structural risk a fractional CFO will flag before your board does.
Third, the DTC versus wholesale tradeoff. You do not have to pick a side. On runs both and lets DTC mix do the quiet margin work. Model what a 10-point shift toward full-price DTC does to your blended gross margin before you make it a strategy fight.
Fourth, inventory days against your real exposure. Pull your inventory days, then multiply the risk by your sourcing concentration and your tariff or demand exposure. That single stress test is the most useful thing in this entire teardown, and it is the one most brands skip until the cash is already trapped.
Sources and methodology
On Holding AG (NYSE: ONON), CIK 0001858985, reports to the SEC as a foreign private issuer. Its annual report is a Form 20-F under IFRS, denominated in Swiss francs, not US GAAP in dollars. The us-gaap structured-statement extractor returns empty for ONON, so all figures were pulled via the ifrs-full XBRL taxonomy by tag. The primary filing is the FY2025 20-F, accession 0001858985-26-000008, filed 2026-03-03 with a report date of 2025-12-31. Prior-year figures come from the FY2024 20-F (accession 0001858985-25-000003) and earlier filings.
The income-statement tags used were RevenueFromContractsWithCustomers (net sales), GrossProfit, SellingGeneralAndAdministrativeExpense (with components DistributionCosts and SellingExpense), ProfitLossFromOperatingActivities (operating profit), and ProfitLossAttributableToOwnersOfParent (net income to owners). Marketing expense (CHF 305.4M in FY2025, CHF 276.6M in FY2024) is a company-defined SG&A subcategory rather than a standard XBRL tag, sourced from the 20-F SG&A note. Marketing as a percentage of revenue is computed against reported net sales.
Balance-sheet and cash-flow figures use Inventories, CashAndCashEquivalents, Equity, CashFlowsFromUsedInOperatingActivities, and PurchaseOfPropertyPlantAndEquipmentClassifiedAsInvestingActivities. Channel (DTC and wholesale) and regional splits are MD&A disclosures rather than financial-statement XBRL, sourced from On's FY2025 results release and cross-checked against the 20-F. FY2024 regional figures are backed out from FY2025 values and disclosed growth rates and should be treated as tight approximations.
The peer comparison uses Nike's FY2025 10-K (year ended 2025-05-31, accession 0000320187-25-000047): revenue of $46,309M and gross profit of $19,790M, a 42.7% gross margin in USD. We kept it to one peer we could confirm from a primary filing.
Several figures here are computed, not reported, and are flagged as such throughout. Gross and operating margins are profit divided by net sales. Free cash flow is operating cash flow minus PP&E capex; it does not deduct lease principal or intangibles capex. Inventory days are FY2025 inventory of CHF 419.8M divided by COGS of about CHF 1,120.4M, times 365, which yields roughly 137 days, where COGS equals net sales minus gross profit.
A currency note: every figure is kept in Swiss francs, as reported, and not converted to dollars. CHF and USD have hovered near parity, so the franc reads as a rough one-to-one stand-in.
For the operator-grade version of this read applied to your own statements, see our interim CFO services. For more athletic and DTC footwear teardowns, see our Allbirds teardown and the footwear financial benchmark.
Frequently asked questions
what is on holding's gross margin and how does it compare to nike?
On Holding's FY2025 gross margin was 62.8% (gross profit CHF 1,893.6M on net sales of CHF 3,014.0M). That is about 20 points above Nike's FY2025 gross margin of 42.7%. The gap comes from a premium price point and a high direct-to-consumer mix, not from cheaper sourcing.
how much does on running spend on marketing as a percentage of revenue?
About 10.1% of net sales. FY2025 marketing expense was CHF 305.4M against CHF 3,014.0M in net sales, roughly flat to the prior year's 11.9%. On held marketing near 10% of revenue while scaling to CHF 3B, which is unusually disciplined for a fast-growing consumer brand.
is on holding's dtc channel actually growing faster than wholesale?
Yes, but wholesale is still the bigger channel. DTC grew +33.7% to CHF 1,260.5M in FY2025 while wholesale grew +27.5% to CHF 1,753.4M. DTC's share rose to 41.8%, up about 120 basis points in a year. The mix is shifting toward DTC, not flipping.
how exposed is on holding to us tariffs on vietnam and indonesia made shoes?
Materially exposed. On's production is concentrated in Vietnam and Indonesia, so a 2026 US tariff on those origins hits its largest market (the Americas are 57.7% of sales). The financial line to watch is gross margin, because tariffs land in cost of goods unless On raises prices or shifts sourcing.
does on holding convert its profit into actual free cash flow?
Yes. FY2025 operating cash flow was CHF 359.5M and capex was CHF 72.9M, so free cash flow was about CHF 286.6M, a roughly 9.5% free-cash-flow margin. On holds CHF 1,019.9M in cash with effectively no net debt, so it funds its own growth.
how many inventory days does on running carry and is that high?
Around 137 days of COGS (FY2025 inventory of CHF 419.8M against COGS of about CHF 1,120.4M). That is normal-to-slightly-high for premium footwear, which carries long production lead times. It only becomes a real risk because of the tariff and demand exposure stacked on top of it.
how did on go from losing money to a 12% operating margin?
Gross profit grew faster than SG&A, so the widening gap dropped to the operating line. Operating profit nearly doubled to CHF 377.0M in FY2025 (a 12.5% operating margin) from a negative position in 2020-2021. The driver was margin and spending discipline, not a one-time cut.
why does on report in swiss francs instead of dollars?
On Holding AG is a Swiss company and files with the SEC as a foreign private issuer, so its annual report is a Form 20-F under IFRS, denominated in Swiss francs. Do not mentally convert the figures to USD line by line. CHF and USD have hovered near parity, so the franc is a rough one-to-one stand-in, but the filing is in CHF.
what can a $10m-50m dtc brand actually copy from on's financials?
Three things: hold marketing near a fixed percentage of revenue instead of chasing growth at any CAC, push full-price DTC mix to protect gross margin, and grow SG&A slower than gross profit so the operating margin widens on its own. You will not hit 63% gross margin, but the discipline behind it is copyable at any size.