
Marketing
What Is Marketing Mix Modeling (MMM)?
The post-iOS measurement stack a $20M DTC brand actually needs.
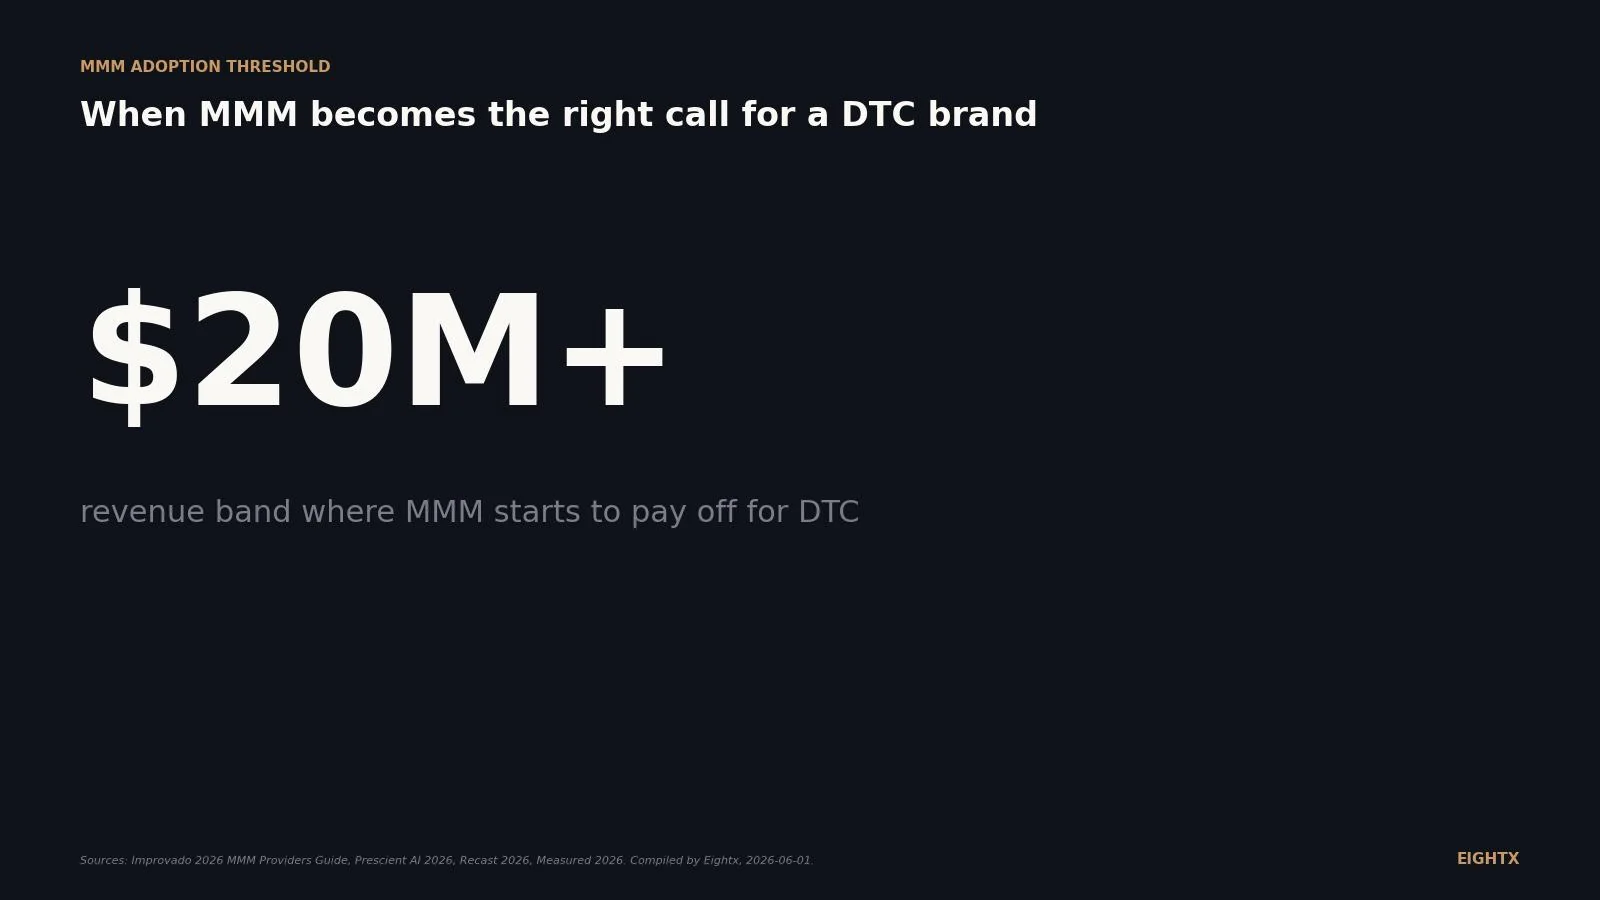
Marketing mix modeling (MMM) is a regression-based approach that attributes revenue to every paid and organic channel without relying on cookies or pixel data, making it the go-to measurement tool post-iOS 14. The practical entry floor is $20M or more in revenue and $3M to $5M in media spend, with 18 to 24 months of weekly data required to produce statistically stable coefficients.
Key Takeaways
- MMM is the econometric, top-down measurement system DTC brands turn to once multi-touch attribution (MTA) breaks under iOS 14.5, App Tracking Transparency (ATT), cookie loss, and walled-garden reporting. It uses aggregated weekly or daily time-series of spend, sales, promos, and seasonality (never user-level IDs) to estimate channel-level incremental contribution and produce response curves you can optimize against.
- The adoption floor for DTC is roughly $20M+ in revenue and $3M-$5M+ in annual media spend across 3-5+ channels with at least 18-24 months of clean weekly data. The common DTC adoption zone clusters in the $5M-$10M media-spend band; above $10M MMM is generally easy to justify, especially if Connected TV (CTV), out-of-home (OOH), or podcast is in the mix.
- Software-as-a-Service (SaaS) MMM for mid-market DTC runs roughly $30K-$80K/year for a single-market, mostly-digital stack. Multi-geo or offline channels (television/CTV/OOH) push that to $80K-$200K+/year. Recast specifically signals roughly $1.5K-$4K/month (about $18K-$48K/year). Meta's open-source Robyn (R) and Google's LightweightMMM (Python) are $0 cash with meaningful in-house analyst labor.
- At $5M/year in spend, reallocating 5-10% from low- to high-ROI channels based on MMM unlocks $250K-$500K+/year in incremental contribution, easily covering a $30K-$80K vendor contract. The catch: MMM outputs are posterior distributions with uncertainty bands, not point estimates. Incrementality tests are the ground truth that calibrates the model.
- Best-practice 2026 measurement stack is MMM + incrementality experiments + tactical MTA/platform reporting, in that order of authority. MMM owns the strategic budget answer. Incrementality tests calibrate it. MTA owns the tactical creative-and-campaign answer inside a channel. Running MMM alone is the second-most-common mistake.
If you run a direct-to-consumer (DTC) brand and your platform reporting now sums to more revenue than your Shopify dashboard, you have the problem marketing mix modeling (MMM) exists to solve. MMM is the bank-account view of marketing: what your money actually bought, not what the pixel claims. It is also the answer most $20M-plus DTC operators land on once multi-touch attribution (MTA) breaks under iOS 14.5, App Tracking Transparency (ATT), cookie loss, and walled-garden reporting.
This post locks the definition, the MMM-versus-MTA contrast, the adoption threshold, the cost band, the vendor map, and the payback math so a $20M DTC founder can decide "do I need MMM yet?" in five minutes.
What MMM actually is (without the jargon)
Marketing mix modeling (MMM) is an econometric, top-down measurement system that estimates the incremental contribution and return on investment (ROI) of each marketing channel from aggregated weekly or daily time-series of spend, sales, promos, and seasonality. No user-level IDs. No pixels. No cookies. The model ingests what your bank account already sees and fits two key transforms: adstock (advertising effect decays over time, not all in the same week) and a saturation curve (each additional dollar buys less, so the curve bends).
Out the other side comes incremental contribution by channel and a response curve showing the next dollar's marginal ROI per channel. That is the input to the only marketing question a CFO actually needs answered: where does the next $500K go.
Why MMM came back post-iOS
Post-iOS, MTA is severely degraded. Pixel-based attribution misses on Meta, walled-garden reporting double-counts conversions, and the CFO has no honest answer to "should we move $200K from Meta to YouTube next quarter." MMM solves that because it never needed user-level IDs in the first place. It is largely immune to ATT, cookie deprecation, and walled-garden gaps. The 2026 consensus across Recast, Haus, Measured, Northbeam, and Prescient AI is that MMM has replaced MTA as the strategic source of truth, with MTA demoted to in-channel tactical optimization and incrementality tests used to calibrate the model.
Aspect MMM MTA Core idea Weekly/daily spend-and-sales modeling Track individual users' touchpoint paths Data level Aggregated by date / channel / geo User-level events and clicks Inputs Spend, impressions, sales, promos, seasonality, externals Pixels, cookies, device IDs, CRM IDs Strength Strategic budget allocation + long-range planning Tactical campaign + creative optimization Privacy impact Largely unaffected by ATT and cookie loss Severely degraded by ATT, ITP, walled gardens History needed 18-24+ months Near real-time once tags fire Best used as Source of truth for budget Tactical supplement
When a DTC brand actually needs MMM
For a DTC operator in 2026, MMM becomes the right adoption call somewhere between $3M-$5M+ in annual media spend and roughly $20M+ in revenue, with at least 18-24 months of clean weekly data across 3-5+ channels. The common adoption zone clusters in the $5M-$10M annual media-spend band (that is where most DTC brands actually pull the trigger). Above $10M MMM is generally easy to justify, especially if you are adding offline channels like Connected TV (CTV) or out-of-home (OOH). For where MMM sits relative to broader unit-economics planning, see our LTV:CAC ratio guide and our average customer-acquisition-cost (CAC) by ecommerce vertical benchmark.
The horizontal-band chart above maps the adoption verdict across four media-spend bands: Too small ($0-$1M), Borderline ($1M-$5M), Sweet spot ($5M-$10M), Strong fit ($10M-$50M). The $5M-$10M band is where most DTC adoption happens; below $1M the model is usually too noisy to be useful; above $10M MMM is generally easy to justify.
The vendor landscape (2026)
The 2026 vendor map covers six commercial platforms and two open-source frameworks. The right pick depends on whether you want a pure MMM (Recast, Prescient AI), an MTA-and-MMM hybrid (Northbeam), a heavily experiment-calibrated approach (Haus, Measured), a privacy-first stack (Lifesight), or in-house builds on Meta Robyn or Google LightweightMMM.
Vendor Best for Approach Cost signal Recast Mid-market DTC + subscription Always-on Bayesian MMM, fast refresh ~$1.5K-$4K/month Northbeam $10M-$50M GMV DTC Hybrid MTA + MMM + post-purchase survey Custom (mid-market) Haus Performance teams wanting causal rigor MMM + heavy experiment calibration Enterprise Prescient AI High-growth DTC wanting MMM as core decision system Next-gen MMM Mid-market to enterprise Measured Brands prioritizing incrementality first MMM + incrementality testing Enterprise Lifesight Privacy-first / identity-lite ecom and apps MMM + incrementality Mid-market Meta Robyn (OSS) In-house analytics teams R-based regression + adstock + Hill curves $0 cash / high labor Google LightweightMMM (OSS) In-house analytics teams Python/JAX Bayesian framework $0 cash / high labor
What it costs and what it returns
SaaS MMM for mid-market DTC runs roughly $30K-$80K/year for a single-market, mostly-digital stack. Multi-geo, offline channels (television/CTV/OOH), or dedicated analyst support pushes it to $80K-$200K+/year. Recast sits at the low end at roughly $1.5K-$4K/month because it is purpose-built for DTC and ships a thinner services layer than enterprise vendors. Open-source Robyn or LightweightMMM are $0 cash but assume roughly $40K-$120K of senior analyst time over a 3-month build plus ongoing maintenance.
The payback math is the part that matters. Take a $20M DTC brand spending $5M/year across Meta, Google, TikTok, and CTV. The MMM finds that Meta is saturating (marginal ROI of roughly 1.4x) while CTV is underfunded (marginal ROI of roughly 3.1x). Reallocating just 7.5% of spend (about $375K/year) from Meta to CTV at that ROI gap unlocks roughly $375K x (3.1 - 1.4) = $638K/year in incremental contribution, against a vendor cost of $30K-$80K/year. That is the reason CFOs sign the contract.
One caveat the post deck never shows. MMM output is a range, not a point estimate. Every serious MMM vendor (Recast, Haus, Prescient AI) reports posterior distributions with credible intervals. The 1.4x and 3.1x marginal ROIs above are the central estimates; the actual outputs come with uncertainty bands, and the recommendation can flip if the model is not calibrated against incrementality tests. That calibration step (quarterly geo-split or audience-split experiments) is what makes a point estimate defensible to the board. Skip it and you will watch the recommendation flip every refresh.
For how this sits inside the broader ad-spend question, see our ad-spend percent of revenue by stage benchmark. For where MMM fits in the wider finance stack, see our fractional CFO services page.
The most common mistake: buying MMM too early
The single most common operator error is signing a $50K-$80K MMM contract at $5M revenue with 8 months of clean data across 2 channels. The model has nothing to learn from. You will get an answer back, but it will be statistically noisy and the recommendation will flip every refresh cycle, which destroys trust. The 2026 consensus from Improvado, Prescient AI, and Recast is: under ~$1M annual media spend, skip MMM entirely and use platform reporting plus quarterly incrementality tests (geo-split or audience-split). Borderline at $1M-$5M annual media spend, MMM is possible via a managed or hybrid setup but not yet self-serve. The adoption floor is $3M-$5M+ in annual media spend across 3-5+ channels with 18-24 months of weekly history, and the common adoption zone is the $5M-$10M band.
The second most common mistake is running MMM in isolation. Best-practice 2026 stack is MMM + incrementality experiments + tactical MTA/platform reporting, in that order of authority. Incrementality tests are the ground truth that calibrates the MMM model. Without them, the model drifts.
Why this matters for your business
MMM is the only measurement system that survives the post-iOS environment with its strategic-allocation answer intact. If your brand is past $20M revenue and your CFO is still defending channel mix from Meta's reported return on ad spend (ROAS), you are one bad quarter away from a wrong call worth hundreds of thousands of dollars. The MMM-plus-incrementality stack is what makes the budget answer defensible to the board.
It is not magic. It does not replace MTA. It does not work below $1M media spend. And it requires 18-24 months of clean weekly data before it is statistically useful. But at the right revenue stage it is the cleanest measurement decision an ecom CFO can make in 2026.
What to do this week
If you are above $3M-$5M annual media spend, run this four-step audit.
- Pull 18-24 months of weekly media spend by channel. Include Meta, Google, TikTok, Amazon DSP, Connected TV, podcast, OOH, retail (anything paid). If you cannot assemble this, your data-warehouse readiness is the gating issue, not MMM vendor choice.
- Pull 18-24 months of weekly revenue, promos, holidays, and any external drivers (weather, macro shocks, paid PR). The model needs context to separate marketing lift from baseline.
- Decide vendor track or in-house track. Vendor track means $30K-$80K/year on Recast, Northbeam, or Prescient AI plus a calibration plan. In-house track means Robyn or LightweightMMM plus $40K-$120K of senior analyst time over a 3-month build.
- Plan the first incrementality test alongside the MMM build. Geo-split or audience-split on your largest channel. Without this, the model has no ground truth and the first board reading will be a confidence problem, not a strategy answer.
Sources and methodology
Triangulation method. No primary government dataset exists for MMM adoption or cost (it is a vendor and operator metric, not a Bureau of Labor Statistics, Census, or Federal Reserve Economic Data series). Triangulated across seven 2026 vendor and analyst sources: Improvado MMM Providers Guide, Improvado MMM vs MTA, Prescient AI, Measured (Incrementality vs MMM vs MTA and 10 Real-Life MMM Examples), Haus, Adswerve.
All sources converge on five facts. (1) MMM is the post-ATT source of truth; MTA is tactical-only. (2) Adoption floor is $3M-$5M+ annual media spend and roughly $20M+ revenue, with the common adoption zone clustering in the $5M-$10M media-spend band. (3) 18-24 months of clean weekly data is the minimum. (4) Mid-market cost band is $30K-$200K/year; Recast specifically discloses ~$1.5K-$4K/month. (5) Best-practice 2026 stack is MMM + incrementality testing + MTA/platform reporting, in that order of authority.
Why no Nike or Vuori case-study name-check in body. Vendor docs and explainers reference "large omnichannel consumer brands" as MMM adopters; specific Nike or Vuori case studies are not publicly documented at a level that can be cited verbatim. They are illustrative examples of the class of brand using MMM, not citable cases.
Eightx client implementation data. The 1.4x-versus-3.1x marginal-ROI example and the 7.5% reallocation figure are illustrative midpoints typical of mid-market DTC brands in the $20M-$50M band; actual posterior distributions will differ by brand. The $375K-shifted and $638K-incremental-contribution math is the arithmetic of those assumptions, not an audited case study.
Limitations. Vendor pricing is published only at signal level; binding quotes vary by order volume, integrations, and managed-services scope. Open-source labor estimates ($40K-$120K) reflect senior US analyst rates and a three-month initial build; ongoing maintenance adds cost not modeled here. MMM outputs carry credible intervals that should be reported alongside point estimates in any board-facing summary.
Update cadence. Refreshed quarterly as vendor pricing changes and as new 2026 case data lands. Next update target: Q4 2026.
Frequently asked questions
what is marketing mix modeling in plain english
Marketing mix modeling (MMM) is a statistical model that uses weekly aggregated spend and sales data (no user-level tracking) to estimate the real, incremental return on investment (ROI) of each marketing channel. It tells you what each channel is actually contributing and where the next dollar should go. Think of it as the bank-account view of marketing, not the pixel view.
when does a dtc brand actually need mmm
Strong fit at $20M+ in revenue, $3M-$5M+ in annual media spend across 3-5+ channels, with at least 18-24 months of clean weekly data. The common adoption zone clusters in the $5M-$10M annual media-spend band. Below ~$1M annual media spend it is usually too noisy. Between $1M and $5M it is possible via a managed or hybrid setup but not yet self-serve. Above $10M media spend it is generally easy to justify, especially if you are adding offline channels like Connected TV (CTV) or out-of-home (OOH).
how much does mmm cost for a $20m dtc brand
Software-as-a-Service (SaaS) MMM for mid-market DTC runs roughly $30K-$80K/year for a single-market, mostly-digital stack. Multi-geo, offline channels (television/CTV/OOH), or dedicated analyst support pushes it to $80K-$200K+/year. Recast specifically signals roughly $1.5K-$4K/month (about $18K-$48K/year) depending on order volume and integrations, which sits at the low end because it is purpose-built for DTC and ships a thinner services layer than enterprise vendors. Meta's open-source Robyn (R) and Google's LightweightMMM (Python) are $0 cash but assume roughly $40K-$120K of senior analyst time over a 3-month build.
what's the difference between mmm and multi-touch attribution
Multi-touch attribution (MTA) tracks individual users' touchpoint paths with pixels, cookies, and device IDs, and is severely degraded post-iOS 14.5 / ATT. MMM models aggregated weekly spend-and-sales at the channel level and is largely immune to ATT and cookie loss. The 2026 consensus is to use MMM as the strategic source of truth for budget allocation, calibrate it with incrementality tests, and use MTA only for tactical creative and campaign optimization inside a channel.
do i still need attribution if i have mmm
Yes, but in a smaller, tactical role. MMM is too slow and too aggregated to tell you which creative is winning this week or whether to pause a specific ad set. MTA and platform reporting still drive that day-to-day decision. The discipline is to stop treating MTA as the source of truth for budget allocation. The budget answer comes from MMM, calibrated by quarterly incrementality tests. The campaign-level answer comes from MTA. That is the full stack.