
Insights
What is MRR and ARR for subscription ecommerce? The formula, the benchmark, and the three places it lies to you
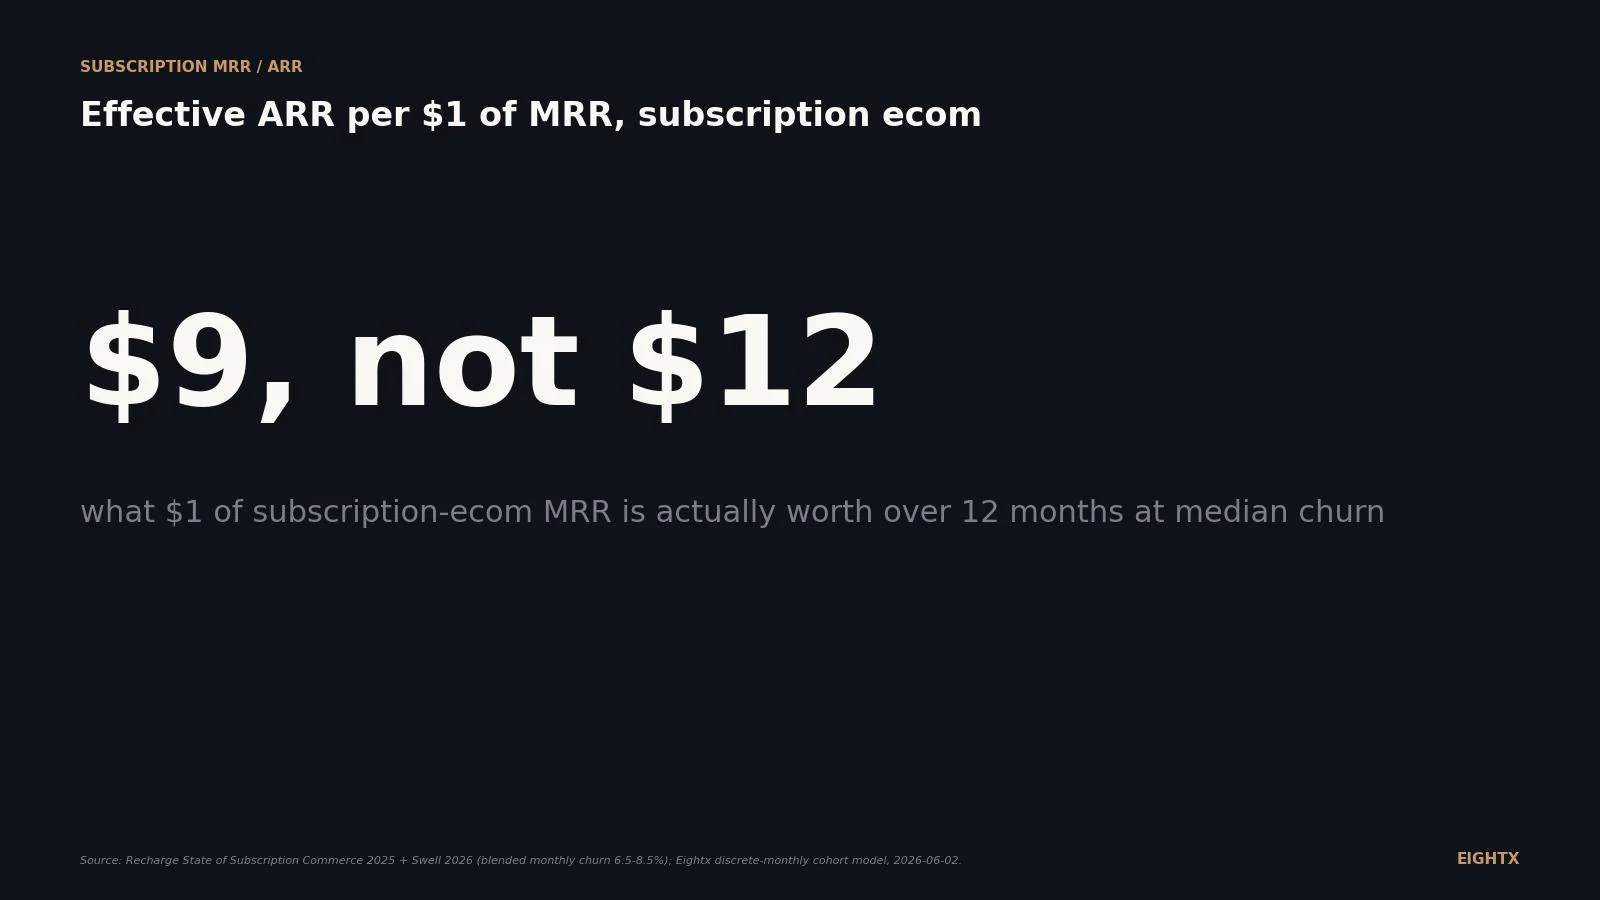
MRR times 12 overstates subscription ecommerce ARR by 30 to 40 percent at median churn. Blended monthly churn runs 6.5 to 8.5 percent for DTC subscription brands, so at 7 percent churn each dollar of MRR is worth roughly $7.72 over the next 12 months, not $12. Recharge tier-1 merchants average $56,096 MRR versus $316 at tier 3. Use effective ARR, not the naive formula, for board reporting.
Key Takeaways
- MRR (Monthly Recurring Revenue) and ARR (Annual Recurring Revenue) are SaaS metrics that translate badly to subscription ecom. The formulas are the same. The retention curve underneath them is not. Median monthly churn in subscription ecom is 6.5-8.5 percent (Swell 2026, Recharge State of Subscription Commerce 2025) vs roughly 3-5 percent for B2B SaaS.
- Naive ARR (MRR x 12) over-states next-12-months revenue by 30-40 percent for the median subscription brand. At 7 percent monthly churn, $1 of starting MRR generates about $7.72 of effective ARR over the next 12 months, not $12. At 10 percent monthly churn (discovery boxes) it generates about $6.46.
- Top-quartile subscription brands hold monthly churn under 3 percent. That is the only band where SaaS-style MRR x 12 is directionally honest. Below that band you need three numbers, not one: gross MRR, live MRR (net of pauses and skips), and trailing-90 MRR run-rate.
- Recharge tier-1 merchants average $56,096 MRR. Tier-2 average $1,271. Tier-3 average $316. That is a 178x spread between the top and bottom of the platform, and it tells you the realistic upper bound when you benchmark your own MRR against what a public subscription number looks like.
- For ARPA under $10 (most subscription boxes) expansion is only about 7.9 percent of MRR movement. SaaS expansion is 36-43 percent. Subscription-ecom MRR growth is new subs minus churn, not seat expansion. Plan growth accordingly.
If you run a subscription DTC brand at $1M to $50M in MRR-equivalent revenue and you have ever pitched ARR (Annual Recurring Revenue) to an investor or a board, you have probably told a slightly untrue story. Not on purpose. SaaS metrics translate badly to subscription ecom because the retention curve underneath them is different. SaaS MRR (Monthly Recurring Revenue) leaks at 3-5 percent a month and grows through expansion. Subscription-ecom MRR leaks at 6.5-8.5 percent a month and barely expands. That gap is why MRR x 12 over-states the next 12 months of cash by 30-40 percent for the median subscription brand. This post defines MRR and ARR cleanly for subscription ecom, gives the operator-grade formulas (gross MRR, live MRR, trailing-90 MRR, effective ARR), benchmarks where your MRR sits on the Recharge tier curve, and tells you which of the three MRR numbers to actually use for board reporting versus cash planning.
MRR and ARR, defined for subscription ecom
MRR is the sum of all active subscribers' monthly billed amount. Formula: sum across active subscriptions of (monthly price). If you have 4,000 subscribers paying $30 per month and 1,200 paying $50, gross MRR is $180,000.
ARR is the annualised run-rate of recurring revenue. The naive SaaS formula is MRR x 12. For subscription ecom this number is misleading by 30-40 percent at median churn, so we use it as a directional metric only and pair it with effective ARR (the cohort-decay version) for any cash or board number.
Live MRR (sometimes called active MRR or net MRR) is gross MRR minus the share that is paused, skipped, or otherwise non-billable this period. Live MRR is the version that survives a board question. Gross MRR is the version your subscription app displays by default.
Net Revenue Retention (NRR) is the percent of a starting cohort's MRR retained 12 months later, including expansion. SaaS NRR over 100 percent is common (expansion exceeds churn). Subscription-ecom NRR realistic band is 75-95 percent (Recharge 2025 SoSC). Top-bottom NRR gap on the platform is 34 percentage points, wider than SaaS.
Metric Subscription-ecom definition Formula How it differs from SaaS MRR (gross) Sum of all active subscribers' monthly billed amount sum(active_subs monthly_price) Same formula as SaaS, more volatile denominator MRR (live / net of pauses) MRR from subscribers actually billable this month gross_MRR - paused_MRR - skipped_MRR Specific to subscription ecom (skip and pause flows) ARR (naive) Annualised run-rate of recurring revenue MRR 12 Over-states 12-month revenue by 30-40 percent Effective ARR Sum of next 12 months expected MRR given churn sum((1-churn)^n * MRR) for n=1..12 More honest for subscription ecom planning Net Revenue Retention Percent of MRR retained from a cohort 12 months later, including expansion cohort_MRR_at_t12 / cohort_MRR_at_t0 Subscription ecom band 75-95 percent vs SaaS 100-130 percent
The MRR x 12 trap: why subscription ARR lies
The naive ARR formula assumes nothing about retention. If you have $100,000 of MRR today, MRR x 12 says next-12-months revenue is $1.2M. That number is only honest if your retention curve is flat. Subscription-ecom retention curves are not flat.
Blended monthly churn for subscription ecom averages 6.5-8.5 percent (Swell 2026, Recharge 2025), which means 56-65 percent of today's subscriber cohort is gone within 12 months. Replenishment categories (coffee, supplements, pet food) sit at 4-7 percent. Discovery boxes (apparel, beauty, snacks) sit at 10-18 percent. The chart below puts those bands next to the 3-5 percent B2B SaaS band so you can see the structural gap.
The cohort decays. So does next-12-months revenue. If you take $100,000 of starting MRR and run a 7 percent monthly churn, month 12 MRR is $41,860 and the total revenue you collect over the 12 months is roughly $772,000, not $1.2M. That is a 36 percent gap.
We modelled this gap across the full 1-15 percent monthly churn range. The line chart below plots effective ARR per $1 of starting MRR against the naive MRR x 12 line. Read it as a discount factor: at 5 percent monthly churn the discount is roughly 27 percent; at 8 percent it is roughly 39 percent; at 12 percent it is roughly 52 percent.
The takeaway for any brand outside the top quartile (sub-3 percent monthly churn): MRR x 12 is the wrong number to pitch and the wrong number to plan against. Use effective ARR or trailing-90 MRR run-rate. See our subscription churn benchmark by category for the bands underneath this curve.
Gross MRR vs live MRR vs trailing-90 MRR: which one to use
You have three usable versions of MRR. Each is right for one decision and wrong for another.
Gross MRR is the headline number your subscription app (Recharge, Bold, Loop) displays. It counts every active subscription regardless of pause or skip state. Useful for top-of-funnel growth tracking and for matching the number a vendor reports. Misleading for cash and board reporting because it ignores the share of MRR that is not actually billable this period.
Live MRR is gross MRR minus paused and skipped subscriptions for the current month. This is the number that survives a board question. It is also the number that drops by 4-8 percent in any month a brand runs a "skip a month free" promotion, which is exactly why it matters: the promotion has a real revenue cost and live MRR shows it.
Trailing-90 MRR run-rate is the rolling 90-day average of billed recurring revenue, annualised. This is the number to use for cash planning because it smooths out month-to-month pause and skip noise and captures the actual cash-generating velocity of the subscriber base. For a brand that runs aggressive promotional cycles, trailing-90 is the only honest forward-cash number.
Rule of thumb: report gross MRR to your vendor, live MRR to your board, trailing-90 MRR to your bank or lender. Never use any of these three as ARR x 12 without applying the effective-ARR discount. For the inputs to all three, lean on the subscription box financial metrics reference.
Benchmarks: where your MRR sits on the Recharge tier curve
The Recharge 2025 State of Subscription Commerce splits its merchant base into three tiers by MRR. Tier-1 merchants average $56,096 MRR. Tier-2 merchants average $1,271. Tier-3 merchants average $316. That is a 178x spread between the top and bottom tier, and it tells you most of what you need to know about realistic peer comps.
If you are running $5,000 to $15,000 in MRR you are mid-tier-2, well above platform median. If you are at $20,000-plus you are approaching tier-1. The honest comp is your own category at your own tier, not the top-quartile headline number. Recharge does not publish category-level MRR averages publicly, so for category benchmarks lean on the subscription churn rate by category and LTV subscription vs one-time reads.
One more benchmark worth holding: subscription merchants saw 12 percent YoY LTV growth, 11 percent AOV growth, and 7 percent MRR growth in the most recent reported cohort year (Recharge SoSC 2025). Subscriber count is growing slower than basket size. MRR growth is being carried by price and AOV, not raw subscriber adds. That is a structural feature of the 2026 subscription market, not a brand-execution issue.
The six MRR movement buckets, applied to subscription ecom
ChartMogul's six MRR movement buckets apply cleanly to subscription ecom, but the proportions are different from SaaS. The buckets are New, Expansion, Contraction, Churn, Reactivation, and Neutral. For a subscription-ecom brand the rough share of monthly delta breaks like this.
Movement SaaS meaning Subscription-ecom meaning Typical share of monthly delta New New subscription started New subscriber's first billing 40-60% Expansion Upgrade or seat add Frequency increase, add-on product, tier upgrade 5-15% Contraction Downgrade Frequency decrease, smaller box, discount applied 10-20% Churn Full cancellation Full cancellation 20-35% Reactivation Cancelled customer returns Cancelled subscriber resubscribes (high in beauty, supplements) 5-15% Neutral Plan change with no MRR change Variant swap, address change, billing-date move Variable; track separately
The expansion bucket is the structural difference. In B2B SaaS, expansion is 36-43 percent of MRR movement for products with ARPA over $50. In subscription ecom with ARPA under $10 (most boxes) expansion is roughly 7.9 percent. There is no seat-based upgrade lever; there is only frequency or tier or add-on, and most subscribers do not move.
The lever subscription operators underuse is reactivation. Cancelled subscribers come back at non-trivial rates in beauty, supplements, and pet food. Building a "win-back" sequence into your subscription stack adds 5-15 percent to monthly MRR movement. See the Recharge vs Bold vs Loop comparison for which platform supports reactivation flows cleanly.
The three numbers we would actually report at a board
If you ask us what we would put on a board slide for a $5M to $50M subscription brand, it is not a single MRR or ARR number. It is three:
Live MRR (end of month). The current-period billable-revenue number, net of pauses and skips. This is the operating metric. If your CFO and your board are looking at the same MRR number, this is the one.
Trailing-90 MRR run-rate. The 90-day rolling average annualised. This is the cash-planning metric. Banks, lenders, and any forward cash forecast use this number because it smooths the noise that gross or live MRR carries month to month.
12-month forward revenue (effective ARR). Run the cohort-decay model on your real churn rate. For most subscription brands this number is 30-45 percent lower than MRR x 12, and it is the only honest answer to the "what is your ARR" question.
We would not pitch "ARR" to a subscription-ecom investor in 2026 without specifying which of these three numbers we mean. The terminology is borrowed from SaaS and it carries SaaS assumptions about retention that do not hold. If you are talking to a sophisticated investor, lead with live MRR and effective ARR and skip the SaaS vocabulary. For the audience question on this, our what is net revenue retention DTC post has the longer read.
The single number that separates a subscription brand from a SaaS brand is monthly churn. SaaS at 3 percent and subscription ecom at 7 percent look similar on a one-month chart and look completely different on a 12-month cash forecast. That gap is what makes MRR x 12 the wrong ARR formula and live MRR plus trailing-90 plus effective ARR the right one.
Sources and methodology
Recharge State of Subscription Commerce 2025. Primary source for tier-1, tier-2, tier-3 merchant MRR averages, NRR gap, top-quartile churn band, and retention investment data. Public report, no login wall. The tier definitions are Recharge-platform-specific; your brand's tier on Shopify with another subscription app may differ. We treat the Recharge averages as directional, not absolute, when benchmarking outside Recharge.
Swell 2026 Subscription Commerce Statistics. Primary source for blended monthly churn (6.5-8.5 percent), 6-month retention (45 percent), 12-month retention (33 percent), and the impact of skip / pause / swap flows on churn (15-30 percent reduction). Swell's churn numbers are population-level across its merchant set; cohort-level churn at an individual brand can differ materially.
ChartMogul MRR movements benchmarks. Primary source for the six MRR movement buckets and the expansion share by ARPA band. ChartMogul's published benchmarks are dominated by SaaS, so we use them as the structural reference for movement buckets and apply our own subscription-ecom proportions (sourced from the Recharge platform and the Eightx founder-call segment library) for the share columns.
Eightx effective-ARR model. Discrete-monthly cohort decay. Effective ARR equals MRR times the sum of (1 minus monthly_churn) to the n for n equals 1 to 12. No new data; computed directly from the cited churn ranges. The model assumes constant monthly churn within the year, which is a simplification: real subscription brands show seasonality (Q4 retention is usually higher; January churn is usually higher).
Limitations. The Recharge averages are merchant-level, not cohort-level. We cannot reconstruct subscriber-cohort retention curves from the public report; the bands in Chart 1 use Swell 2026 plus SoSC headlines, not raw cohort data. ChartMogul's expansion percentages come from its SaaS-heavy benchmark set; we cite them as the structural comparison rather than as a subscription-ecom-specific stat. No primary SEC 10-K data exists for pure-play public subscription boxes large enough to triangulate against; BarkBox went private after the deSPAC drop, FIGS is not subscription, and Hims & Hers is telehealth-subscription, not box-subscription.
Update cadence. This is a living index. We refresh quarterly when Recharge or Swell publish updated subscription numbers, or sooner if the underlying churn distribution moves materially.
Frequently asked questions
what is mrr for a subscription box business?
MRR (Monthly Recurring Revenue) is the sum of all active subscribers' monthly billed amount. For a subscription box brand, it is the total revenue you would collect this month if every active subscription billed on schedule. The formula is the same as SaaS (sum of active subs times monthly price) but the denominator is more volatile because subscribers pause, skip, and cancel at 2-3x the rate SaaS users do.
is mrr x 12 the right way to calculate arr for a subscription box?
No. MRR x 12 (the naive ARR formula) assumes none of your subscribers churn. In subscription ecom, blended monthly churn runs 6.5-8.5 percent, so 56-65 percent of today's cohort is gone within 12 months. At 7 percent monthly churn, $1 of MRR is worth roughly $7.72 over the next 12 months, not $12. For board reporting, use effective ARR (sum of (1 minus churn) to the n for n equals 1 to 12, times MRR) instead.
what's a good monthly churn rate for a subscription ecommerce brand?
Under 5 percent if you are replenishment (coffee, supplements, pet food). Under 8 percent if you are a discovery box (apparel, beauty, snacks). Top-quartile subscription brands hold under 3 percent. Above 10 percent monthly churn, your subscription is more like a free trial with a billing event attached and you should be modelling it as such.
should i count paused subscribers in my mrr?
Not in live MRR. Count them in gross MRR. Live MRR (the number you take to a board and to a cash forecast) is gross MRR minus paused and skipped subscribers for the month. Gross MRR is the bigger, vendor-friendly number that Shopify subscription apps usually display by default. Investors and CFOs care about live MRR; the gross number flatters your story.
how do i handle skip-a-month in mrr calculations?
Skip-a-month subscribers do not bill this period, so they come out of live MRR for the month and back in next month. Treat them like a pause with a known unpause date. Brands that offer skip, pause, swap, and frequency adjustments churn 15-30 percent less than rigid ones (Swell 2026), so skip is a churn-reducer worth tracking as a separate line in your MRR movement waterfall.
Browse the full ecommerce finance glossary for every metric and money term a DTC operator needs.