
eCommerce
What is safety stock and reorder point? The two formulas that decide stockout vs trapped cash
Safety stock is the buffer inventory sized to absorb demand and lead-time variability. Reorder point is that buffer plus expected demand during lead time, and it is the level that triggers your next purchase order. The APICS combined-variability formula is the right tool for DTC brands sourcing from China on 35-day leads. Moving from a 95 to 99 percent service level on one hero SKU adds roughly $12,125 of frozen inventory at a $25 unit cost.
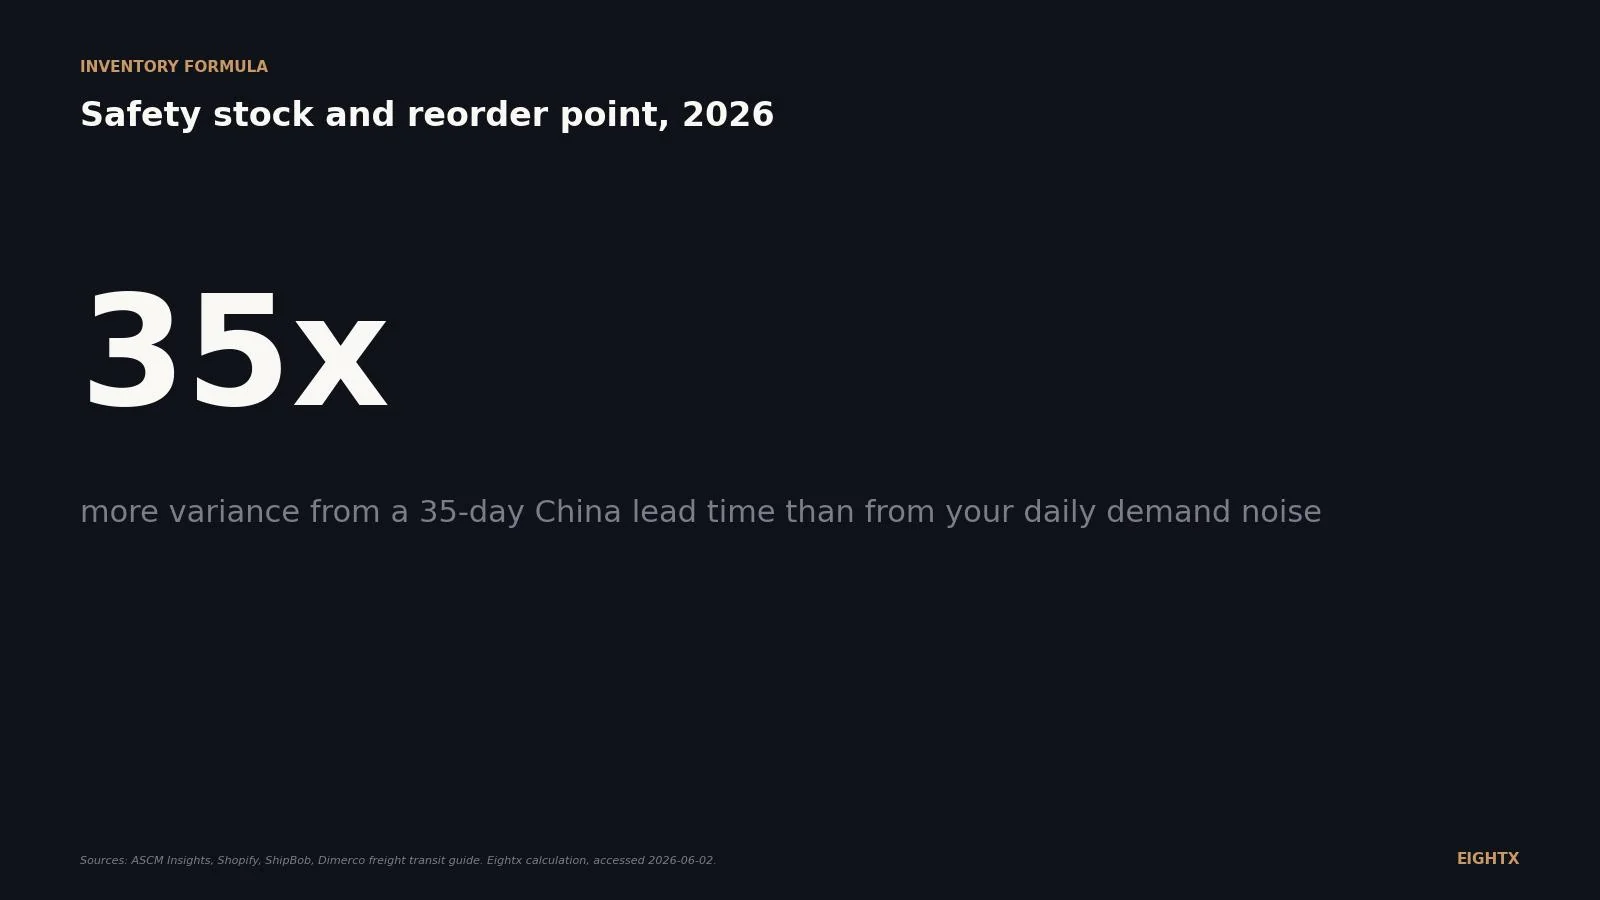
Safety stock (SS) is the buffer inventory a brand holds to absorb the variability of demand and lead time. Reorder point (ROP) is the on-hand quantity that triggers the next purchase order (PO). The two are linked by one formula: ROP = (average daily demand multiplied by average lead time in days) plus safety stock. The APICS (American Production and Inventory Control Society, now ASCM) standard for sizing the buffer is SS = Z multiplied by the square root of (LT multiplied by sigmaD squared, plus D squared multiplied by sigmaLT squared), where Z is the cycle-service-level Z-score, LT is average lead time, sigmaD is the standard deviation of daily demand, D is average daily demand, and sigmaLT is the standard deviation of lead time. For a typical China-importing DTC brand on a 35-day ocean lane, the lead-time-variance term is roughly 35 times the demand-variance term, meaning freight discipline beats forecasting accuracy.
Without safety stock, you stock out on a meaningful share of replenishment cycles (30 to 50 percent depending on how skewed your lead-time distribution is) because using the average ignores the upper tail. Set safety stock too high and you trap working capital that should be funding ads, hires, or new product. The whole game is matching service level to SKU role. A hero SKU that 30 to 50 percent of your Meta spend drives traffic to deserves 97.5 to 99 percent service. A long-tail SKU with three close substitutes can run at 90 percent or even 85 percent. Auditors and lenders rarely ask about it, but every working-capital decision (PO sizing, inventory financing, 3PL contract length) sits on top of the reorder-point math.
How it works
Two formulas. The ROP formula is simple: ROP = (D multiplied by LT) plus SS. The APICS combined-variability safety-stock formula is SS = Z multiplied by sqrt(LT multiplied by sigmaD squared, plus D squared multiplied by sigmaLT squared). The Z-score is a lookup, not a judgement call: 90 percent service level = 1.28, 95 percent = 1.65, 97.5 percent = 1.96, 99 percent = 2.33, 99.5 percent = 2.58. Worked example: a hero SKU with D = 100 units per day, sigmaD = 20, LT = 35 days, sigmaLT = 7 days, unit cost $25. The combined standard deviation of demand during lead time is sqrt(35 multiplied by 400, plus 10,000 multiplied by 49) = sqrt(504,000) which is approximately 710 units. Multiply by Z to size safety stock: at 95 percent, SS is 1,170 units or $29,250. At 99 percent, SS is 1,655 units or $41,375. The 4-percentage-point service-level bump adds 485 units, or about $12,125 of working capital per SKU. Multiply across 30 hero SKUs and that is $364K of frozen inventory plus another $73K to $109K per year in carrying cost at the 20 to 30 percent industry-standard range. Why lead time dominates: for this China hero SKU, the demand-variance term contributes 14,000 and the lead-time-variance term contributes 490,000, so lead-time variance is 35 times the demand-variance term. Cutting sigmaLT from 7 days to 4 days (better forwarder, dual sourcing, air buffer) drops total safety stock by roughly 25 percent. Cutting demand forecasting error in half barely moves it. For the working-capital tie-in, see the cash conversion cycle benchmark.
Common triggers
- You are reordering on gut feel ('we are getting low') or a flat days-of-cover rule, and you are either stocking out on heroes or sitting on 90+ days of slow-mover cash.
- China lead times shifted in the last six months and the reorder-point sheet has not been recalculated.
- Your inventory days outstanding has crept up 20 percent in two quarters with no corresponding sales increase. The buffer is over-sized somewhere in the catalog.
- You are moving from nearshore (Mexico, US-domestic) to China sourcing and need to size the working-capital step-up before signing the first PO.
- Your top-10 SKUs by GMV (gross merchandise value) drive 50+ percent of Meta-spend traffic, but you are running the same service level across the whole catalog.
- A board or investor is asking what your service-level policy is and 'we eyeball it' is not a defensible answer.
The most common mistake
Treating safety stock as a flat days-of-cover rule across the whole catalog instead of tiering by SKU role. Operators set a sitewide '45 days of cover' policy, then overstock long-tail SKUs (where a stockout has near-zero CAC consequence because the buyer just picks a substitute) and understock heroes (where a stockout burns the Meta dollars already spent acquiring the click). The fix is a three-step quarterly review. First, tier every top-100 SKU by role: hero/paid-traffic anchor (98 to 99 percent service), primary catalog (95 to 97.5 percent), secondary mid-tail (90 to 95 percent), long-tail substitutable (85 to 90 percent). Second, measure your actual sigmaLT from the last 12 PO receipts. If it is over 8 days for your China lane, the next move is not a better forecast, it is a conversation with the forwarder or a second supplier. Third, recalculate quarterly, not annually. Demand patterns shift, lead times shift, and hero-SKU rotation is faster than most operators admit. A January reorder-point sheet on autopilot through October is how brands end up with $500K of dead long-tail inventory and stockouts on a SKU that became a hero in June. For the CFO bridge on tiering and working capital, see interim CFO services.
Browse the full ecommerce finance glossary for every metric and money term a DTC operator needs.
Frequently Asked Questions
what is the difference between safety stock and reorder point?
Safety stock is the buffer (a quantity sized to absorb variability). Reorder point is the trigger level that says place the next PO now (also a quantity, but it is the buffer PLUS the demand you expect to consume during lead time). The ROP formula is ROP equals (average daily demand multiplied by average lead time in days) plus safety stock. People mix the two up constantly. Safety stock is one input to the ROP formula, not the same number.
how do i calculate safety stock with lead-time variability?
Use the APICS combined-variability formula: SS equals Z multiplied by the square root of (LT multiplied by sigmaD squared, plus D squared multiplied by sigmaLT squared). Z is your service-level Z-score (95 percent equals 1.65, 97.5 percent equals 1.96, 99 percent equals 2.33), LT is average lead time in days, sigmaD is the standard deviation of daily demand, D is average daily demand, and sigmaLT is the standard deviation of lead time in days. The square-root term blends demand noise and lead-time noise into one combined standard deviation of demand during lead time.
should ecom brands aim for a 95 or 99 percent service level?
It depends on the SKU role. Hero SKUs that Meta dollars drive traffic to should run 97.5 to 99 percent because a stockout there does not just lose the sale, it burns the ad spend already committed acquiring the click. Primary catalog runs 95 to 97.5 percent. Long-tail substitutable SKUs can run 90 percent or even 85 percent because if you stock out the buyer just picks the next one. Tier by role, do not pick one number for the whole catalog.
how much working capital does safety stock tie up?
In the 35-day China-lead-time worked example, going from 95 to 99 percent service level on one hero SKU at $25 cost adds roughly $12,125 of frozen inventory. Multiply that across 30 hero SKUs and you have added $364K of working capital for a 4-percentage-point service-level bump. Carrying cost usually runs 20 to 30 percent of average inventory value per year, so $364K trapped costs you another $73K to $109K annually.
is the max-minus-average simplified safety-stock formula good enough for shopify brands?
It is fine as a sanity check but does not target a specific service level, which means you cannot defend it to a board or use it to tier the catalog. The simplified version (SS equals max daily sales multiplied by max lead time, minus average daily sales multiplied by average lead time) implicitly bakes in a roughly 90 to 95 percent service level depending on how extreme your max observations are. For any SKU above about $50K annual GMV, run the APICS formula so you can explicitly tier service levels across hero, primary, secondary, and long-tail roles.